. 2025 Jun 2;16(1):5101.
doi: 10.1038/s41467-025-60123-7.

Myocardial mitochondrial antiviral signaling protein promotes heart Ischemia-reperfusion injury via RIG-I signaling in mice

Affiliations

Myocardial mitochondrial antiviral signaling protein promotes heart Ischemia-reperfusion injury via RIG-I signaling in mice

Zhenyu Kang et al. Nat Commun. .

Abstract

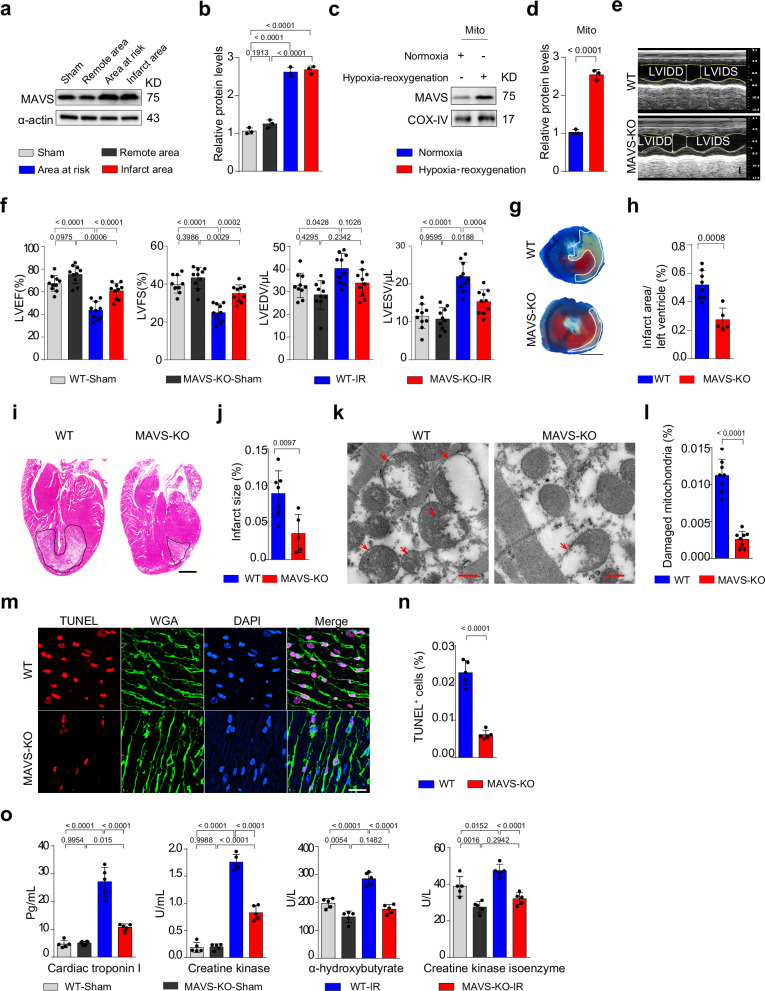
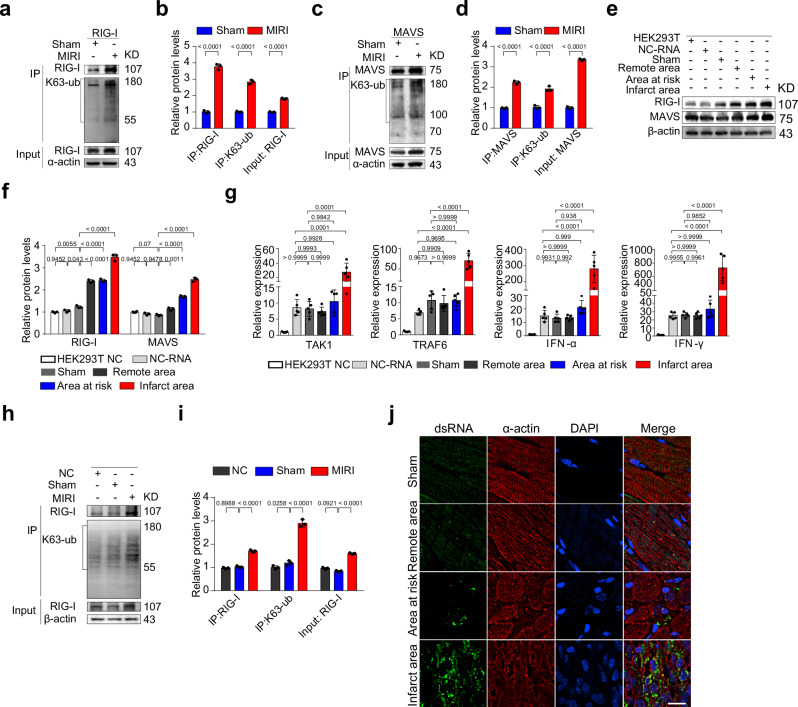
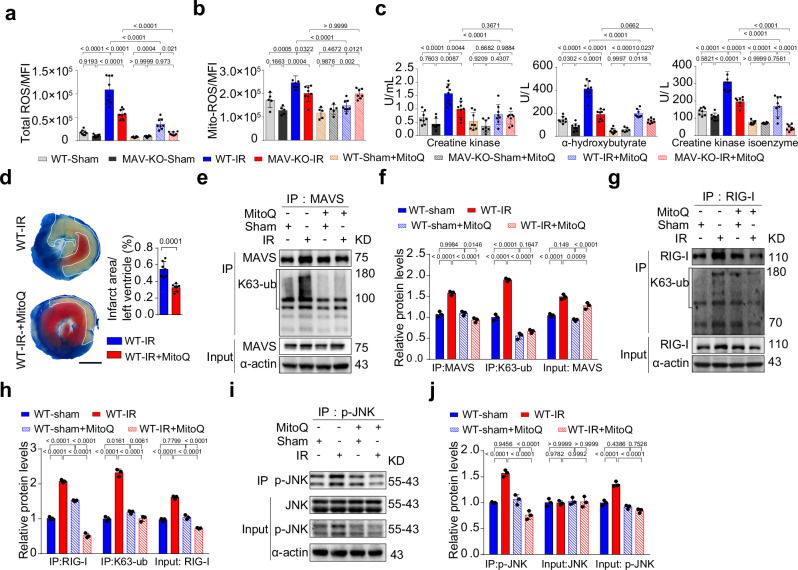
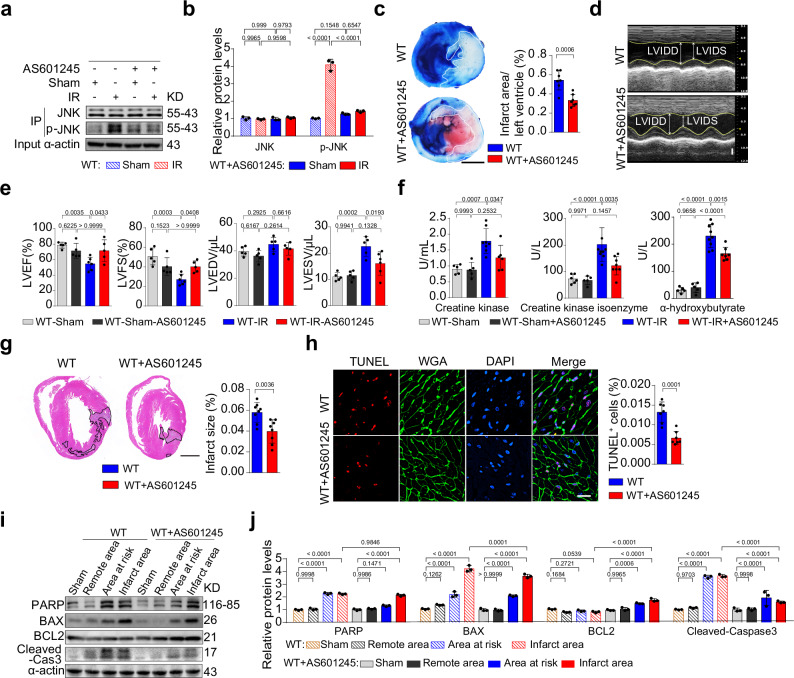
Myocardial ischemia-reperfusion injury (MIRI) is a life-threatening complication of myocardial infarcts, with inner mitochondrial membrane protein dysfunction involved in MIRI-induced heart injury. The role of outer mitochondrial membrane protein mitochondrial antiviral signaling protein (MAVS) is unknown. Here, we show that MAVS expression increases in infarcted myocardium of male wild-type mice. Global MAVS-knock-out or myocardial-specific MAVS knockdown protects male mice from acute and chronic MIRI. MIRI induces double-stranded RNA in affected myocardium, activating intracellular retinoic acid-inducible gene I (RIG-I) signaling, which leads to MAVS aggregation and subsequent non-canonical downstream signaling. MAVS aggregates recruit tumor necrosis factor-associated factor family 6 (TRAF6) and transforming growth factor-β-activated kinase 1 (TAK1), the activating mitogen-activated protein kinase (MAPK) pathway and apoptosis. MAVS-knock-out reduces c-jun-NH2 terminal kinase (JNK) phosphorylation and apoptosis. JNK inhibition protects against MIRI in wild-type male mice, whereas JNK agonist impairs protection in MAVS-knock-out male mice. MIRI activates RIG-I/MAVS pathway and subsequently triggers the TAK1/TRAF6 complex, leading to the activation of the MAPK/JNK signaling cascade. This sequential activation cascade may serve as a potential therapeutic target for MIRI.


Conflict of interest statement

Competing interests: The authors declare no competing interests.

Figures

Fig. 1
Fig. 1. MAVS deficiency protects hearts from MIRI in vivo.
a MAVS expression in remote area, area at risk and infarct area of WT hearts in sham vs 6-hour reperfusion mice. b Statistical analyses in (a). c MAVS expression in mitochondrial preparations of HL-1 cells after 6 h hypoxia and 8 h reoxygenation, with mitochondrial cytochrome coxidase IV (COX-IV) as the mitochondrial internal reference. d Statistical analyses in (c). e Echocardiography of WT vs MAVS-KO mice at 6 h reperfusion. Yellow line shows the left ventricle anterior and posterior wall position, white double-tailed arrow shows the inside diameter. LVIDS is left ventricular internal diameter at end systole, LVIDD at end diastole. Scale bar, 1 mm. f Cardiac contractility parameters of WT vs MAVS-KO mice at 6 h of reperfusion. Left ventricular ejection fraction (LVEF), left ventricular fraction shortening (LVFS), left ventricular end-systolic volume (LVESV), left ventricular end-diastolic volume (LVEDV). n = 10. g 2, 3, 5-triphenyltetrazolium chloride + Evans blue staining of WT vs MAVS-KO mice at 1 day of reperfusion. Scale bar, 2 mm. h Infarct volume ratio from staining in (g). n = 8. i Pathophysiological characteristics by hematoxylin-eosin staining in WT vs MAVS - KO mice at 3 days reperfusion. Black line shows the infarct area. Scale bar, 1 mm. j Infarct size quantification in i. n = 5. k Ultrastructure of heart infarct area in WT vs MAVS-KO mice at 6 h reperfusion by transmission electron microscopy. Red arrows indicate damaged mitochondria. Scale bar, 500 nm. l Fold change of damaged mitochondria in k. n = 8. m Terminal deoxynucleotidyl transferase-mediated 2’-deoxyuridine 5’-triphosphate nick end labeling (TUNEL) staining in WT vs MAVS-KO heart sections at 6 h after reperfusion. Wheat germ agglutinin (WGA) stains cardiomyocytes. Scale bar, 50 μm. n Apoptotic cell quantification in (m). n = 5 mice. o Serum cardiac enzymes levels at 6 h reperfusion or sham. n = 5 mice. b, d Data from 3 independent samples are presented as means ± SD. Statistical tests used: unpaired 2-tailed Student t test for (d, h, j, l, n); one-way ANOVA with Tukey’s test for (b, f, o). Significance levels: *p < 0.05, **p < 0.01, ***p < 0.001, ****p < 0.0001, ns (p ≥ 0.05). Source data are in the Source Data file.
Fig. 2
Fig. 2. Myocardium-specific MAVS knockdown phenotype mirrors the heart phenotype of global MAVS knockout during MIRI.
a Echocardiography of MAVS knockdown (MAVS-sh) and negative control knockdown (NC-sh) mice at 6 h reperfusion. Yellow line shows the left ventricle anterior and posterior wall position, white double-tailed arrow shows the inside diameter. LVIDS, Left ventricular internal diameter end systole; LVIDD, Left ventricular internal diameter end diastole. Scale bar, 1 mm. b Cardiac left ventricular ejection fraction (LVEF), left ventricular fraction shortening (LVFS), left ventricular end-systolic volume (LVESV) and left ventricular end-diastolic volume (LVEDV) in MAVS-sh and NC-sh mice at 6 h reperfusion or sham. n = 10 mice per group. c Infarct volume in left ventricle based on 2, 3, 5-triphenyltetrazolium chloride + evans blue staining. n = 7 mice per group. d Pathophysiological features by hematoxylin-eosin staining in MAVS-sh mice and NC-sh mice at 3 days reperfusion. The black line shows the infarct area. Scale bar, 1 mm. e Infarct sizes quantification in (d). n = 7. Data are shown with 7 biologically independent samples. f Terminal deoxynucleotidyl transferase-mediated 2’-deoxyuridine 5’-triphosphate nick end labeling (TUNEL) staining in heart sections of MAVS-sh and NC-sh mice at 3 days reperfusion. Scale bar, 50 μm. g Apoptotic cell percentage in intact 4’,6-diamidino-2-phenylindole (DAPI) positive cells in (f). n = 5 mice. h Ultrastructure of infarct area at 6 h reperfusion by transmission electron microscope. Red arrows indicate damaged mitochondria. Scale bar, 500 nm. i Damaged mitochondria percentage quantified in MAVS-sh and NC-sh mice. n = 10 mice in each group. j Cardiac enzymes detection in the serum at 6 h reperfusion or sham. n = 5 mice. k Reactive oxygen species in cardiac tissue at 6 h reperfusion or sham. n = 5 mice. Data are means ± standard deviation; statistical analyses were conducted by unpaired 2-tailed Student t test (c, e, g, i) and one-way analysis of variance with Tukey’s multiple comparisons test (b, j, k); *p < 0.05, **p < 0.01, ***p < 0.001; ****p < 0.0001, ns, p ≥ 0.05. Source data are provided as a Source Data file.
Fig. 3
Fig. 3. Myocardium-specific MAVS deficiency protects the heart at late stages of MIRI.
a Comparison of heart weight to body weight ratio at 14 days reperfusion in MAVS knockdown (MAVS-sh) mice and control mice (NC-sh). n = 5. b Wheat germ agglutinin staining of cardiac myocytes. Scale bar, 50 μm. c Cardiomyocyte size measured in myocardial tissue sections. n = 20 cells/group. d Echocardiography of MAVS-sh and NC-sh mice at day 14 after reperfusion. Yellow line shows left ventricle wall positions, white double-tailed arrow represents the inner diameter. LVIDS, Left ventricular internal diameter end systole; LVIDD, Left ventricular internal diameter end diastole. Scale bar, 1 mm. e Left ventricular ejection fraction (LVEF), left ventricular fraction shortening (LVFS), left ventricular end-systolic volume (LVESV) and left ventricular end-diastolic volume (LVEDV) were assayed to determine cardiac function in MAVS-sh and NC-sh mice at day 14 after reperfusion or sham. n = 5. f Fibrosis of heart tissue sections at day 14 after reperfusion. Pathological parameters are shown in remote area, area at risk and infarct area. Scale bar, 1 mm (panoramic), 50 μm (enlarged). g Fibrosis proportion in infarct area in f was calculated. n = 8. h Immunofluorescence staining of endothelial cell marker CD31 in cardiac tissues at day 14 after reperfusion. Scale bar, 20 μm. i Blood vessels number in high power fields was counted according to the staining results in (h). n = 8. Data are presented as means ± standard deviation; *p < 0.05, **p < 0.01, ***p < 0.001, ****p < 0.0001 by one-way analysis of variance with Tukey’s multiple comparisons test (a, c, e); *p < 0.05, ***p < 0.001 by unpaired 2-tailed Student t test (g, i); ns, p ≥ 0.05. Source data are provided as a Source Data file.
Fig. 4
Fig. 4. Endogenous host RNA produced during MIRI activate and initiate the RIG-I cascade.
a Co-immunoprecipitation assays were performed to detect lysine 63 residues (K63)-type ubiquitination of RIG-I in vivo at 6 h after reperfusion or sham. The RIG-I protein was used as the bait protein to capture the interaction protein candidates, and immunoprecipitation (IP) and input represent the protein sample to be detected, respectively. b Statistical data of protein expression in (a). c K63-type ubiquitination of MAVS in vivo was determined by co-immunoprecipitation assay. The MAVS protein acts as the bait protein to capture the interaction proteins, and IP and input represent the protein sample to be detected, respectively. d Statistical data of protein expression in (c). e RIG-I and MAVS expression was determined by western blot in HEK293T cells transfected with RNA extracted from heart tissues at remote area, area at risk and infarct area after 6 h post-reperfusion or sham group, and RNA extracted from unrelated normal cells was negative control RNA (NC-RNA). f Statistical data of protein expression in (e). g Transcriptional levels of transforming growth factor-β-activated kinase 1 (TAK1), tumor necrosis factor-associated factor family 6 (TRAF6), interferon-α (IFN-α) and interferon-γ (IFN-γ) in HEK293T cells treated as described in (e). h K63-type ubiquitination of RIG-I was determined by co-immunoprecipitation at 48 h after transfection with total RNA from heart tissues at 6 h after reperfusion versus controls. i Statistical data of protein expression in (h). j Immunofluorescence staining of double-stranded RNA (dsRNA) in myocardial tissue sections in WT mice at 1 day after reperfusion and in sham group. α-actin indicates cardiomyocytes. Scale bar, 20 μm. b, d, f, g, i Data are shown with 3 biologically independent samples. Data are means ± standard deviation; ***p < 0.001, ****p < 0.0001 by one-way analysis of variance statistics with Tukey’s multiple comparisons test (g) and *p < 0.05, **p < 0.01, ***p < 0.001, **** p < 0.0001 by two-way analysis of variance with Tukey’s multiple comparisons test (f, i); ****p < 0.0001 by unpaired 2-tailed Student t test (b, d); ns, p ≥ 0.05. Source data are provided as a Source Data file.
Fig. 5
Fig. 5. The transforming growth factor-β-activated kinase 1/tumor necrosis factor-associated factor family 6 pair participates in MAVS activation in MIRI.
a Co-immunoprecipitation was performed to determine interaction among MAVS, tumor necrosis factor-associated factor family 2/3/5/6 (TRAF2/3/5/6), transforming growth factor-β-activated kinase 1 (TAK1) in WT mice during MIRI. The experiment was repeated 3 times independently with similar results. b Immunofluorescence staining was used to detect the intracellular localization of overexpressed MAVS-S-peptide-tag (MAVS-S-tag), transforming growth factor-β-activated kinase 1-human influenza hemagglutinin (HA)-tag (TAK1-HA) and tumor necrosis factor-associated factor family 6-Flag-peptide-tag (TRAF6-Flag) proteins. Scale bar, 5 μm. c Intracellular localization of MAVS-S-tag, TAK1-HA and TRAF6-Flag proteins in HEK293T cells was determined by immunofluorescence after co-transfection with corresponding plasmids. The yellow arrow indicates the colocalization of the protein partners. Scale bar, 5 μm. d Oligomerization of MAVS in co-expression with TAK1 and TRAF6 in vitro was determined by semi-denaturing detergent agarose gel electrophoresis (SDD-AGE). MAVS and mitochondrial cytochrome coxidase IV (COX-IV) expression were determined by western-blot with sodium dodecyl sulfate polyacrylamide gel electrophoresis (SDS-PAGE). COX-IV was used as the mitochondrial internal reference protein. The experiment was repeated 3 times independently with similar results. e Lysine 63 residues (K63)-type ubiquitination of MAVS co-expressed with TAK1 and TRAF6 was determined by co-immunoprecipitation assay in vitro. IP and input represent the protein sample to be detected, respectively. f Statistical data of protein expression in e, data are shown with 3 biologically independent samples. Data are means ± standard deviation; *p < 0.05, **p < 0.01, ***p < 0.001, ****p < 0.0001 by two-way analysis of variance with Tukey’s multiple comparisons test (f); ns, p ≥ 0.05. Source data are provided as a Source Data file.
Fig. 6
Fig. 6. MAVS promotes cardiomyocyte apoptosis by activating the mitogen-activated protein kinase/JNK during MIRI via the transforming growth factor-β-activated kinase 1/tumor necrosis factor-associated factor family 6 axis in vivo and affect mitochondrial function.
a Expression and analysis of RIG-I, MAVS, phosphorylated transforming growth factor-β-activated kinase 1 (p-TAK1), transforming growth factor-β-activated kinase 1 (TAK1), and tumor necrosis factor-associated factor family 6 (TRAF6) in heart tissues of sham, remote area, area at risk and infarct area after 6 h of reperfusion in MAVS-KO and WT mice. b Expression and analysis of p-JNK and JNK in hearts after 24 h of reperfusion in MAVS-KO and WT mice. c Expression and analysis of poly ADP-ribose polymerase (PARP), B-cell lymphoma-2 (BCL2), B-cell lymphoma-2-associated X protein (BAX), and cysteinyl aspartate specific proteinase 3 (cleaved caspase3) in the hearts of MAVS-KO and WT mice after 3 days reperfusion. d The determination of oxygen consumption rate (OCR) on neonatal mouse cardiac myocytes derived from WT and MAVS-KO mice. Different color-labeled region denotes corresponding OCR parameters. e The determination of OCR in neonatal mouse cardiac myocytes treated with hypoxia for 2 h and reoxygenation for 6 h. Different color-labeled region denotes corresponding OCR parameters. f Analysis of parameters involved in mitochondrial bioenergetics, including basal respiration, adenosine triphosphate (ATP) production, maximal respiration, spare respiratory capacity, proton leak, non-mitochondrial respiration, spare respiratory capacity as a% and coupling efficiency. n = 10 tests/group. ac Data are shown with 3 biologically independent samples. Data are presented as mean ± standard deviation;*p < 0.05, **p < 0.01, ***p < 0.001, ****p < 0.0001 by two-way analysis of variance with Tukey’s multiple comparisons test (ac); ns, p ≥ 0.05; by one-way analysis of variance with Tukey’s multiple comparisons test (f). *p < 0.05, **p < 0.01, ***p < 0.001, ****p < 0.0001, ns, p ≥ 0.05. Source data are provided as a Source Data file.
Fig. 7
Fig. 7. Reactive oxygen species participates in RIG-I/MAVS/JNK pathway to promote cardiomyocyte apoptosis.
a The total reactive oxygen species (ROS) was determined in heart tissue at 6 h post-reperfusion in the mitoquinone mesylate (MitoQ)-treated and untreated MIRI group and sham group in WT mice and MAVS-KO mice. b The expression levels of mitochondrial reactive oxygen species (mitoROS) was determined in heart tissue at 6 h post-reperfusion in the MitoQ-treated and untreated MIRI group and the sham group in WT mice and MAVS-KO mice. c Serum levels of myocardial injury markers creatine kinase, α-hydroxybutyrate and creatine kinase isoenzyme were determined in WT mice and MAVS-KO mice treated with or without mitoquinone mesylate at 6 h post-reperfusion. n = 8. d WT mice treated with or without MitoQ underwent 30 min of ischemia and 24 h of reperfusion. 2, 3, 5-triphenyltetrazolium chloride + Evans blue staining was performed. The ratio of infarct area to left ventricle was analyzed. n = 6. Scale bar, 2 mm. e Lysine-63 residues (K63)-type ubiquitination of MAVS in WT mice treated with or without MitoQ at 6 h post-reperfusion was determined by co-immunoprecipitation assay. f Statistical data of protein expression in (e). g K63-type ubiquitination of RIG-I in WT mice treated with or without MitoQ at 6 h post-reperfusion was determined by co-immunoprecipitation assay. h Statistical data of protein expression in (g). i Phosphorylation of JNK in WT mice treated with or without MitoQ at 6 h post-reperfusion was determined by co-immunoprecipitation assay. j Statistical data of protein expression in (i). f, h, j Data are shown with 3 biologically independent samples. Data are presented as mean ± standard deviation; ****p < 0.0001 by unpaired 2-tailed Student t test (d). **p < 0.01, ***p < 0.001, ****p < 0.0001 by one-way analysis of variance statistics with Tukey’s multiple comparisons test (f, h, j), *p < 0.05, **p < 0.01, ***p < 0.001, ****p < 0.0001 by two-way analysis of variance with Tukey’s multiple comparisons test (ac); ns, p ≥ 0.05. Source data are provided as a Source Data file.
Fig. 8
Fig. 8. JNK inhibitors protect MIRI at early stage.
a JNK and p-JNK levels measured in infarct area at 24 h post-reperfusion in AS601245-treated/untreated MIRI and sham group. b Statistical data of protein expression in (a). c WT mice with/without AS601245 underwent 30 min of ischemia and 24 h of reperfusion. 2, 3, 5-triphenyltetrazolium chloride + Evans blue staining was performed. The infarct area ratio to left ventricle was analyzed. n = 7. Scale bar, 2 mm. d Echocardiography in WT mice with/without AS601245 treatment at 6 h post-reperfusion. Yellow line shows left ventricle wall positions, white arrow the distance. LVIDS, Left ventricular internal diameter end systole; LVIDD, Left ventricular internal diameter end diastole. Scale bar, 1 mm. e Left ventricular ejection fraction (LVEF), left ventricular fraction shortening (LVFS), left ventricular end-systolic volume (LVESV) and left ventricular end-diastolic volume (LVEDV) assessed in MAVS-KO mice treated with/without AS601245 for 6 h post-reperfusion. n = 5. f Serum myocardial injury markers were determined in WT mice with/without AS601245 at 6 h post-reperfusion. n = 5. g Hematoxylin-eosin staining and analysis of WT mice sections with/without AS601245 at day 3 post-reperfusion. n = 8. Scale bar, 1 mm. h Terminal deoxynucleotidyl transferase-mediated 2’-deoxyuridine 5’-triphosphate nick end labeling (TUNEL) and wheat germ agglutinin (WGA) staining and analysis of heart sections from WT mice treated with or without AS601245 at day 3 post-reperfusion. n = 7. Scale bar, 20 μm. i Apoptosis-related proteins determined by western-blot in heart tissue areas of WT mice treated with/without AS601245 at day 3 post-reperfusion. j Statistical analysis of protein expression in (i). b, j Data are shown with 3 biologically independent samples. Data are presented as mean ± standard deviation; ****p < 0.0001 by unpaired 2-tailed Student t test (c, g, h). **p < 0.01, ***p < 0.001, ****p < 0.0001 by one-way analysis of variance statistics with Tukey’s multiple comparisons test (e, f), *p < 0.05, **p < 0.01, ***p < 0.001, ****p < 0.0001 by two-way analysis of variance with Tukey’s multiple comparisons test (b, j); ns, p ≥ 0.05. Source data are provided as a Source Data file.
Fig. 9
Fig. 9. Schematic illustration of MAVS’ role in MIRI.
MIRI-induced reactive oxygen species (ROS) activates the RIG-I signaling cascade - at least in part - by RNA generated during myocardial death, in which MAVS plays the role of a hub to regulate downstream signaling: MAVS recruits and interacts with transforming growth factor-β-activated kinase 1 (TAK1) and tumor necrosis factor-associated factor family 6 (TRAF6), and participates in the mitogen-activated protein kinase/JNK signaling pathway, which triggers apoptosis-related pathways that induce cardiomyocyte apoptosis, immune cell infiltration and adverse ventricular remodeling such as increased fibrosis and impaired angiogenesis in vivo. MAVS deficiency prevents cardiomyocyte apoptosis and reduces immune cell infiltration and fibrosis, while promoting angiogenesis. JNK inhibition protects against MIRI. The graphics were generated with BioRender (https://app.biorender.com).

References

    1. Ibáñez, B., Heusch, G., Ovize, M. & Van de Werf, F. Evolving therapies for myocardial ischemia/reperfusion injury. J. Am. Coll. Cardiol.65, 1454–1471 (2015). - PubMed
    1. Heusch, G. Cardioprotection research must leave its comfort zone. Eur. Heart J.39, 3393–3395 (2018). - PubMed
    1. Bansal, S. S. et al. Dysfunctional and proinflammatory regulatory T-Lymphocytes are essential for adverse cardiac remodeling in ischemic cardiomyopathy. Circulation139, 206–221 (2019). - PMC - PubMed
    1. Hausenloy, D. J. & Yellon, D. M. Ischaemic conditioning and reperfusion injury. Nat. Rev. Cardiol.13, 193–209 (2016). - PubMed
    1. Jernberg, T. et al. Association between adoption of evidence-based treatment and survival for patients with ST-elevation myocardial infarction. Jama305, 1677–1684 (2011). - PubMed

MeSH terms

Substances

LinkOut - more resources