. 2025 Jun 2;16(1):5109.
doi: 10.1038/s41467-025-60304-4.

Loss of CD98HC phosphorylation by ATM impairs antiporter trafficking and drives glutamate toxicity in Ataxia telangiectasia

Affiliations

Loss of CD98HC phosphorylation by ATM impairs antiporter trafficking and drives glutamate toxicity in Ataxia telangiectasia

July Carolina Romero et al. Nat Commun. .

Abstract

Ataxia-telangiectasia is a rare genetic disorder characterized by neurological defects, immunodeficiency, cancer predisposition, radiosensitivity, decreased blood vessel integrity, and diabetes. ATM, the protein mutated in Ataxia-telangiectasia, responds to DNA damage and oxidative stress, but its functional relationship to the progressive clinical manifestation of this disorder is not understood. CD98HC chaperones cystine/glutamate and cationic/neutral amino acid antiporters to the cell membrane, and CD98HC phosphorylation by ATM accelerates membrane localization to acutely increase amino acid transport. Loss of ATM impacts tissues reliant on heterodimeric amino acid transporters relevant to Ataxia-telangiectasia phenotypes, such as endothelial cells (telangiectasia) and pancreatic α-cells (fatty liver and diabetes), with toxic glutamate accumulation. Bypassing the antiporters restores intracellular metabolic balance in ATM-deficient cells and mouse models. These findings provide insight into the long-known benefits of N-acetyl cysteine in Ataxia-telangiectasia cells beyond oxidative stress through removing glutamate excess by producing glutathione.


Conflict of interest statement

Competing interests: The authors declare no competing interests.

Figures

Fig. 1
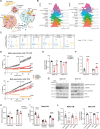
Fig. 1. ATMi impacts mitochondrial function and glutamine oxidation in HUVECs.
A Correlation analysis between the expression of ATM and gene sets involved in mitochondrial function from a cohort of normal human tissues (RNA-Seq counts provided by ARCHS4 database). B Representative blot showing the efficiency of ATMi in HUVECs treated with H2O2 (n = 6). C Flow cytometry chart showing intracellular ROS levels after KU55933 treatment (histogram shows one representative sample per condition). D Quantification of ROS levels in C. Statistical significance was calculated using the Kruskal-Wallis test with Dunn’s multiple comparison test; data represented as median ± 95% CI, from three independent experiments (n = 3). E Representative graph showing HUVEC’s metabolic potential in response to stressors (Oligomycin and FCCP) after KU55933 and NAC treatments (n = 2 with 5–6 technical replicates per experiment). F Representative graph showing mitochondrial function assay after KU55933 treatment, combined with NAC or Trolox. G Chart showing maximal respiration obtained in F. Statistical significance was calculated using the Kruskal-Wallis test; n = 3 with 5–8 technical replicates per experiment. H Correlation analysis between expression of ATM and genes involved in glutamine deprivation (ARCHS4 database). I Representative graph showing mitochondrial function assay after specific inhibition of glucose, glutamine, or fatty acids oxidation in the presence or absence of ATMi. J Chart showing maximal respiration and spare respiratory capacity after inhibition of glutamine oxidation. Statistical significance was calculated using two-way ANOVA with Šídák’s multiple comparison test; n = 3 with 6–8 technical replicates per experiment. Data in (E-G, I, J) represented as mean ± SD. *p < 0.05, ***p < 0.001. Source data are provided as a Source Data file.
Fig. 2
Fig. 2. ATMi rewires metabolism leading to glutamate accumulation and glutathione depletion.
A13C6-glucose SIRM tracing showing the major significant metabolite changes observed when comparing control (black bars) and 8 h of ATMi (KU55933; red bars) treatment on glycolysis (blue panel), pentose phosphate pathway (pink panel), and TCA cycle (green panel) in HUVECs. Presented are total unlabeled metabolite (0), informative individual 13C isotopologues, and total amount of labeled isotopologues (*Total) presented as either µmol/g protein (absolute amounts) or % 13C of Total (relative amounts of labeled and unlabeled). Statistical significance was calculated using unpaired t-test with two-stage linear step-up procedure of Benjamini, Krieger, and Yekutieli; n = 3 with 2 technical replicates per experiment. B Chart showing intracellular glutamate levels in cells treated with KU55933, NAC, and in combination. Statistical significance was calculated using one-way ANOVA with Tukey’s multiple comparison test (n = 3 with 2 technical replicates per experiment). C Chart showing intracellular GSH levels in cells treated with KU55933, NAC, and in combination. Statistical significance was calculated using one-way ANOVA with Tukey’s multiple comparison test; n = 2 with 2–3 technical replicates per experiment. D Chart showing mRNA levels (n = 2) and blots (n = 3) showing protein levels of GCLc and GCLm after ATMi. Statistical significance was calculated using two-way ANOVA with Šídák’s multiple comparison test; n = 2 with 3 technical replicates per experiment. Data represented as mean ± SD. *p < 0.05, **p < 0.01, ***p < 0.001, ****p < 0.0001. Source data are provided as a Source Data file.
Fig. 3
Fig. 3. ATM modulates the xc antiport system through phosphorylation of CD98HC.
A Representation of the xc antiport involved in cystine/glutamate transport (created in Adobe Illustrator, using selected artwork from Servier Medical Art, provided by Servier, licensed under a Creative Commons Attribution 4.0 license, https://creativecommons.org/licenses/by/4.0/). B 14C-L-cystine uptake after treatment with KU55933 or KU60019; SAS and Erastin are used as specific inhibitors of xc. Statistical significance was calculated using one-way ANOVA with Dunnett’s multiple comparison test; n = 3 with 2–4 technical replicates per experiment. C Fluorometric analysis of extracellular levels of glutamate after ATMi. Statistical significance was calculated using one-way ANOVA with Dunnett’s multiple comparison test; n = 3 with 2–4 technical replicates per experiment. D Chart showing GSH levels measured at different times following ATMi, xc inhibition (SAS) or the combination (n = 2 with 2 technical replicates per experiment). Data represented as mean ± SD. *p < 0.05, **p < 0.01, ***p < 0.001, ****p < 0.0001; asterisks show significance vs. Control. E Table showing the highly conserved SQ site in SLC3A2. F ATM consensus motif (www.phosphosite.org). G Representative images of proximity ligation assay (PLA) showing the interaction between CD98HC and ATM, shRNA-ATM cells were used to show signal specificity. H Dot blot showing binding specificity of the newly synthesized phospho-antibody. I Blots to further confirm antibody specificity in cell lysates treated with alkaline phosphatase (n = 2). J Subcellular fractionation after 2 h of treatment with H2O2. MEK1/2 and LAMIN B1 were used as cytoplasmic and nuclear markers, respectively (n = 3). K Blots showing the detection of phosphorylated CD98HC, its induction by H2O2, and inhibition by KU60019 (n = 3). L Representative images of the photoconversion assay in HEK293 cells transfected with SLC3A2 wild type or phospho-dead. The line plots on the right show average fluorescence intensity from several cell cross-section profiles (three independent experiments, also see Fig. S4B). M Chart showing quantification of fluorescence intensity 24 h after photoconversion. Statistical significance was calculated using two-way ANOVA with Šídák’s multiple comparison test; n = 15, from two independent experiments. Data represented as median ± 95% CI. ****p < 0.0001. Source data are provided as a Source Data file.
Fig. 4
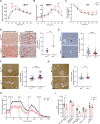
Fig. 4. ATM phosphorylation of CD98HC impacts angiogenesis.
A Drawing showing one of the two antiport systems involved in arginine uptake in endothelial cells (created in Adobe Illustrator, using selected artwork from Servier Medical Art, provided by Servier, licensed under a Creative Commons Attribution 4.0 license, https://creativecommons.org/licenses/by/4.0/). B Representative chart showing 14C-L-arginine uptake after ATMi. Statistical significance was calculated using one-way ANOVA with Tukey’s multiple comparison test; n = 3 with 2–4 technical replicates per experiment. C Picture showing the parameters evaluated in the vessel formation assay. D Representative images of the angiogenesis assay. E, F Quantification of images using the Angiogenesis Analyzer from Image J. Statistical significance was calculated using the Kruskal-Wallis test with Dunn’s multiple comparison test; n = 3 with 2 technical replicates per experiment, 10 FOV/replicate. Data represented as mean ± SD. *p < 0.05, **p < 0.01, ***p < 0.001; when not specified, asterisks show significance vs. Control. Source data are provided as a Source Data file.
Fig. 5
Fig. 5. Pancreatic a and b cells are highly sensitive to ATM and xc- inhibition.
A Simplified illustration showing TCA cycle and ATP levels modulating insulin and glucagon release (created in Adobe Illustrator, using selected artwork from Servier Medical Art, provided by Servier, licensed under a Creative Commons Attribution 4.0 license, https://creativecommons.org/licenses/by/4.0/). B Ridge plots showing ATM and SLC3A2 heterogeneous expression in human pancreatic cells (data obtained from multiple scRNA-Seq studies). C Box plots showing quantile-normalized ATM and SLC3A2 expression in different human pancreatic cell types. Statistical significance was calculated using the Mann-Whitney test; data showing median, IQR (0.25 and 0.75), whiskers extending to ±1.5*IQR (~95% CI). D Representative confluency charts of α and β cells following ATMi and xc inhibition (Erastin). Statistical significance was calculated using one-way ANOVA with Dunnett’s multiple comparison test; n = 3 with 4 technical replicates per experiment. Data represented as mean ± SEM. E, F Intracellular GSH and glutamate levels after ATMi in α and β cells. Statistical significance was calculated using two-way ANOVA with Šídák’s multiple comparison test; n = 3 with 2–3 technical replicates per experiment. G Representative blots showing CD98HC phosphorylation (S103) after H2O2 and ATMi in α and β cells (n = 2). H, I Basal respiration of α and β cells and glycolytic function of a cells after ATMi. Statistical significance was calculated using two-way ANOVA with Šídák’s multiple comparison test; n = 3 with 8–10 technical replicates per experiment. J Glucagon and insulin secretion in α and β cells after ATMi/knockout. Statistical significance was calculated using one-way ANOVA with Šídák’s multiple comparison test; n = 3 with 3 technical replicates per experiment. Data represented as mean ± SD. *p < 0.05, **p < 0.01, ***p < 0.001, ****p < 0.0001; When not specified, asterisks show significance vs. Control. Source data are provided as a Source Data file.
Fig. 6
Fig. 6. ATM deficiency impairs pancreatic islet function leading to glucose intolerance and hepatic lipid accumulation.
A, B Intraperitoneal (GTT) and oral glucose tolerance test (OGTT) in Atm+/+ and Atm–/– mice (GTT n = 6 Atm+/+, n = 4 Atm–/–; OGTT n = 3 Atm+/+, n = 4 Atm–/–). C Glucose measurements after intraperitoneal injection of insulin (ITT, n = 6 Atm+/+, n = 4 Atm–/–). Statistical significance in (AC) was calculated using two-way ANOVA with Šídák’s multiple comparison test; data represented as mean ± SEM. D Representative images and quantification of lipid levels by Oil Red O staining in the liver from 6-month-old Atm+/+ (n = 6) and Atm–/– (n = 5) mice and A-T patients. E Representative images of glucagon staining in pancreas from Atm+/+ (n = 5) and Atm–/– (n = 8) mice and resultant quantification (each dot represents a single islet). F, G Representative images and quantification of glutamate and glutamine staining in pancreatic islets of Atm+/+ (n = 5) and Atm–/– (n = 8) mice (each dot represents a single islet). Statistical significance in (DG) was calculated using a two-tailed Mann-Whitney test; data represented as median ± 95% CI. H Mitochondrial respiration of pancreatic islets isolated from 6-month-old Atm+/+ (n = 5) and Atm–/– (n = 4) mice. Data represented as mean ± SEM. I Parameters evaluated in (H) show glucose response and mitochondrial performance in Atm+/+ vs. Atm–/– mice (each dot represents an animal). Statistical significance was calculated using two-way ANOVA with Šídák’s multiple comparison test; data represented as mean ± SD. *p < 0.05, **p < 0.01, ****p < 0.0001. Source data are provided as a Source Data file.
Fig. 7
Fig. 7. NAC supplementation rescues the metabolic defects shown in ATM-deficient mice.
A, B Intraperitoneal (GTT) and oral glucose tolerance test (OGTT) in Atm+/+ and Atm–/– mice supplemented with NAC (GTT n = 9 Atm+/+, n = 7 Atm–/–, n = 8 Atm–/– + NAC; OGTT n = 3 Atm+/+, n = 4 Atm–/–, n = 4 Atm–/– + NAC). Statistical significance was calculated using two-way ANOVA with Dunnett’s multiple comparison test. Data represented as average ± SEM. C Representative images of Oil Red O staining in the liver from 6-month-old Atm+/+ (n = 6) and Atm–/– (n = 5) mice supplemented with NAC (Atm+/+ + NAC n = 3, Atm–/– + NAC n = 4). Representative images and quantification of glucagon (D) and glutamate (E) staining in pancreas from Atm +/+ and Atm –/– mice supplemented with NAC (each dot represents a single islet, n = 5 Atm+/+, n = 8 Atm–/–, n = 3 Atm+/+ + NAC, n = 4 Atm–/– + NAC). Statistical significance was calculated using the Kruskal-Wallis test with Dunn’s multiple comparison test; data represented as median  ± 95% CI. *p < 0.05, ***p < 0.001, ****p < 0.0001; when not specified, asterisks show significance vs. control. Source data are provided as a Source Data file.

Update of

References

    1. Gatti, R. A. et al. Localization of an Ataxia-telangiectasia gene to chromosome 11q22–23. Nature336, 577–580 (1988). - PubMed
    1. Chun, H. H. & Gatti, R. A. Ataxia–telangiectasia, an evolving phenotype. DNA Repair3, 10.1016/j.dnarep.2004.04.010 (2004). - PubMed
    1. Alexander, A. et al. ATM signals to TSC2 in the cytoplasm to regulate mTORC1 in response to ROS. Proc. Natl. Acad. Sci. USA107,10.1073/pnas.0913860107 (2010). - PMC - PubMed
    1. Kozlov, S. V. et al. Reactive oxygen species (ROS)-activated ATM-dependent phosphorylation of cytoplasmic substrates identified by large-scale phosphoproteomics screen. Mol. Cell. Proteom.15, 10.1074/mcp.M115.055723 (2016). - PMC - PubMed
    1. Paull, T. T. & Paull, T. T. Mechanisms of ATM activation. Annu. Rev. Biochem.84, 10.1146/annurev-biochem-060614-034335 (2015). - PubMed

MeSH terms