. 2025 Jun 2;15(1):19247.
doi: 10.1038/s41598-025-03650-z.

First national survey of terrestrial biodiversity using airborne eDNA

Affiliations

First national survey of terrestrial biodiversity using airborne eDNA

Orianne Tournayre et al. Sci Rep. .

Abstract

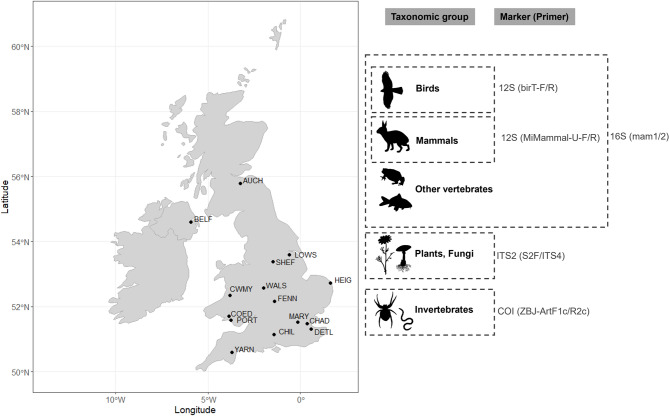
Near real-time data across taxa are necessary for quantifying biodiversity at regional to continental scales and evaluating conservation measures. Yet, standardized methods and globally distributed infrastructure are still lacking. In this study, we conducted the first national survey of terrestrial biodiversity using a metabarcoding approach on airborne environmental DNA collected by a national ambient air quality monitoring network. Our goal was to perform a multi-taxonomic biodiversity assessment at a national scale, compare detections with those of another large-scale monitoring approach (citizen sciences) and estimate a tentative minimum eDNA transportation distance. We identified over 1,100 taxa, including vertebrates, invertebrates, protists, fungi and plants covering a wide range of life history traits and ecological niches. Citizen science and eDNA detections were complementary, with eDNA better mapping less charismatic and difficult to spot taxa, demonstrating its potential to align with global conservation goals. Airborne eDNA signals were relatively local (< 80 km), likely due to the deposition of the larger particles from the air over shorter distances and limited wind transportation at near ground level. Overall, our results show that molecular protocols integrated into existing air quality monitoring networks can provide standardized, biodiversity monitoring at relatively low field cost, with potential for broad scalability.

Keywords: Airborne environmental DNA; Biodiversity; Large-scale monitoring; Metabarcoding; Terrestrial life.


Conflict of interest statement

Declarations. Competing interests: The authors declare no competing interests.

Figures

Fig. 1
Fig. 1
Map of the 15 sampling sites across the UK Heavy Metals monitoring network: one site in Northern Ireland (BELF = Belfast Centre), one site in Scotland (AUCH = Auchencorth Moss), ten sites in Great-Britain (LOWS = Scunthorpe Low Santon, SHEF = Sheffield Devonshire Green, WALS = Walsall Pleck Park, HEIG = Heigham Holmes, FENN = Fenny Compton, MARY = London Marylebone Road, CHAD = Chadwell St Mary, DETL = Detling, CHIL = Chilbolton Observatory, YARN = Yarner Wood), and three sites in Wales (CWMY = Cwmystwyth, COED = Swansea Coedgwilym, and PORT = Port Talbot Margam). The latitude and longitude of each site are publicly available on the UK AIR Air Information resource webpage (https://uk-air.defra.gov.uk/interactive-map?network=metals). The targeted taxonomic groups and associated markers and primer pairs are indicated on the right panel. The map was created using the ggplot2, dplyr, sf and rnaturalearth R packages.
Fig. 2
Fig. 2
Representation of total ASV richness across sites and groups: Birds (Passeriformes, Anseriformes, Galliformes, Apodiformes, Columbiformes, Charadriiformes, Podicipediformes, Accipitriformes, Pelecaniformes, Psittaciformes, Suliformes, Piciformes, Gruiformes, Strigiformes, undefined), Mammals (Chiroptera, Artiodactyla, Carnivora, Perissodactyla, Eulipotyphla, Rodentia, Lagomorpha, Primates, undefined), Other vertebrates (fish, amphibian, undefined), Arthropods (Insecta, Arachnida, Chilopoda, Collembola, Diplopoda, Copepoda, Branchiopoda, Malacostraca, Ostracoda, Thecostraca, Entognatha, undefined), Other invertebrates (Rotifera, Annelida, Nematoda, Bryozoa, Tardigrada, Echinodermata), Protists (Alveolata, Cryptista), Fungi (Ascomycota, Basidiomycota, Chytridiomycota, Mucoromycota, undefined), Plants (Anthophyta, Coniferophyta, Tracheophyte, Bryophyta, Chlorophyta, Marchantiophyta, undefined), and Not in the UK (bird, fish, mammal, Insecta). The 13 non-UK taxa (15 ASVs) likely originated from: (1) DNA contamination from the laboratory where the species are commonly handled (Tachycineata bicolor, Trachops cirrhosus, Molossus, Melanoplus), (2) lack of taxonomic resolution as similar UK species were also identified (Alauda gulgula, Lepus californicus, Pipistrellus abramus, Garrulus lidthi, Chroicocephalus maculipennis, Barbatula toni, Apodemus hermonensis, Acrocephalus orientalis). The source origin of Barbadocladius is unclear.
Fig. 3
Fig. 3
Map of the known distribution (NBN Atlas) of the top 4 most detected non domestic mammals, birds, arthropods and plants using airborne eDNA collected by the UK national ambient air quality monitoring network (185 eDNA samples at 15 sites from September 2021 to October 2022). The black and grey dots represent NBN Atlas confirmed observations for 2022 and all other years, respectively. Note that for arthropods, Cricotopus was in the top 4 but was not mapped because there were only unconfirmed records in NBN Atlas, and Columba livia, Columba palumbus, Pica pica and Erithacus rubecula had too many records in NBN Atlas (upper downloadable limit = 500,000 records), so only 2018 to 2022, 2022, 2021–2022, and 2022 records were used for these taxa respectively. The red crosses indicate the sites at which the taxa were detected using airborne eDNA, with a 18.6 km buffer area shaded in red (i.e. median of the estimated transportation distances). The sites where eDNA was not detected are indicated in blue (18.6 km buffer area). The maps were created using the ggplot2, dplyr, sf and rnaturalearth R packages. The NBN Atlas occurrence were downloaded at https://nbnatlas.org (accessed on 12 August 2024; data resource citations are available on FigShare using https://figshare.com/s/04229506308da822449c). All the PhyloPic silhouettes belong to the public domain, except for Ectopsocus (credit to Graham Montgomery, no changes, https://creativecommons.org/licenses/by/4.0/).
Fig. 4
Fig. 4
Bird detection source at each site, sorted from the highest to least number of detections (i.e. number of positive sites) from top to bottom. “Both” = detections in both the eBird and eDNA datasets, “eBird only” = detections in the eBird dataset only, and “eDNA only” = detections in the eDNA dataset only. eDNA data were obtained from a total of 185 eDNA samples, and eBird data from a total of 125 hotspots retrieved within a 5 km radius of the sites (Scunthorpe Low Santon, Chilbolton Observatory, Cwmystwyth and Port Talbot Margam had 1 hotspot each, Coedgwilym Cemetery = 2, Detling = 3, Fenny Compton = 4, Yarner Wood = 8, Belfast Centre = 9, Chadwell St Mary = 10, Auchencorth Moss = 12, Sheffield Devonshire Green = 17, Heigham Holmes = 23 and London Marylebone Road = 33), including 4,319 checklists and 1,642 observers. Sites are sorted from the lowest to highest number of retrieved hotspots. Walsall Pleck Park was not included in the analysis as there was no eBird observation in a 5 km radius of the site in 2022.
Fig. 5
Fig. 5
Detection source percentage per taxonomic group (vertebrates, arthropods, other invertebrates, fungi, plants and protists). “Both” = percentage of detections in both the iNaturalist and eDNA datasets, “iNaturalist only” = percentage of detections in the iNaturalist dataset only, and “eDNA only” = percentage of detections in the eDNA dataset only. The numbers of taxa in the iNaturalist checklists (total of 1,421 taxa from 12,196 observations) and the eDNA dataset (1,227 taxa from 185 samples) are indicated between brackets for each taxonomic group.

References

    1. Pereira, H. M., Navarro, L. M. & Martins, I. S. Global biodiversity change: The bad, the good, and the unknown. Annu. Rev. Environ. Resour.37, 25–50 (2012).
    1. Pereira, H. M. et al. Global trends and scenarios for terrestrial biodiversity and ecosystem services from 1900 to 2050. Science384, 458–465 (2024). - PubMed
    1. Faria, D. et al. The breakdown of ecosystem functionality driven by deforestation in a global biodiversity hotspot. Biol. Conserv.283, 110126 (2023).
    1. Magurran, A. E. et al. Long-term datasets in biodiversity research and monitoring: Assessing change in ecological communities through time. Trends Ecol. Evol.25, 574–582 (2010). - PubMed
    1. Gering, J. C., Crist, T. O. & Veech, J. A. Additive partitioning of species diversity across multiple Spatial scales: Implications for regional conservation of biodiversity. Conserv. Biol.17, 488–499 (2003).

MeSH terms

Substances

LinkOut - more resources