. 2025 Jun 2;12(1):927.
doi: 10.1038/s41597-025-05104-7.

A Transcriptomic Dataset of Embryonic Murine Telencephalon of Fmr1-Deficient Mice

Affiliations

A Transcriptomic Dataset of Embryonic Murine Telencephalon of Fmr1-Deficient Mice

Sara Ebrahimiazar et al. Sci Data. .

Abstract

Fragile X syndrome (FXS) is a neurodevelopmental disorder caused by mutations in the fragile X messenger ribonucleoprotein 1 (FMR1) gene. FXS patients exhibit autistic behaviors and abnormal brain structures, with notable sex differences. However, the mechanisms by which Fmr1 deficiency leads to these sex differences during brain development remain unclear. In this study, we performed bulk RNA sequencing on telencephalon samples of Fmr1-knockout mice of both sexes at embryonic day (E) 14.5, i.e., at the peak of neurogenesis. Clustering analysis revealed gene expression differences influenced by Fmr1 gene dosage and sex. We found that majority of the transcripts were shared between male and female sample groups, while a smaller number were unique to each sex. Our dataset underscores the importance of studying brain development during the embryonic period to detect sex-dependent genetic factors which contribute to neurodevelopmental disorders.


Conflict of interest statement

Competing interests: The authors declare no competing interests.

Figures
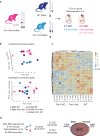
Fig. 1
Fig. 1
Mating scheme to obtain samples for RNA sequencing experiment and the clustering analyses. (a) Mating strategy used to generate five possible offspring genotypes. Fmr1-het female mice were crossed with WT or Fmr1-KO male mice. Telencephalon tissues were collected at E14.5, including male WT (X+Y), male Fmr1-KO (XY), female WT (X+X+), female Fmr1-het (X+X), and female Fmr1-KO (XX). (b) Three-dimensional PCA plots illustrating clustering of sample groups. The PCA plot in the upper graph represents all genes excluding genes with 0 variance, and the PCA plot in the lower graph represents an additional exclusion of sex chromosome genes from the analysis. PC1, PC2, and PC3 values are shown on the X-, Y-, and Z-axis, respectively. Sample groups are represented by distinct shapes and colors: male WT (dark blue circles), male Fmr1-KO (light blue squares), female WT (red circles), female Fmr1-het (dark pink diamonds), and female Fmr1-KO (light pink squares). (c) Hierarchical clustering and heatmap showing gene expression. The scale bar represents z-score normalization of the expression (count) values with the high expression levels indicated in red color and low expression levels in blue. The first six columns represent Fmr1-KO (male and female Fmr1-KO), the next three columns represent female Fmr1-het, and the final six columns represent WT (male and female WT) samples. (d) Analysis of the number of sex specific transcripts. Whole telencephalon tissue from all biological groups (n = 3) was used for RNA extraction and sequencing, identifying 49,585 transcripts. These were divided into male (male WT and Fmr1-KO) and female (female WT, Fmr1-het, and Fmr1-KO) samples. After filtering out genes with zero raw counts in all groups, 27,202 transcripts remained in the male list and 27,851 in the female list. Of these, 88.1% of the genes were shared, with 4.8% unique to males and 7% unique to females.
Fig. 2
Fig. 2
Data distribution and differential expression of Fmr1 gene in E14.5 telencephalon of Fmr1-mutant mouse embryos. MA plots illustrating overall data distribution by comparing male WT vs Fmr1-KO, female WT vs Fmr1-het, and female WT vs Fmr1-KO. Transcripts with significant differential expression (p < 0.05) are highlighted using colored datapoints, and Fmr1 gene symbol is indicated for each comparison. The Y-axis represents log2 fold change, while the X-axis indicates the log2 of the mean of normalized gene expression levels (TPM + 1) between groups (see Methods for more details). (a) Comparison of male WT (dark blue) vs male Fmr1-KO (light blue). (b) Comparison of female WT (red) vs female Fmr1-het (pink). (c) Comparison of female WT (red) vs female Fmr1-KO (light pink).

References

    1. Ciaccio, C. et al. Fragile X syndrome: a review of clinical and molecular diagnoses. Ital J Pediatr43, 39 (2017). - PMC - PubMed
    1. Hunter, J. et al. Epidemiology of fragile X syndrome: A systematic review and meta‐analysis. Am J Med Genet A164, 1648–1658 (2014). - PubMed
    1. Eliez, S. Brain anatomy, gender and IQ in children and adolescents with fragile X syndrome. Brain124, 1610–1618 (2001). - PubMed
    1. Reiss, A. L., Freund, L., Vinogradov, S., Hagerman, R. & Cronister, A. Parental inheritance and psychological disability in fragile X females. Am J Hum Genet45, 697–705 (1989). - PMC - PubMed
    1. Freund, L. S. Chromosome Fragility and Psychopathology in Obligate Female Carriers of the Fragile X Chromosome. Arch Gen Psychiatry49, 54 (1992). - PubMed

Substances

LinkOut - more resources