

The 3D genome of plasma cells in multiple myeloma
- PMID: 40456819
- PMCID: PMC12130518
- DOI: 10.1038/s41598-025-03132-2
The 3D genome of plasma cells in multiple myeloma
Abstract
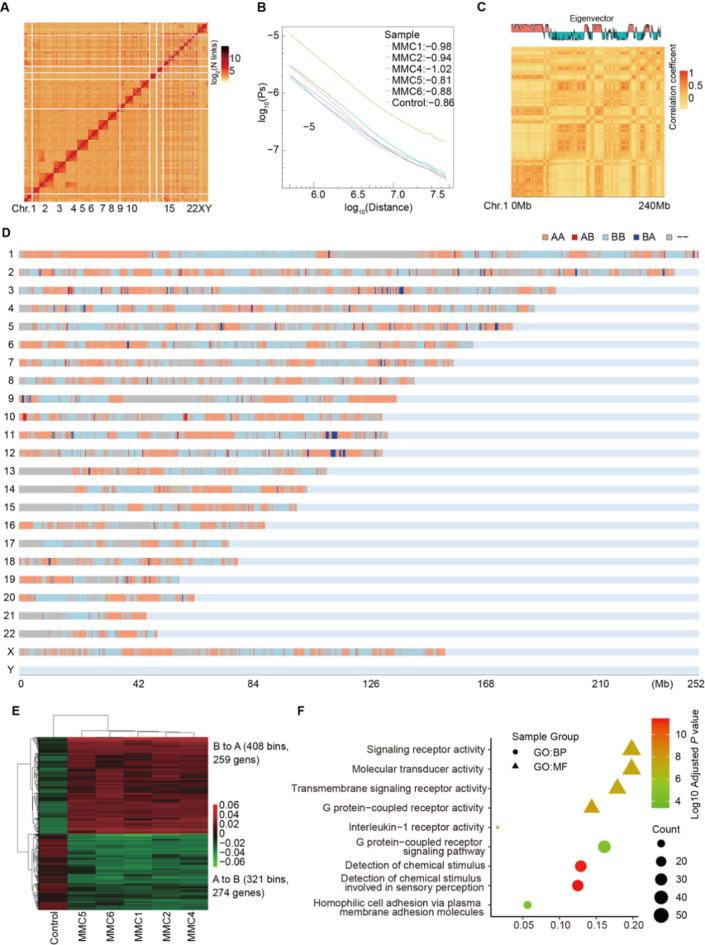
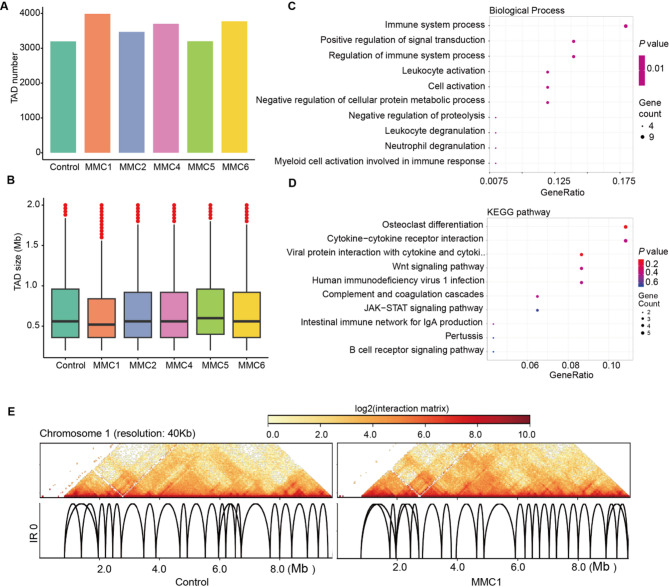
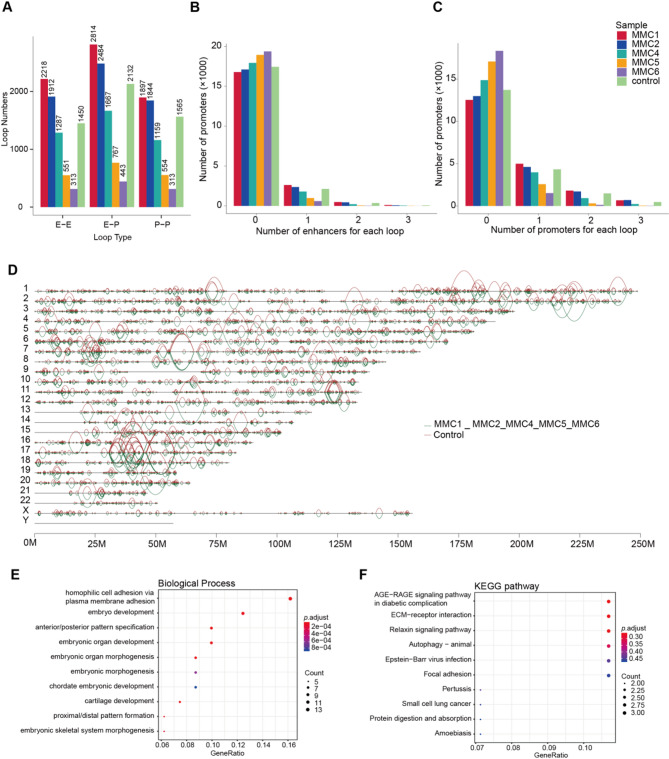
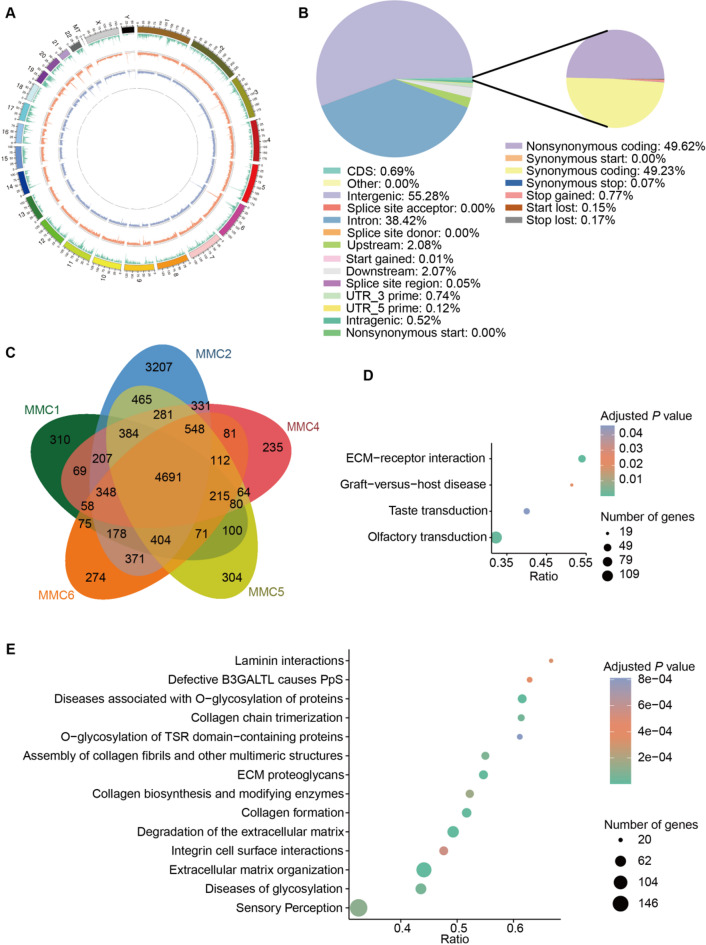
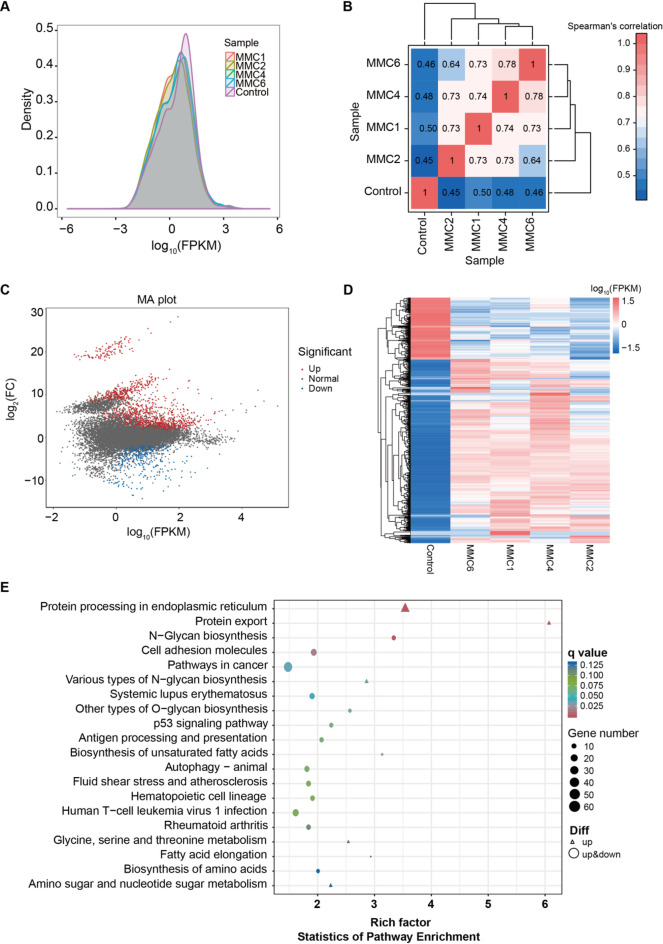
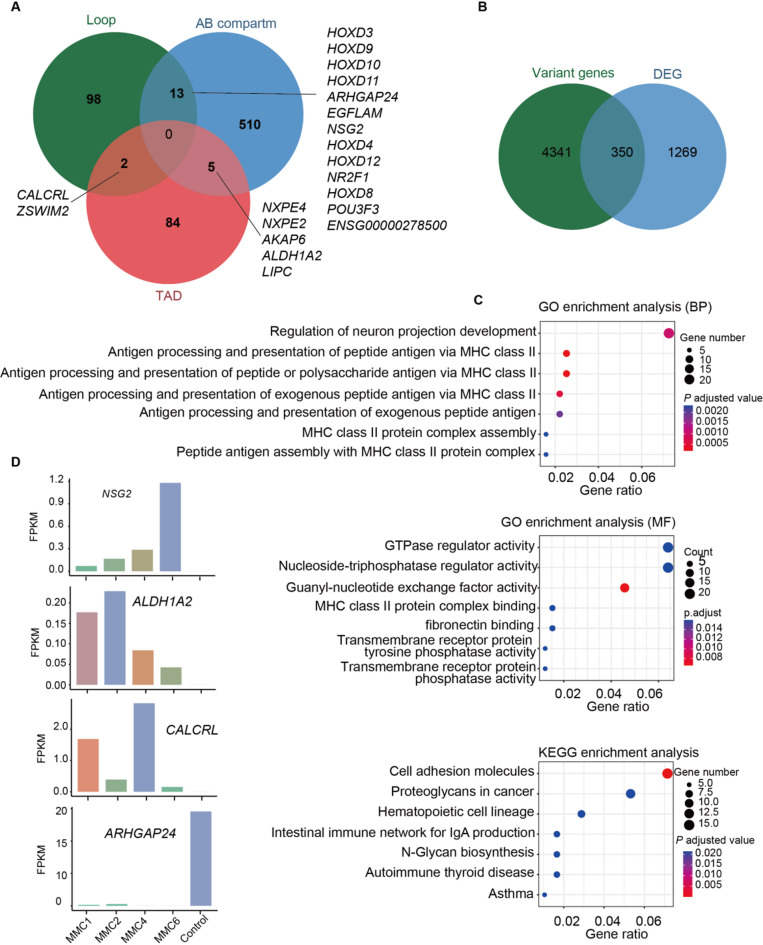
Multiple myeloma (MM) is a hematological malignancy characterized by expanding clonal plasma cells in the bone marrow (BM) that produce monoclonal immunoglobulin. It is an incurable disease, accounting for about 10% of blood malignancies and the second most common hematologic malignancy. Therefore, in-depth research into the molecular mechanisms and therapeutic targets of the disease is crucial. For the first time, we performed high-throughput chromosome conformation capture (Hi-C) analysis of plasma cells in five multiple myeloma patients, and integrated it with genome resequencing and transcriptomic associated with genomic variation and gene expression. As a result, 19 specific TAD (Topologically Associating Domain) boundaries in MM samples related to the immune response and Wnt signaling pathways were identified. Additionally, Loop structures were also analyzed, revealing that promoter-enhancer-associated loops were the most prevalent. Genomic characteristics of MM patients were explored, identifying SNPs, InDels, and CNVs, with variations in the CDS region potentially affecting gene function. Transcriptome analysis showed differentially expressed genes in MM patients, mainly involved in p53 signaling and cell adhesion. Multi-omics analysis identified overlapping genes related to MM, including those involved in MHC class II protein complex assembly and antigen presentation. The study provides insights into the complex genomic and transcriptomic changes in MM plasma cells, potentially aiding in identifying therapeutic targets.
Keywords: 3D genome; Genome resequencing; Multiple myeloma; Plasma cell; Transcriptome.
© 2025. The Author(s).
Conflict of interest statement
Declarations. Competing interests: The authors declare no competing interests. Ethics statement: All methods carried out in accordance with the relevant guidelines and regulations. This study has been approved by the Ethics Committee of Chengdu First People’s Hospital, ethics number ZXKY No.002, in 2020. All patients and blood donors in this study have signed informed consent forms by themselves or their guardian(s).
Figures
Similar articles
-
Identification of Therapy-Induced Clonal Evolution and Resistance Pathways in Minimal Residual Clones in Multiple Myeloma through Single-Cell Sequencing.Clin Cancer Res. 2024 Sep 3;30(17):3919-3936. doi: 10.1158/1078-0432.CCR-24-0545. Clin Cancer Res. 2024. PMID: 38900040 Free PMC article.
-
3D genome of multiple myeloma reveals spatial genome disorganization associated with copy number variations.Nat Commun. 2017 Dec 5;8(1):1937. doi: 10.1038/s41467-017-01793-w. Nat Commun. 2017. PMID: 29203764 Free PMC article.
-
Genomic profiling of multiple myeloma: New insights and modern technologies.Best Pract Res Clin Haematol. 2020 Mar;33(1):101153. doi: 10.1016/j.beha.2020.101153. Epub 2020 Jan 27. Best Pract Res Clin Haematol. 2020. PMID: 32139018 Review.
-
Enrichment-Free Single-Cell Detection and Morphogenomic Profiling of Myeloma Patient Samples to Delineate Circulating Rare Plasma Cell Clones.Curr Oncol. 2022 Apr 21;29(5):2954-2972. doi: 10.3390/curroncol29050242. Curr Oncol. 2022. PMID: 35621632 Free PMC article.
-
Insights from the gene expression profiling of multiple myeloma.Curr Hematol Rep. 2004 Jan;3(1):67-73. Curr Hematol Rep. 2004. PMID: 14695854 Review.
References
-
- Gogishvili, T. et al. SLAMF7-CAR T cells eliminate myeloma and confer selective fratricide of SLAMF7(+) normal lymphocytes. Blood130, 2838–2847. 10.1182/blood-2017-04-778423 (2017). - PubMed
MeSH terms
Grants and funding
LinkOut - more resources
Full Text Sources
Medical
Research Materials
Miscellaneous
