. 2025 Jul;6(7):668-680.
doi: 10.1038/s43016-025-01176-1. Epub 2025 Jun 2.

High diversity of dietary flavonoid intake is associated with a lower risk of all-cause mortality and major chronic diseases

Affiliations

High diversity of dietary flavonoid intake is associated with a lower risk of all-cause mortality and major chronic diseases

Benjamin H Parmenter et al. Nat Food. 2025 Jul.

Abstract

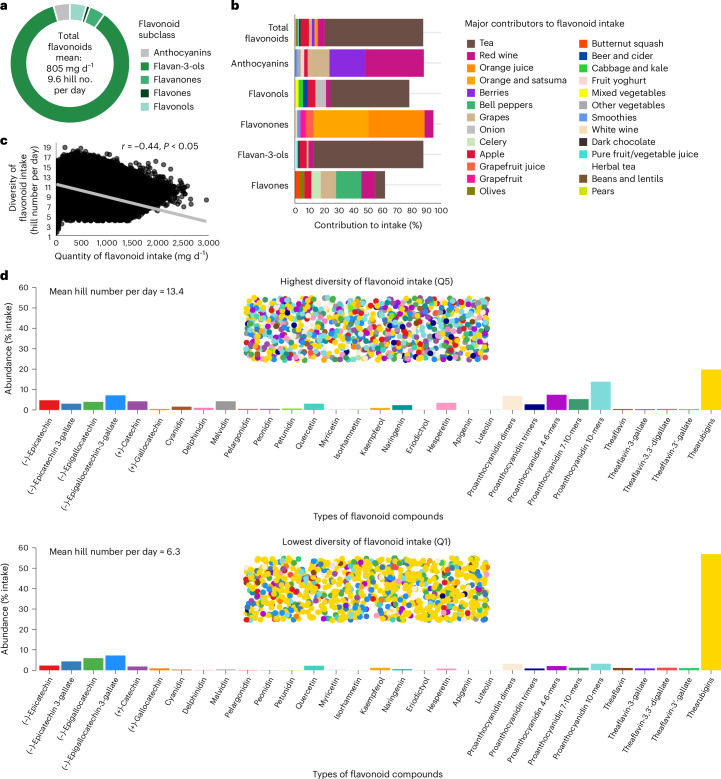
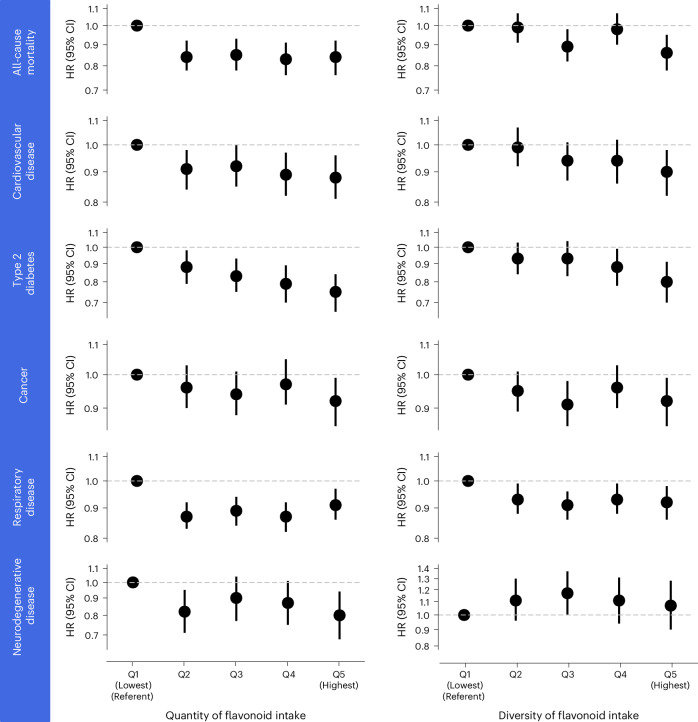
Higher habitual intakes of dietary flavonoids have been linked with a lower risk of all-cause mortality and major chronic disease. Yet, the contribution of diversity of flavonoid intake to health outcomes remains to be investigated. Here, using a cohort of 124,805 UK Biobank participants, we show that participants who consumed the widest diversity of dietary flavonoids, flavonoid-rich foods and/or specific flavonoid subclasses had a 6-20% significantly lower risk of all-cause mortality and incidence of cardiovascular disease, type 2 diabetes, cancer, respiratory disease and neurodegenerative disease. Furthermore, we report that both quantity and diversity of flavonoids are independent predictors of mortality and several chronic diseases, suggesting that consuming a higher quantity and wider diversity is better for longer-term health than either component alone. These findings suggest that consuming several different daily servings of flavonoid-rich foods or beverages, such as tea, berries, apples, oranges or grapes, may lower risk of all-cause mortality and chronic disease.


Conflict of interest statement

Competing interests: A.C. acts as an advisor to the US Highbush Blueberry Grant Committee (USHBC) and she has received research funding from the USHBC. B.H.P. consults for MaxBiocare, a company engaged in micronutrient research and related commercial activities. The other authors declare no competing interests.

Figures

Fig. 1
Fig. 1. Flavonoid intake in the UK Biobank.
a, Composition of flavonoid intake. b, Major dietary contributors to flavonoid intake, showing the topmost contributors to intake only; blank spaces up to 100% represent other smaller contributors that are not shown. c, Two-sided Pearson correlation between quantity and diversity of flavonoid intake. d, Diversity of flavonoid consumption among participants with the most (Q5) and least (Q1) diverse intakes. In d, the bar charts are matched for quantity of flavonoid intake (1,000 mg d−1) and show the average abundance (% intake) of each flavonoid per day. The dotted areas represent each diet, where each circle is an individual flavonoid and each colour is a different flavonoid (corresponding to the colours and distribution on the bar charts). Data from participants with ≥2 Oxford WebQ dietary questionnaires (n = 124,805).
Fig. 2
Fig. 2. Quantity and diversity of dietary flavonoid intake and risk of all-cause mortality and chronic disease.
HRs (95% CI) for all-cause mortality and major chronic disease according to the quantity and diversity of dietary flavonoid intake (in quintiles). HRs are from Cox proportional-hazards models using age as the underlying timescale. Quantity of flavonoid intake is mutually adjusted for diversity of flavonoid intake and vice versa. Further adjustments are made for covariates in model 5 including sex, region of residence, number of dietary assessments, BMI, smoking status, physical activity, alcohol intake, education, ethnicity, socioeconomic status plus intakes of red and processed meat, refined grains, whole grains, sugary drinks, coffee, saturated fatty acids, sodium and dietary energy, and history of diabetes (type 1 or 2; not adjusted in T2DM analysis), hypertension and hypercholesterolaemia and for analysis of all-cause mortality, further adjustments were made for prevalent CVD, cancer, respiratory disease, and neurodegenerative disease at baseline. Corresponding sample sizes, event rates and additional details are provided in Table 2.

Similar articles

Cited by

References

    1. Del Rio, D. et al. Dietary (poly)phenolics in human health: structures, bioavailability, and evidence of protective effects against chronic diseases. Antioxid. Redox Signal.18, 1818–1892 (2013). - PMC - PubMed
    1. Parmenter, B. H. et al. An overview and update on the epidemiology of flavonoid intake and cardiovascular disease risk. Food Funct.11, 6777–6806 (2020). - PubMed
    1. Hertog, M. G. L. et al. Dietary antioxidant flavonoids and risk of coronary heart disease: the Zutphen Elderly Study. Lancet342, 1007–1011 (1993). - PubMed
    1. Grosso, G. et al. Dietary flavonoid and lignan intake and mortality in prospective cohort studies: systematic review and dose–response meta-analysis. Am. J. Epidemiol.185, 1304–1316 (2017). - PubMed
    1. Bondonno, N. P. et al. Flavonoid intake is associated with lower mortality in the Danish Diet Cancer and Health Cohort. Nat. Commun.10, 3651 (2019). - PMC - PubMed

MeSH terms

LinkOut - more resources