. 2025 Jun;28(6):1174-1184.
doi: 10.1038/s41593-025-01952-z. Epub 2025 Jun 2.

Neuronal aging causes mislocalization of splicing proteins and unchecked cellular stress

Affiliations

Neuronal aging causes mislocalization of splicing proteins and unchecked cellular stress

Kevin Rhine et al. Nat Neurosci. 2025 Jun.

Abstract

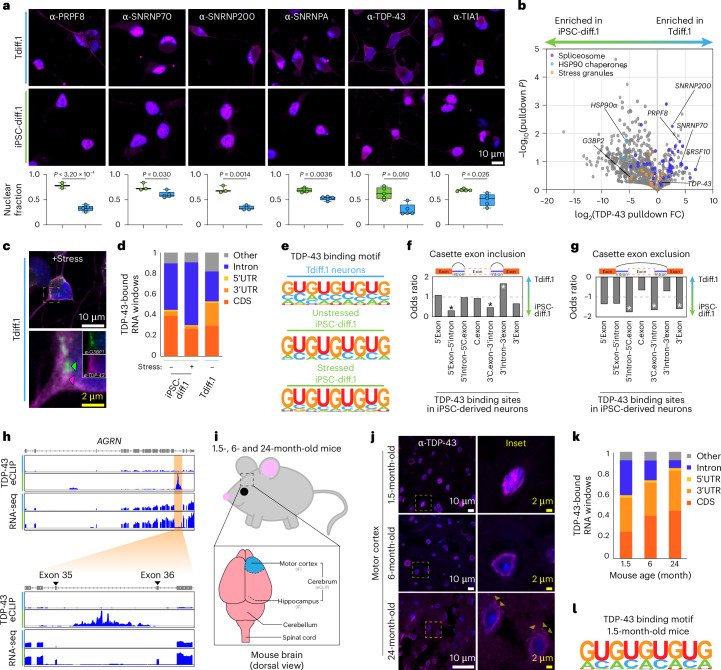
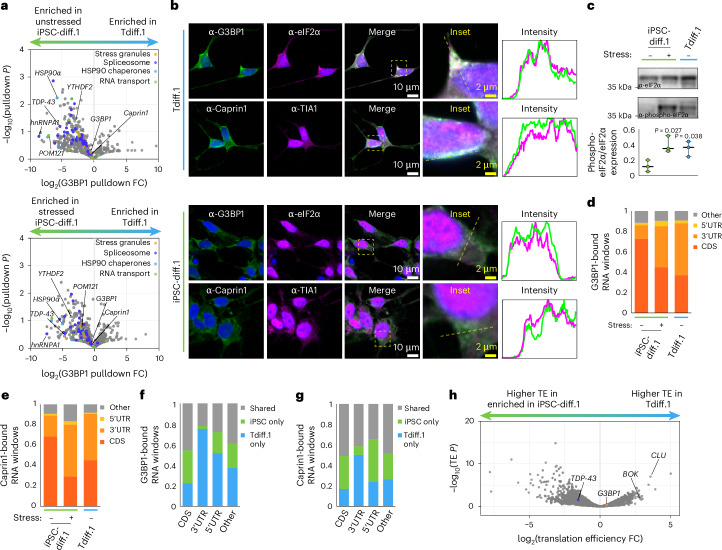
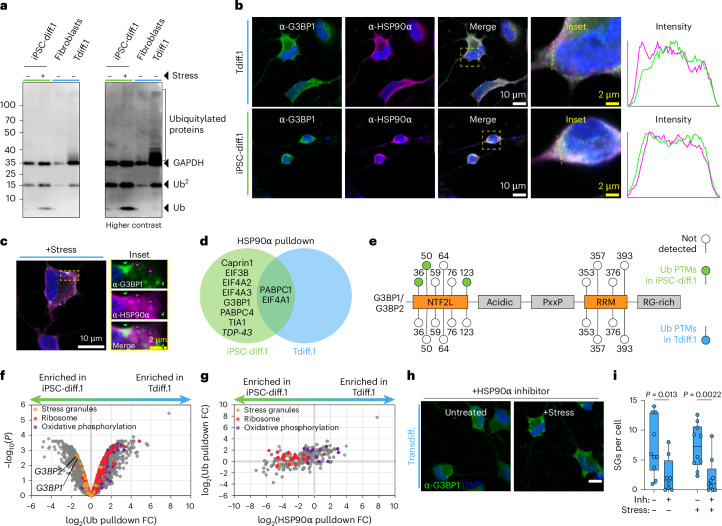
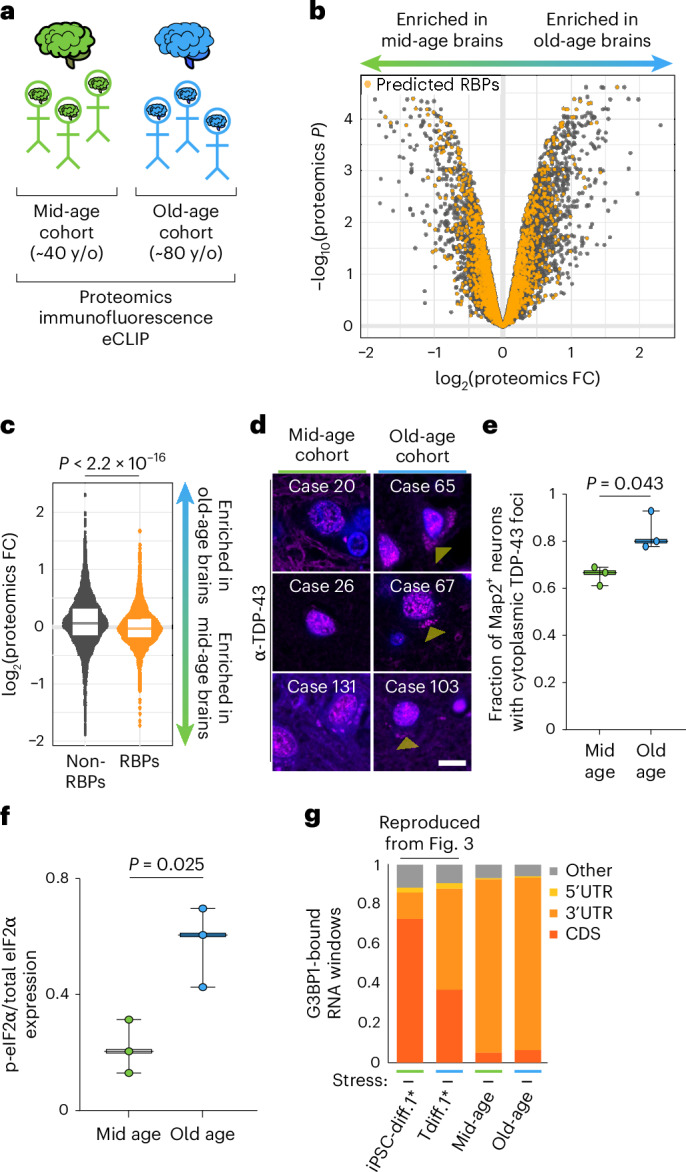
Aging is one of the most prominent risk factors for neurodegeneration, yet the molecular mechanisms underlying the deterioration of old neurons are mostly unknown. To efficiently study neurodegeneration in the context of aging, we transdifferentiated primary human fibroblasts from aged healthy donors directly into neurons, which retained their aging hallmarks, and we verified key findings in aged human and mouse brain tissue. Here we show that aged neurons are broadly depleted of RNA-binding proteins, especially spliceosome components. Intriguingly, splicing proteins-like the dementia- and ALS-associated protein TDP-43-mislocalize to the cytoplasm in aged neurons, which leads to widespread alternative splicing. Cytoplasmic spliceosome components are typically recruited to stress granules, but aged neurons suffer from chronic cellular stress that prevents this sequestration. We link chronic stress to the malfunctioning ubiquitylation machinery, poor HSP90α chaperone activity and the failure to respond to new stress events. Together, our data demonstrate that aging-linked deterioration of RNA biology is a key driver of poor resiliency in aged neurons.


Conflict of interest statement

Competing interests: G.W.Y. is a member of the Scientific Advisory Board of Jumpcode Genomics and is a cofounder, member of the Board of Directors, Scientific Advisory Board member, equity holder, and paid consultant for Eclipse BioInnovations. G.W.Y.’s interests have been reviewed and approved by the University of California San Diego, in accordance with its conflict-of-interest policies. All other authors declare no competing interests.

Figures

Fig. 1
Fig. 1. Aging leads to depletion of RBPs.
a, Schematic representation of the transdifferentiation approach. b, Brightfield images of fibroblasts undergoing transdifferentiation. Scale bar = 10 μm. c, Confocal fluorescence images of transdifferentiated (Tdiff) and iPSC-derived (iPSC-diff) neurons stained for the neuronal marker Map2. Scale bar = 10 μm. d, Scatter plot of the predicted age and CpG methylation (DNAm) age of the indicated cell types. e, Top, representative western blot of p16INK4A and tubulin expression in the indicated cell types. Bottom, quantification of average p16INK4A-to-tubulin expression for n = 3 blots, where the centerline is the median and the error bars denote the range of data values; statistics were calculated using a two-tailed Welch’s t test compared to the unstressed iPSC-derived sample. f, Confocal fluorescence images of the indicated cell types stained for c-casp-3 or AIF (green) with DAPI (blue). Scale bar = 10 μm. g, Quantification of the average fluorescence intensity of the c-casp-3 (top) or AIF (bottom) channels from f for iPSC-diff (green) and Tdiff (blue) neurons (n = 3 replicates), where the centerline is the median, the box bounds encompass the 25th–75th percentile values and error bars denote the range of data values; statistics were calculated using a two-tailed Welch’s t test. Error bars denote s.d. h, Volcano plot of differential expression of all detected transcripts as determined by RNA-seq in transdifferentiated and iPSC-derived neurons (n = 3 replicates); P values were calculated using a two-tailed Welch’s t test. i, Same as h, but for whole-cell MS (n = 3 replicates); orange points denote predicted RBPs. j, Running enrichment score plot of the top eight most significant KEGG terms for the proteomics data in i; RNA metabolic pathways are highlighted in shades of orange. k, Scatter plot of RNA-seq and proteomic differential expression for all detected transcripts. All proteins that were significantly enriched in Tdiff neurons but had normal transcript levels are highlighted pink. l, Running enrichment score of the most significant KEGG terms for the high proteomics/normal transcript (pink) region in k. c-casp-3, cleaved caspase-3; FC, fold change. Source data
Fig. 2
Fig. 2. Splicing is dysregulated in aged neurons due to mislocalization of spliceosome components.
a, Confocal fluorescence images of transdifferentiated (top row, blue) and iPSC-derived (middle row, green) neurons stained for the indicated spliceosome proteins in magenta with DAPI in blue; the average fraction of nuclear protein was calculated for each cell type (n = 3 replicates) and is plotted (bottom row) where the centerline denotes the median, the box bounds encompass the 25th–75th percentile values and the error bars denote the range of data values. Statistics were calculated using a two-tailed Welch’s t test. Scale bar = 10 μm. b, Volcano plot of AP-MS of TDP-43 (n = 2 replicates) in the indicated neurons (n = 2 replicates). Detected proteins in the indicated KEGG terms are highlighted. The P value was calculated using a two-tailed Welch’s t test. c, Airyscan fluorescence images of transdifferentiated neurons treated with sodium arsenite for 1 h and stained for G3BP1 and TDP-43. White scale bar = 10 μm; yellow scale bar = 2 μm. d, Fraction of TDP-43-bound RNA windows detected by eCLIP (n = 2 replicates) within each of the indicated transcript elements for transdifferentiated and iPSC-derived neurons. e, The top RNA-binding motif for TDP-43 eCLIP in the indicated cell types/conditions (n = 2 replicates). f, Exon inclusion odds ratio for transcripts detected by RNA-seq (n = 3 replicates) at the indicated loci around each exon with a TDP-43 binding site in iPSC-derived neurons, where *P < 0.05 calculated by a likelihood-ratio test. g, Same as f, but for exon exclusion. h, TDP-43 binding and RNA-seq intensity tracks for the AGRN locus in the indicated cell types. The orange highlighted region is depicted in the lower panel. i, Schematic representation of the mouse brain used for IF and eCLIP. j, Confocal fluorescence images of TDP-43 (magenta) and DAPI (blue) in the motor cortex of 1.5-, 6- and 24-month-old mice; the yellow dashed box indicates the inset region. White scale bar = 10 μm; yellow scale bar = 2 μm. k, Same as d, but for the indicated mouse ages (n = 2 mice per cohort). l, Same as e, but for the 1.5-month-old mouse brain. IF, immunofluorescence.
Fig. 3
Fig. 3. Aged neurons have chronic stress granules that repress translation.
a, Volcano plots of G3BP1 pulldown and MS of all detected proteins in transdifferentiated neurons versus unstressed (top) or stressed (bottom) iPSC-derived neurons (n = 2 replicates). Detected proteins included in the following KEGG terms were highlighted: spliceosome (dark blue, hsa03040), stress granules (orange, hsa03019 + 10146), HSP90 chaperones (light blue, no KEGG pathway) and RNA transport (green, hsa03013). P values were calculated using a two-tailed Welch’s t test. b, Confocal fluorescence images of stress granule markers in transdifferentiated and iPSC-derived (iPSC-diff) neurons. The yellow boxes denote the inset region, and the yellow dashed lanes indicate the intensity profiles that were normalized and plotted in the last column. White scale bar = 10 μm; yellow scale bar = 2 μm. c, Top and middle, western blots of total and phosphorylated eIF2α for the indicated samples. Bottom, quantification of average phospho-eIF2α-to-total eIF2α expression for n = 3 blots, where the centerline denotes median and the error bands denote the range of data values; statistics were calculated using a two-tailed Welch’s t test comparing the indicated samples to the unstressed iPSC-derived neurons. d, Fraction of G3BP1-bound RNA windows detected by eCLIP (n = 2 replicates) within each of the indicated transcript elements for transdifferentiated and iPSC-derived neurons. e, Same as d, but for Caprin1-bound RNAs. f, Fraction of G3BP1-bound RNA windows detected in unstressed iPSC-derived neurons and/or transdifferentiated neurons. g, Same as f, but for Caprin1-bound RNAs. h, Volcano plot of translation efficiency of all detected transcripts using Ribo-seq in transdifferentiated and iPSC-derived neurons. CDS, coding sequence; TE, translation efficiency. Source data
Fig. 4
Fig. 4. HSP90 activity antagonizes stress granule resolution in aged neurons.
a, Representative western blot of ubiquitylated proteins in the indicated neurons. b, Confocal fluorescence images of G3BP1 and HSP90α in unstressed transdifferentiated and iPSC-derived neurons. The yellow boxed region denotes the inset, and the yellow dashed line denotes the region where the intensity of G3BP1 and HSP90α was plotted. White scale bar = 10 μm; yellow scale bar = 2 μm. c, Airyscan fluorescence images of transdifferentiated neurons stressed with sodium arsenite for 1 h and stained for G3BP1 and HSP90α. White scale bar = 10 μm; yellow scale bar = 2 μm. d, Venn diagram of stress granule proteins detected by HSP90α pulldown and MS (n = 2 replicates) in iPSC-derived and/or transdifferentiated neurons. e, Schematic representation of Ub modifications detected by TUBE pulldown and MS (n = 3 replicates) in iPSC-derived neurons (upper lollipops in green) and transdifferentiated neurons (lower lollipops in blue). Unshaded circles denote that the Ub modification was not detected. f, Volcano plot of the TUBE pulldown and MS results in iPSC-diff.1 and Tdiff.1 lines (n = 3 replicates). P values were calculated using a two-tailed Welch’s t test. Orange dots represent stress granule proteins, red dots denote ribosomal proteins and purple dots denote oxidative phosphorylation proteins. g, Same as f, but for HSP90α pulldown versus TUBE pulldown efficiency. h, Confocal fluorescence images of G3BP1 (green) and DAPI (blue) in unstressed or stressed transdifferentiated neurons treated with an HSP90α inhibitor for 24 h. i, Quantification of the average number of stress granules per cell in h (n = 10 replicates). The box plot denotes the range from the 25th to the 75th percentile of data values, where the middle line is the median; the error bars denote the range of all data values. Statistics were calculated using a two-tailed Welch’s t test. Ub, ubiquitin; SGs, stress granules.
Fig. 5
Fig. 5. Transdifferentiated neurons fail to resolve stress granules after acute stress treatment.
a, Confocal fluorescence images of G3BP1 (green) and DAPI (blue) in transdifferentiated and iPSC-derived neurons at the indicated time points after 1 h of sodium arsenite treatment. Scale bar = 10 μm. b, Quantification of the average number of stress granules (n = 3 replicates) for transdifferentiated (blue) and iPSC-derived (green) neurons in a. The box plot denotes the range from the 25th to the 75th percentile of data values, where the middle line is the median; the error bars denote the range of all data values; statistics were calculated using Welch’s t test. c, Same as a, but for thapsigargin stress recovery. d, Same as b, but for thapsigargin stress recovery. e, Average RNA-seq RPKM for the indicated heat shock proteins in iPSC-derived (green) and transdifferentiated (blue) neurons (n = 3 replicates) at the indicated time points before (−), immediately after (0) or 24 h after stress (24). The centerline denotes the median, and the error bars denote the range of values. NS, not significant; P, prestress; RPKM, reads per kilobase million.
Fig. 6
Fig. 6. RNA biology is dysregulated in the aging human brain.
a, Schematic representation of the aged human brain cohorts. b, Volcano plot of all proteins detected by MS (n = 2 replicates per tissue sample; n = 3 samples per cohort) in the mid-age and old-age human brains. Predicted RBPs are highlighted in orange. c, Violin plot of all non-RBPs (gray) and RBPs (orange) expression in the mid-age and old-age brain cohorts. The box plot denotes the range of the 25th and 75th percentiles of all data points, and the centerline denotes the median. The P value was calculated using a two-tailed Welch’s t test. d, IF of TDP-43 (magenta) and DAPI (blue) in the aged human brain cohorts. Yellow arrowheads denote cytoplasmic TDP-43 foci. e, Quantification of the proportion of Map2+ neurons with cytoplasmic TDP-43 foci in each of the human brain cohorts (n = 8 replicates per tissue sample; n = 3 samples per cohort). The centerline denotes the median, and the error bands denote the range of data values. Statistics were calculated using a two-tailed Welch’s t test. f, Quantification of phospho-eIF2a expression relative to total eIF2α signal (Extended Data Fig. 10b, blot). The centerline denotes the median, and the error bands denote the range of data values. Statistics were calculated using a two-tailed Welch’s t test. g, Fraction of G3BP1-bound RNA windows detected by eCLIP (n = 2 replicates for cell samples, which are replotted from Fig. 3; n = 3 samples per brain cohort, which are treated as replicates for this experiment) within each of the indicated transcript elements. y/o, year old.
Fig. 7
Fig. 7. Schematic representation of dysregulated RNA biology in aging neurons.
Chronic activation of the stress response in aged neurons leads to physical demixing between stress granules and other RBPs, which functionally impacts splicing in aged neurons and decreases resiliency to acute stress.
Extended Data Fig. 1
Extended Data Fig. 1. Transdifferentiation results in functionally mature neurons.
a, Confocal fluorescence images of isogenic transdifferentiated neurons (Tdiff.1), iPSC-derived neurons (iPSC-diff.1) and fibroblasts (fibroblast.1) stained for tubulin-β3 (Tubβ3). Scale bar = 10 μm. b, Confocal fluorescence images of transdifferentiated neuronal lines (Tdiff.2–4) stained for Tubβ3. Scale bar = 10 μm. c, Quantification of the fraction of Map2+ and Tubβ3+ neurons (n = 5 replicates) in the iPSC-diff.1 (green) or Tdiff.1 (blue) lines. The box plot represents the 25th to 75th percentile of data values, the centerline is the median and the error bars denote the range of all values. Statistics were calculated using a two-tailed Welch’s. d, Confocal Immunofluorescence images of co-stained Map2 and Tubβ3 in Tdiff.1 neurons. Scale bar = 10 μm. e, Same as d, but for Map2 and NeuN/RBFOX3. f, Same as d, but for Map2 and synaptophysin (SYP). g, Airyscan immunofluorescence images of co-stained Map2 and synaptophysin in the neurites of Tdiff.1 neurons. Yellow scale bar = 2 μm. h, Confocal immunofluorescence images of co-stained DAPI (blue), Map2 (green), PSD95 (cyan) and synaptophysin (magenta) in Tdiff.1 neurons. The cyan arrow indicates the postsynaptic neuron, whereas the magenta arrow indicates the presynaptic neuron. Scale bar = 10 μm. i, Quantification of the average firing rate detected by MEA for Tdiff.1 neurons (n = 5 replicates) with and without bicuculline treatment before and after washout. The box plot represents the 25th to 75th percentile of data values, the centerline is the median and the error bars denote the range of all values. Statistics were calculated using a two-tailed Welch’s t test. j, Example of action potential spikes in untreated Tdiff.1 neurons. k, Same as j, but for Tdiff.1 neurons treated with bicuculline. Dark blue bars represent ‘bursting’.
Extended Data Fig. 2
Extended Data Fig. 2. RNA metabolism pathways are highly depleted from transdifferentiated neurons.
a, Heatmap of log10(mass spectrometry intensity) of all detected proteins from the gene ontology term fibroblast proliferation (GO:0048144) in the indicated cell types (n = 2 replicates). Well-known fibroblast markers were also manually added (indicated with an asterisk next to the protein name). b, Same as a, but for neuronal markers. SN, serotonergic neurons; OP, oligodendrocyte precursor; IP, intermediate progenitor; Glut. neurons, glutamatergic neurons; Dop. neurons, dopaminergic neurons; CN, cholinergic neurons. c, Distribution of the log2(proteomics fold change) of all detected non-RBPs (navy blue) and RBPs (orange; n = 3 replicates). The line within the box plot represents the median for the indicated population, and the box bounds represent the 25th to 75th percentile of data. d, Same as c, but for the RNA-seq data (n = 3 replicates). e, Volcano plot of RNA-seq data (n = 3 replicates) from Fig. 1h but with predicted RBPs highlighted in orange. P values were calculated using a two-tailed Welch’s t test. f, Plot of the running enrichment score of the top GSEA terms for the proteomics data. g, Plot of the running enrichment score of the top GSEA terms for the proteins with high expression but normal transcript levels (the pink region in Fig. 1h). h, Scatter plot of proteomics versus RNA-seq enrichment as in Fig. 1k (n = 3 replicates) but with only predicted RBPs plotted in orange.
Extended Data Fig. 3
Extended Data Fig. 3. TDP-43 does not interact with stress granule proteins in transdifferentiated neurons.
ac, Confocal fluorescence images of the splicing proteins in the indicated cell types. Scale bar = 10 μm. d, Left, confocal fluorescence images of the indicated splicing proteins in the Tdiff.Y1 neuron line; Scale bar = 10 μm. Right, quantification of the nuclear fraction (n = 3 replicates) of TdiffY.1 versus Tdiff.1 (reproduced from Fig. 2a) for the indicated spliceosome protein. The box plot represents the 25th to 75th percentile of all values, the centerline denotes the median and the error bars represent the range of all values. Statistics were calculated using a two-tailed Welch’s t test. e, Airyscan fluorescence images of TDP-43 in transdifferentiated neurons. White scale bar = 10 μm; yellow scale bar = 2 μm. f, Airyscan fluorescence images of TDP-43 and G3BP1 in iPSC-derived neurons treated with arsenite for 1 h. White scale bar = 10 μm; yellow scale bar = 2 μm. g, Scatter plot of TDP-43 pulldown fold change plotted with the proteomic fold change for each detected protein (n = 2 replicates). P values were detected using a two-tailed Welch’s t test. h, Volcano plot of all detected proteins identified by TDP-43 pulldown and mass spectroscopy for Tdiff.1 neurons versus iPSC-diff.1 neurons (n = 2 replicates) treated with sodium arsenite for 1 h. P values were calculated using a two-tailed Welch’s t test. Detected proteins were highlighted as in g. i, Same as h, but for unstressed and stressed iPSC-diff.1 neurons. j, Scatter plot of the TDP-43 pulldown fold change for spliceosome (dark blue) and stress granule (orange) proteins in Tdiff.1 neurons compared to unstressed and stressed iPSC-diff.1 neurons (n = 2 replicates). k, Venn diagram of which stress granule proteins were detected in any replicate of the indicated neuron TDP-43 pulldown (n = 2 replicates). l, Raw mass spectrometry values of two core stress granules (G3BP2 and CAPRIN1) detected by TDP-43 pulldown.
Extended Data Fig. 4
Extended Data Fig. 4. TDP-43 nuclear depletion causes alternative exon inclusion and exclusion.
a, TDP-43 eCLIP binding intensities at the reported STMN2 cryptic exon site in iPSC-diff.1 (green) and Tdiff.1 (blue) neurons from representative genomic tracks. b, Same as a, but for the UNC13A cryptic exon site. c, Area under the curve of TDP-43 binding intensity at the cryptic exons for STMN2 and UNC13A in transdifferentiated (blue) and iPSC-derived (green) neurons (n = 2 replicates). The centerline depicts the median and the error bars denote the range of all values (n = 2 eCLIP replicates). d, Same as c, but for RNA-seq. ND, not detected. e, List of alternatively spliced genes at TDP-43 binding windows falling within the gene ontology set for neuronal development (GO:0048666). f, Fraction of alternatively spliced genes that are neuronal relative to the total alternatively spliced TDP-43 genes. The total number of neuronal genes (GO:0048666) is plotted relative to the total number of protein-coding genes for reference. g, TDP-43 eCLIP binding intensities and RNA-seq read density tracks at the DNM1 gene for iPSC-derived (green) and transdifferentiated (blue) neurons. h, Same as g, but for the MAPT gene.
Extended Data Fig. 5
Extended Data Fig. 5. TDP-43 mislocalization is aging-dependent in mice.
a, Confocal fluorescence images of TDP-43 (magenta), Map2 (green) and DAPI (blue) in 1.5-, 6- and 24-month-old mouse motor cortices. The inset region is denoted by the yellow dashed box. White scale bar = 10 μm; yellow scale bar = 2 μm. b, Quantification of the proportion of cells with cytoplasmic TDP-43 foci in Map2+ neurons from the images in a (n = 8 replicates from N = 2 mice per cohort). The box plot represents the 25th to 75th percentile of data values, and the centerline is the median. The error bars denote the range of all individual values. Statistics were calculated using a two-tailed Welch’s t test. c, Z-maximum projection of a tiled confocal fluorescence image of the 24-month-old brain stained for TDP-43 (green). Red scale bar = 1 mm. d, Z-maximum projection of confocal fluorescence image of TDP-43 (green) and DAPI (blue) in the hippocampus of 6- and 24-month-old mouse brains. White scale bar = 10 μm; yellow scale bar = 2 μm. e, Confocal fluorescence images of the indicated splicing proteins in the motor cortex of 24-month-old mouse brain slices. Scale bar = 10 μm. f, The top RNA-binding motifs for TDP-43 eCLIP in the 6- and 24-month-old mouse brain (n = 2 replicates). For 24-month-old mice, the top (‘1’) and 5th most significant (‘5’) motifs are shown. g, TDP-43 eCLIP binding intensities from representative genomic tracks at the indicated cryptic exon sites in ADIPOR2 (left) and SYNJ2BP, both of which contain previously reported TDP-43 cryptic exons.
Extended Data Fig. 6
Extended Data Fig. 6. G3BP1 assembles into stress granules in aged neurons.
a, Volcano plot of G3BP1 pulldown and mass spectrometry of all detected proteins in unstressed versus stressed iPSC-diff.1 neurons (n = 2 replicates). P values were calculated using a two-tailed Welch’s t test. b, Scatter plot of G3BP1 pulldown fold change plotted with the proteomic fold change for each detected protein (n = 2 replicates). c, Scatter plot of TDP-43 pulldown fold change versus G3BP1 pulldown fold change for all proteins falling within the spliceosome KEGG term (hsa03040). d, Quantification of the number of stress granules per cell in the indicated isogenic cell types (n = 6 replicates). The box plots represent the 25th to 75th percentile, the centerline denotes the median and the error bars denote the range of all data values. Statistics were calculated using a two-tailed Welch’s t test. e, G3BP1 and DAPI staining of various transdifferentiated neuron lines visualized by fluorescence confocal microscopy. The yellow box denotes the inset. White scale bar = 10 μm; yellow scale bar = 2 μm. f, Same as d, but for the additional Tdiff lines from e. Tdiff.1 was replotted from d. Statistics were calculated pairwise with the Tdiff.Y1 line using a two-tailed Welch’s t test. g, Fluorescence confocal images of primary fibroblasts stained for stress granule markers. White scale bar = 10 μm. h, Quantification of the average stress granule area, circularity and roundness in stressed Tdiff.1 (Fig. 2c/ED6I) versus iPSC-diff.1 neurons (Extended Data Fig. 3f) plotted as in ED6D (n > 100 stress granules in N = 5 replicates). Statistics were calculated using a two-tailed Welch’s t test. i, Confocal fluorescence images of unstressed and arsenite-stressed transdifferentiated neurons stained for G3BP1 (green) and poly(A) (magenta) via a dT FISH probe. Yellow boxes denote the inset region. White scale bar = 10 μm; yellow scale bar = 2 μm.
Extended Data Fig. 7
Extended Data Fig. 7. G3BP1 and Caprin1 binding do not impact translation efficiency.
a, eCLIP binding motif of Caprin1 (n = 2 replicates). b, Same as a, but for G3BP1. c, Most significant gene ontology terms for Caprin1-bound transcripts detected by eCLIP. d, Same as c, but for G3BP1. e, Plot of the running enrichment score of the top KEGG terms for upregulated translation efficiency in Tdiff.1 neurons. f, Distribution of the log2(translation efficiency fold change) of all 3′ UTRs (gray) and G3BP1-bound 3′ UTRs (orange) in Tdiff.1 vs. iPSC-diff.1 neurons. The line within the box plot represents the median for the indicated population. g, Same as f, but for Caprin1-bound 3′ UTRs.
Extended Data Fig. 8
Extended Data Fig. 8. Cytoplasmic ubiquitylation is increased in transdifferentiated neurons.
a, Scatter plot of TDP-43 pulldown fold change versus G3BP1 pulldown fold change for all detected HSP90 chaperones (n = 2 replicates). b, Raw mass spectrometry intensity of two proteins required for stress granule dissolution (VCP and FAF2) detected by G3BP1 pulldown (n = 2 replicates). The centerline denotes the median. ND, not detected. c, Confocal fluorescence images of ubiquitin in transdifferentiated iPSC-derived neurons. The yellow box denotes the inset. White scale bar = 10 μm; yellow scale bar = 2 μm. d, Raw mass spectrometry intensity of TDP-43 detected by HSP90α pulldown (n = 2 replicates). The centerline denotes the median. ND, not detected. e, Volcano plot of HSP90α pulldown and mass spectrometry of all detected proteins in transdifferentiated versus unstressed iPSC-derived neurons (n = 2 replicates). Detected proteins included in the following KEGG terms were highlighted—spliceosome (dark blue, hsa03040); stress granules (orange, hsa03019 + 10146); HSP90 chaperones (light blue, no KEGG pathway); RNA transport (green, hsa03013); ribosome (red, hsa03008); oxidative phosphorylation (pink, hsa00190). f, Scatter plot of HSP90α pulldown fold change plotted with the proteomic fold change for each detected protein (n = 2 replicates). Proteins were highlighted as described in e.
Extended Data Fig. 9
Extended Data Fig. 9. Aged neurons fail to activate heat shock proteins in response to arsenite stress.
a, Confocal fluorescence images of G3BP1 (green) and DAPI (blue) in fibroblasts (fibroblast.1) treated with arsenite for 1 h and allowed to recover for the indicated amount of time. Scale bar, 10 μm. b, Confocal fluorescence images of G3BP1 (green) and DAPI (blue) in Tdiff.1 neurons treated with thapsigargin for 1 h and allowed to recover for the indicated time points. Scale bar, 10 μm. c, Volcano plot of RNA-seq differential expression in unstressed iPSC-derived neurons compared to iPSC-derived neurons treated with arsenite for 1 h and recovered for 24 h (n = 3 replicates). P values were calculated using a Wald test. The indicated heat shock proteins are highlighted in light blue; points with high clustering are green/yellow. d, Same as c, but for transdifferentiated neurons (n = 3 replicates). e, Scatter plot of RNA-seq fold change of all heat shock protein transcripts for unstressed vs. recovered iPSC-derived and transdifferentiated neurons (n = 3 replicates). f, Representative genomic tracks of RNA-seq (top three tracks) and eCLIP (bottom track, reproduced from Extended Data Fig. 4a) at the STMN2 cryptic exon locus before stress (pre-stress), immediately after stress (0 h recovery) and after stress (24 h recovery) in Tdiff.1 neurons.
Extended Data Fig. 10
Extended Data Fig. 10. The aging human brain has cytoplasmic TDP-43 foci.
a, Confocal immunofluorescence images of frontal cortex tissue from aged cohorts of human brains. Green is Map2, magenta is TDP-43 and blue is DAPI. White scale bar = 10 μm. The TDP-43 images are reproduced from Fig. 6d. b, Western blot of eIF2α and phospho-eIF2α in aged human brain samples (N = 3 samples per cohort). Quantification is provided in Fig. 6f. c, Upset plot of shared 3′ UTR binding sites (enrichment score >3) among the indicated G3BP1 eCLIP samples. UTRs were grouped by genes. The orange bar indicates the 3′ UTRs that were detected in all stressed samples, gray bars are other combinations of 3′UTRs detected in multiple genes and white bars denote 3′UTRs that were detected in only one sample. d, Representative genomic tracks of G3BP1 binding to the MAPT 3′ UTR in cultured neurons (top three tracks, original data in Fig. 3) and brain tissue (bottom two tracks, original data in Fig. 6). The exons and 3′UTR are indicated on the gene. Source data

References

    1. Atella, V. et al. Trends in age-related disease burden and healthcare utilization. Aging Cell18, e12861 (2019). - PMC - PubMed
    1. Chang, A. Y., Skirbekk, V. F., Tyrovolas, S., Kassebaum, N. J. & Dieleman, J. L. Measuring population ageing: an analysis of the Global Burden of Disease Study 2017. Lancet Public Health4, e159–e167 (2019). - PMC - PubMed
    1. Hou, Y. et al. Ageing as a risk factor for neurodegenerative disease. Nat. Rev. Neurol.15, 565–581 (2019). - PubMed
    1. Erkkinen, M. G., Kim, M. O. & Geschwind, M. D. Clinical neurology and epidemiology of the major neurodegenerative diseases. Cold Spring Harb. Perspect. Biol.10, a033118 (2018). - PMC - PubMed
    1. Hewitt, G. et al. Telomeres are favoured targets of a persistent DNA damage response in ageing and stress-induced senescence. Nat. Commun.3, 708 (2012). - PMC - PubMed