. 2025 Jul;26(7):1074-1086.
doi: 10.1038/s41590-025-02172-0. Epub 2025 Jun 2.

PD-1 receptor deficiency enhances CD30+ Treg cell function in melanoma

Affiliations

PD-1 receptor deficiency enhances CD30+ Treg cell function in melanoma

Jing Xuan Lim et al. Nat Immunol. 2025 Jul.

Abstract

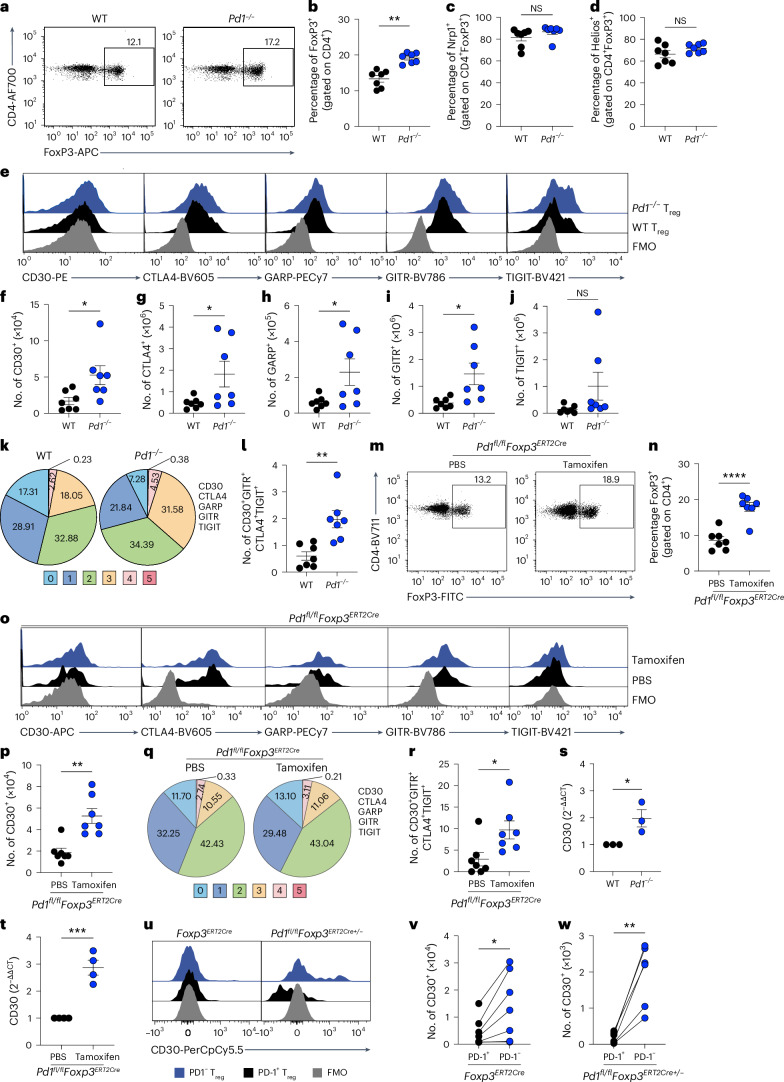
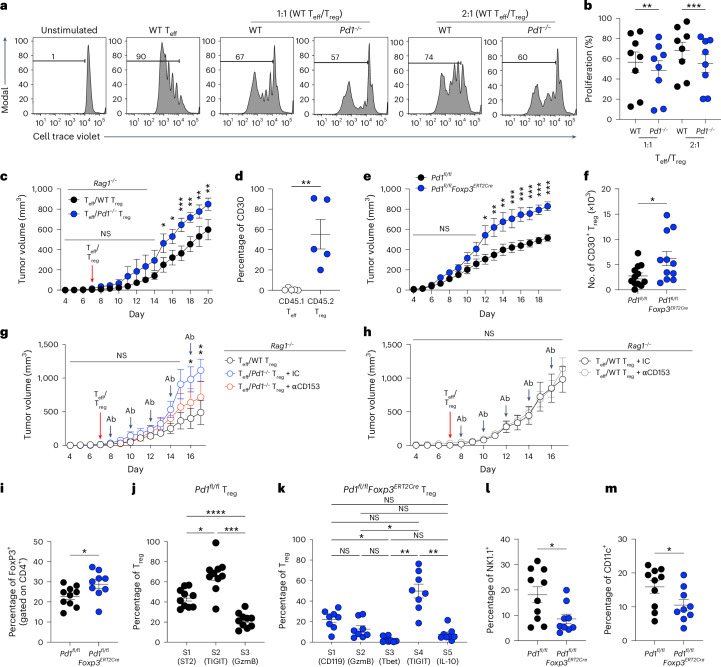
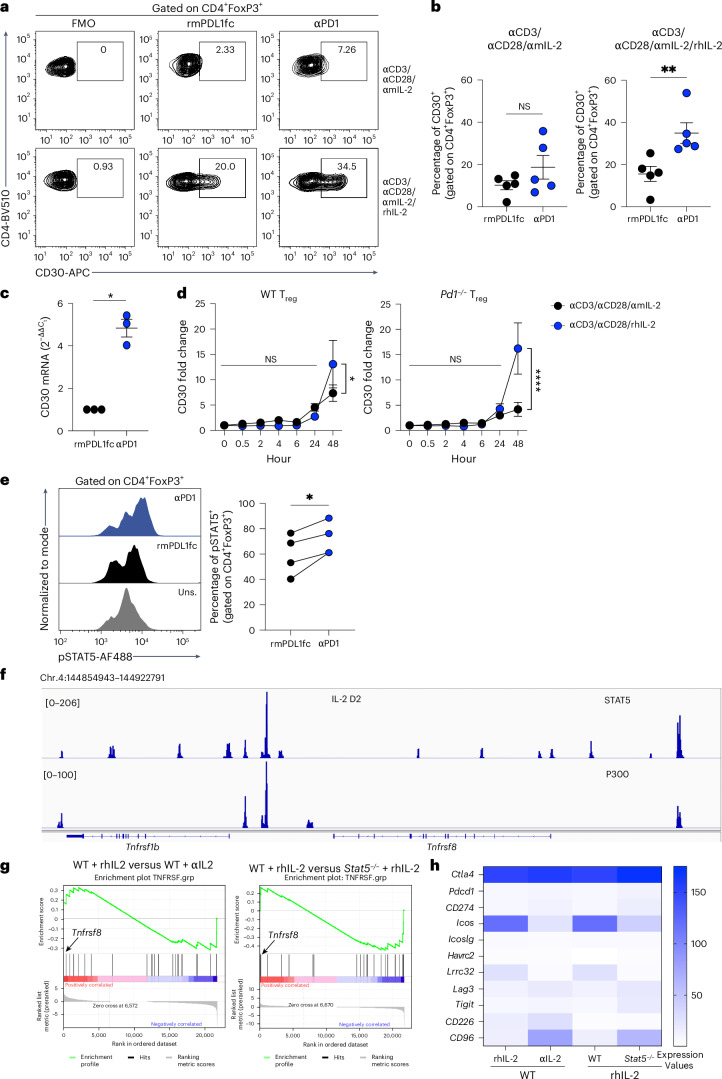
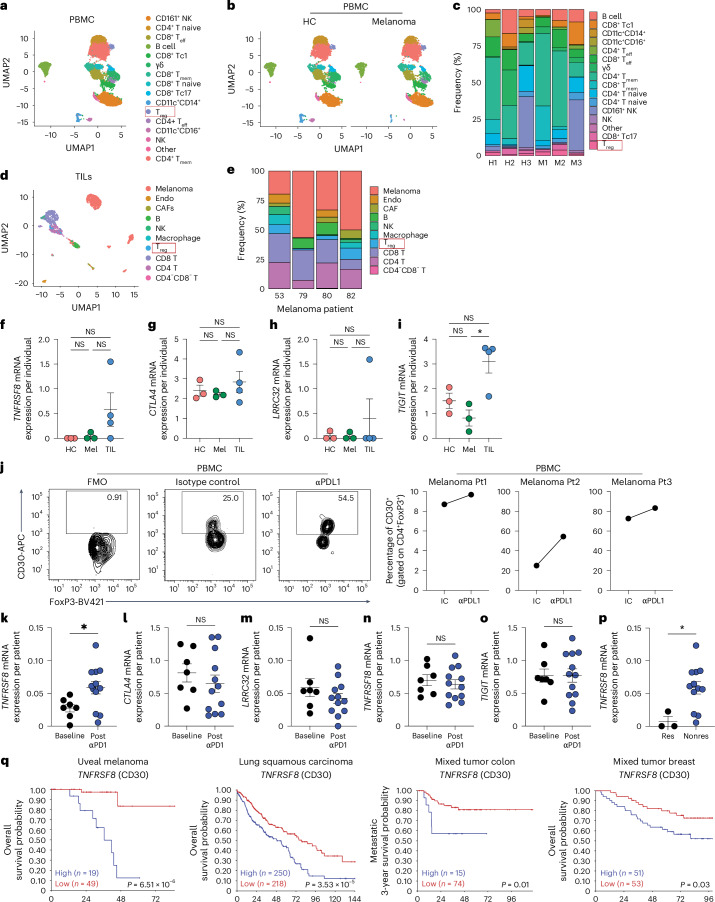
Regulatory T (Treg) cells are vital for immune suppression. The role of the coreceptor programmed cell death 1 receptor (PD-1) in Treg cell function is controversial. Here, we demonstrate that PD-1 deficiency enhances the function of Treg cells through expression of a compensatory network of coinhibitory receptors. CD30 has a central role within this network, driving the Treg cell suppressive function within the tumor microenvironment. Mechanistically, PD-1 deficiency enhances STAT5 signaling in Treg cells, which induces CD30 expression. These data indicate a role for PD-1 as a checkpoint that negatively controls CD30 expression in Treg cells to limit their suppressive function. Understanding the functional changes that PD-1 has on Treg cells might enable combination therapies with better treatment outcomes in cancer.


Conflict of interest statement

Competing interests: The authors declare no competing interests.

Figures

Fig. 1
Fig. 1. PD-1 deficiency in Treg cells upregulates coinhibitory receptors including CD30.
aj, Foxp3RFP (WT) and Pd1−/−Foxp3RFP (Pd1−/−) spleens were immunophenotyped using flow cytometry (n = 7 per group): flow cytometry profiles (a) and summaries of FoxP3 expression (b) in WT and Pd1−/− mice; frequencies of neuropilin 1 (Nrp1) (c) and Helios (d) expression in Treg cells; flow cytometry profiles of CD30, CTLA4, GARP, GITR and TIGIT expression in Treg cells (e); and absolute numbers of CD30 (f), CTLA4 (g), GARP (h), GITR (i) and TIGIT (j) in Treg cells are shown. k, Boolean analysis of expression of five different coinhibitory receptors in Treg cells. l, Linear analysis of CD30 network of coreceptors in Treg cells. mr, Spleens of Pd1fl/flFoxp3ERT2Cre mice that had undergone preadministration of 1 mg tamoxifen or PBS for 5 consecutive days via i.p. injection (n = 7 per group) were analyzed: representative flow cytometry analysis of FoxP3 expression (m); summary data of FoxP3 expression (n); a representative flow plot of CD30, CTLA4, GARP, GITR and TIGIT expression in Treg cells (o); absolute numbers of CD30 in Treg cells (p); Boolean analysis of expression of five different coinhibitory receptors in Treg cells (q); and absolute counts of the CD30 network of coreceptors (r) are shown. s,t, RT–qPCR analysis of Tnfrsf8 mRNA expression in Treg cells from Pd1−/−Foxp3RFP (n = 7) (s) and Pd1fl/flFoxp3ERT2Cre+/− (n = 6) (t) female mice treated with tamoxifen. u, Representative flow cytometry analysis of CD30 expression in CD4+FoxP3+CD44+PD-1+ and CD4+FoxP3+CD44+PD-1 T cells. v,w, Absolute numbers of CD30 in PD-1+ and PD-1 Treg cells from Foxp3ERT2Cre (v) and Pd1fl/flFoxp3ERT2Cre+/− (w) mice. Data are shown as mean ± s.e.m., with each data point representing an animal from an independent experiment, except in v and w, in which each pair of data points are from the same animal’s Treg cells with or without PD-1 expression and from independent experiments. Two-tailed unpaired Student’s t-tests were performed for the results shown in bd, fj, l, n, p and rt and two-tailed paired Student’s t-tests for those shown in v and w. *P < 0.05, **P < 0.01, ***P < 0.001, ****P < 0.0001. FMO, fluorescence minus one; NS, not significant.
Fig. 2
Fig. 2. scRNA-seq analysis identifies CD30 expression in Pd1−/− Treg cells in the TME.
WT and Pd1−/− mice TILs were harvested on day 14 and subjected to scRNA-seq. a, UMAP view of 1,810 enriched TILs color-coded by assigned cell type. b, WT and Pd1−/− TILs, decoupled to show similar clustering between the samples. c, UMAP view of CD4 and Foxp3 expression. d, Dot plot of candidate gene expression in immune clusters. e, Differential gene expression analysis of Pd1−/− Treg cells versus WT Treg cells. f, GO enrichment analysis identifying the functions of upregulated genes in Pd1−/− Treg cells. g, GSEA showing enhanced regulation of cytokine production of Pd1−/− Treg cells. NES, normalized enrichment score. h, mRNA expression of Tnfrsf8, Ctla4, Tnfrsf18 (GITR), Lrrc32 (GARP) and Tigit transcripts in WT and Pd1−/− Treg cells in individual animals. i, Average percentages of Treg cells expressing 0–5 Tnfrsf8 (CD30), Ctla4, Tnfrsf18 (GITR), Lrrc32 (GARP) and Tigit transcripts in WT and Pd1−/− Treg cells in the TME. j, Pseudotime trajectory analysis of WT (left) and Pd1−/− Treg (right) cells. k,l, Heatmap showing cell patterns and received signaling patterns of WT (k) and Pd1−/− (l) TILs. m, Chord diagram visualizing numbers of interactions between Treg cells and TILs in WT (top) and Pd1−/− (bottom) cohorts. The inner bar size is proportional to the signal strength received by the TILs from Treg cells. Statistical analyses were performed using two-tailed Wilcoxon rank-sum test with Bonferroni correction in e, Fisher’s exact test with FDR correction in f, two-tailed Kolmogorov–Smirnov test with FDR correction in g, and two-tailed unpaired Student’s t-test in h. Data are mean ± s.e.m. from n = 5 mice per cohort in h. ***P < 0.001. For the results shown in km, CellChat was used to model communication probabilities based on the law of mass action and identify significant communications using permutation tests. Padj., adjusted P value.
Fig. 3
Fig. 3. PD-1 deficiency enhances Treg cell function through CD30 within the TME.
a,b, Suppressive function of Treg cells from Foxp3RFP and Pd1−/−Foxp3RFP mice (n = 8 per group) as demonstrated by a representative CellTrace Violet flow plot (a) and percentages of Teff cell proliferation (b). c,d, For Rag1−/− mice with B16F10 melanoma cells and reconstituted with CD45.1+ T cells and CD45.2+ Treg cells from either WT or Pd1−/− mice, tumor volumes (n = 8 for WT and n = 6 for Pd1−/− groups) (c) and frequencies of CD30 expression on CD45.1+ Teff and CD45.2+ Pd1−/− Treg cells in TILs (n = 5) (d) are shown. e,f, For tamoxifen-treated Pd1fl/fl and Pd1fl/flFoxp3ERT2Cre mice with tumors, tumor volumes (n = 10 for Pd1fl/fl and n = 9 for Pd1fl/flFoxp3ERT2Cre) (e) and absolute counts of CD30+ Treg cells (n = 12 for Pd1fl/fl and n = 11 for Pd1fl/flFoxp3ERT2Cre) (f) are shown. g, Tumor-bearing Rag1−/− mice were reconstituted with different T cell populations (n = 3 for Teff plus WT Treg cell group and n = 7 for Teff plus Pd1/ Treg cell groups); in the Teff plus Pd1−/− Treg cohorts, mice were treated with either 0.1 mg anti-IgG2a (n = 5) or anti-CD153 (CD30L, n = 4), and tumors were measured. h, Tumor-bearing Rag1−/− mice were reconstituted with Teff plus WT Treg (treated with either 0.1 mg anti-IgG2a (n = 5) or anti-CD153 (n = 5)), and tumors were measured. Ab, antibody. im, Tamoxifen-treated and tumor-bearing Pd1fl/fl (n = 10) and Pd1fl/flFoxp3ERT2Cre (n = 8 or 9) mice were immunophenotyped on day 19: frequencies of FoxP3 (i); ST2, TIGIT and GzmB in Pd1fl/fl mice (j); IFNγR (CD119), GzmB, Tbet, TIGIT and IL-10 in Pd1fl/flFoxp3ERT2Cre mice (k); NK cells (l); and DCs (m) are shown. Data are presented as the mean ± s.e.m. Each data point represents an in vitro biological replicate in b or an individual animal in f, i, l and m. Data points in each group were matched to the same individual mouse in d, j and k. One-way analysis of variance (ANOVA) with Sidak’s multiple comparison was used in b; two-way ANOVA with Sidak’s multiple comparison in c, e, g and h, two-tailed paired Student’s t-test in d; two-tailed unpaired Student’s t-test in f, i, l and m; and matched one-way ANOVA with Sidak’s multiple comparison in j and k. Cumulative data from n = 3 independent experiments are shown. *P < 0.05, **P < 0.01, ***P < 0.001, ****P < 0.0001.
Fig. 4
Fig. 4. PD-1 regulates CD30 expression via IL-2–STAT5 signaling.
ac, WT Treg cells from C57BL/6 mice were stimulated with αCD3 and αCD28 and cultured with either anti-mouse IL-2 (αmIL-2) or αmIL-2 with recombinant human IL-2 (rhIL-2). Cells were either cultured in recombinant mouse PD-L1 Fc (rmPD-L1-Fc)-coated well plates or with αPD-1 to block the PD-1–PD-L1 interaction: a representative plot of CD30 expression (a), a summary of CD30 expression in five independent experiments (b) and CD30 mRNA expression in three independent experiments (c) are shown. d, Treg cells from C57BL/6 (WT) and Pd1−/− mice were stimulated with αCD3 and αCD28 and cultured with either αmIL-2 or rhIL-2. At the indicated time points, CD30 expression on Treg cells was plotted as the fold change in expression compared with the unstimulated condition (0 h). Data from seven independent experiments are shown. e, WT Treg cells were stimulated with αCD3, αCD28 and αIL-2 in a PD-L1 Fc-coated plate. αPD-1 was added to block the PD-1–PD-L1 interaction. After 48 h, cells were stimulated with IL-2 for 15 min, and phospho-STAT5 (pSTAT5) was measured; the results are shown on the left. A summary of pSTAT5 in CD30+ Treg cells is shown on the right. Uns., unstimulated. f, Representative ChIP–seq tracks and peaks detected by STAT5 (upper) and p300 (lower) at the Tnfrsf8 gene locus of naive WT CD4+ cells stimulated with αCD3, αCD28 and rhIL-2 for 3 days. g,h, Naive WT and Stat5−/− CD4+ cells were stimulated with αCD3, αCD28 in the presence of αIL-2 for 72 h, washed and restimulated with αCD3 along with either αIL-2 or rhIL-2 for 4 days: GSEA plots showing Tnfrsf family gene rankings in IL-2-treated WT CD4+ cells compared with αIL-2-treated WT CD4+ cells (left) and Stat5−/− CD4+ cells (right) (g); and heatmaps showing expression of coreceptors and ligands in WT and Stat5−/− CD4+ cells (h) are shown. Data are presented as the mean ± s.e.m.; each data point represents an independent experiment. Statistical analyses were performed using two-tailed paired Student’s t-tests (b, c and e) or two-way ANOVA with Sidak’s multiple comparison (d). *P < 0.05, **P < 0.01, ****P < 0.0001.
Fig. 5
Fig. 5. Spatial transcriptomics of Pd1−/− Treg cell communication programs in TME.
ag, Tumor-bearing Rag1−/− mice were reconstituted with different T cell subsets and then subjected to CosMx spatial transcriptomics: UMAPs of 9,231 cells derived from WT Teff/WT Treg cell and WT Teff/Pd1−/− Treg cell cohorts, color-coded by assigned cell type (left), and WT and Pd1−/− Treg cell cohorts decoupled (middle and right) (a); frequencies of all cells in the TME (b); immune cells subclusters and frequencies of immune cell subsets among WT and Pd1−/− Treg cells (c); a graphical representation of cell–cell interaction analysis (left) and numbers of cell–cell interactions of WT Treg cells (middle) and Pd1−/− Treg cells (right) (d); a graphical representation of SR and LR gene definition by manual annotation (left), and frequencies of LR and SR interactions of WT (middle) and Pd1−/− Treg cells (right) (e); and DC Il10 expression (f) and Gzmb expression in NK cells (g) according to clustered Wilcoxon rank-sum test are shown. h,i, Tamoxifen-treated, tumor-bearing Pd1fl/fl and Pd1fl/flFoxp3ERT2Cre mice were immunophenotyped on day 19: the frequencies of IL-10 expression in TIL DCs (n = 5 per group) (h) and GzmB expression in TIL NK cells (n = 10 for Pd1fl/fl and n = 9 for Pd1fl/flFoxp3ERT2Cre) (i) are shown. j, For mice as in ag, FOVs showing colocalization of different WT and Pd1−/− Treg cell states and their interactions within the TME. k,l, Tamoxifen-treated, tumor-bearing Pd1fl/flFoxp3ERT2Cre mice were immunophenotyped (n = 8): representative flow cytometry results (k) and a summary of CD30 expression in Treg cell subsets (l) are shown. Data represent individual cells in f and g. In h, i and l, data are from three independent experiments, and the mean ± s.e.m. is shown. In h and i, each data point represents an individual mouse. In l, data points are matched within animals. Two-tailed clustered Wilcoxon rank-sum test was used for f and g, two-tailed unpaired Student’s t-test for h and i, and one-way ANOVA with Sidak’s multiple comparison test for l. *P < 0.05, **P < 0.01. Illustrations in d and e created using BioRender.com. ILC, innate lymphoid cell.
Fig. 6
Fig. 6. Anti-PD-1 and not the melanoma TME enhances CD30 expression by human Treg cells.
ac, PBMCs from HC and stage IV melanoma patients (Mel) were subjected to scRNA-seq: a UMAP view of 11,634 cells, with all cells colored by cell type (a); HC and Mel PBMC UMAPs showing homogeneity of clusters between the two cohorts (b); and frequencies of each cluster within individual samples (c) are shown. H, healthy; M, melanoma. d,e, Publicly available TIL and tumor cell data were mined and analyzed: a UMAP view of 1603 cells, with all cells colored by cell type (d), and frequencies of each cluster in individual patients (e) are shown. Endo, endothelial. fi, mRNA expression of TNFRSF8 (f), CTLA4 (g), TIGIT (h) and LRRC32 (GARP) (i) in Treg cells from PBMCs of HC individuals (n = 3) and Mel patients (n = 3), and Treg cells from TILs (n = 4), where each data point represents an individual. j, HC and Mel PBMCs were cultured with isotype control (IC) or anti-PD-L1 antibody (αPD-L1): a representative flow plot of CD30 expression in Treg cells (left) and a summary of CD30 expression in Treg cells (right) are shown. Pt, patient. ko, mRNA expression of TNFRSF8 (k), CTLA4 (l), GARP (m), TNFRSF18 (n) and TIGIT (o) in Treg cells from individual patients at baseline and after anti-PD-1 treatment. p, TNFRSF8 mRNA expression in Treg cells in each patient identified as a responder (Res) or nonresponder (Nonres) to anti-PD-1 immunotherapy. q, Kaplan–Meier analysis of overall survival of patients diagnosed with different cancers corresponding to CD30 expression, with P values indicated. Data are presented as the mean ± s.e.m., with each data point representing an individual from at least three independent experiments in fi and kp. Statistical analysis was performed using one-way ANOVA with multiple Sidak’s comparison (fi) or two-tailed unpaired Student’s t-test (kp). *P < 0.05. The survival curve statistical analysis for q was performed using a two-tailed log-rank test with the R2 Genomics Analysis and Visualization Platform.

References

    1. Abbas, A. K. et al. Regulatory T cells: recommendations to simplify the nomenclature. Nat. Immunol.14, 307–308 (2013). - PubMed
    1. Amarnath, S. et al. Regulatory T cells and human myeloid dendritic cells promote tolerance via programmed death ligand-1. PLoS Biol.8, e1000302 (2010). - PMC - PubMed
    1. Francisco, L. M. et al. PD-L1 regulates the development, maintenance, and function of induced regulatory T cells. J. Exp. Med.206, 3015–3029 (2009). - PMC - PubMed
    1. Amarnath, S. et al. The PDL1-PD1 axis converts human TH1 cells into regulatory T cells. Sci. Transl. Med.3, 111ra120 (2011). - PMC - PubMed
    1. Keir, M. E., Butte, M. J., Freeman, G. J. & Sharpe, A. H. PD-1 and its ligands in tolerance and immunity. Annu Rev. Immunol.26, 677–704 (2008). - PMC - PubMed

MeSH terms