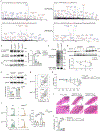
. 2025 Jun;26(6):866-880.
doi: 10.1038/s41590-025-02166-y. Epub 2025 Jun 2.

Succinate drives gut inflammation by promoting FOXP3 degradation through a molecular switch

Affiliations

Succinate drives gut inflammation by promoting FOXP3 degradation through a molecular switch

Hai Wang et al. Nat Immunol. 2025 Jun.

Abstract

Succinate levels are increased in inflammatory bowel disease (IBD), but its role in disease pathogenicity remains unknown. Here we showed that succinate promoted colitis in mice by reducing the expression of FOXP3 and increasing the expression of interleukin-17 in regulatory T (Treg) cells. Succinate selectively reduced the expression of 2-oxoglutarate dehydrogenase complex (OGDHc), the enzyme for succinyl-CoA synthesis, which in turn reduced FOXP3 succinylation and made FOXP3 lysine residues available for ubiquitination and FOXP3 protein degradation. Genetic deletion of Dlst, a member of OGDHc, in Treg cells led to reduced expression of FOXP3, impaired Treg cells function and severe gut inflammation. Restoring FOXP3 expression fully rescued the immune suppressive functions of Dlst-deficient Treg cells. In individuals with IBD, FOXP3 and OGDHc levels were reduced in Treg cells and negatively correlated with succinate levels and inflammation severity. This study identifies succinate as a pathogenic factor in IBD, uncovering a succinate-driven molecular switch that regulates FOXP3 stability and Treg cells function during inflammation.


Conflict of interest statement

Competing interests: The authors declare no competing interests.

Figures

Extended Data Fig.1|
Extended Data Fig.1|. Analysis of succinate on DSS-induced colitis.
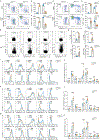
a, The absolute number of CD45+ immune cells in the colon at day 7 in C57BL/6J mice treated with 2.5% DSS (hereafter 2.5% DSS, n = 8) or 3% DSS (3% DSS, n = 5) in drinking water for 7 days, or with 3% succinate in drinking water for 3 days before treatment with 2.5% DSS and 3% succinate for 7 days (2.5% DSS+3% succinate, n = 8) or none of the above (control, n = 4). b, Representative flow cytometry of CD4+ and CD8+ T cells in CD45+ cells in the inflamed colon at day 7 in mice as in a. c, The percentage and absolute numberof CD4+CD45+ T cells in the inflamed colon at day 7 in mice as in a. d, The percentage and absolute numberof CD8+CD45+ T cells in the inflamed colon at day 7 in mice as in a. e-f, Representative flow cytometry (e) of and absolute number (f) of CD45+CD4+FoxP3 conventional T cells in the inflamed colon at day 7 in mice as in a. Data are shown as means ± s.d., and analyzed by one-way ANOVA with Tukey’s post-hoc test. Numbers in the bars represent exact P values. Data are representative of two independent experiments.
Extended Data Fig.2|
Extended Data Fig.2|. Analysis of ROR-γt, IL-2, IL-4, and IFN-γ expression in iTreg cells by succinic acid treatment.
a, Representative flow cytometry of the percentage of IL-17+FoxP3+ iTreg cells in C57BL/6J murine splenic CD4+ T cells cultured under iTreg cell polarizing conditions (IL-2+TGF-β) in the presence of 0 mM (control), 1.0 mM, or 5.0 mM SA for 5 days. b-c, Representative flow cytometry (b) and quantification (c) of the percentage of ROR-γt+FoxP3+ iTreg cells in CD4+T cells as in a. d-e, Representative flow cytometry (d) and quantification (e) of the percentage of IL-2+FoxP3+ iTreg cells in CD4+T cells as in a. f-g, Representative flow cytometry (f) and quantification (g) of the percentage of IL-4+FoxP3+ iTreg cells in CD4+T cells as in a. h-i, Representative flow cytometry (h) and quantification (i) of the percentage of IFN-γ+FoxP3+ iTreg cells in CD4+T cells as in a. j-k, Representative flow cytometry (j) and quantification (k) of the percentage of CD25+FoxP3+ iTreg cells and FoxP3 mean fluorescent intensity (MFI) in C57BL/6J murine splenic CD4+ T cells cultured under iTreg cells polarizing conditions (IL-2+TGF-β) in the presence of 0 mM (control), 0.1 mM, 0.25 mM, 0.5 mM, 1.0 mM, or 5.0 mM succinic acid (SA) for 5 days. l-m, Representative flow cytometry (l) and quantification (m) of FoxP3 MFI CD25+FoxP3+ iTreg cells in C57BL/6J murine splenic CD4+ T cells cultured under iTreg cells polarizing conditions (IL-2+TGF-β) in the presence of SA (0.1 mM) or IFN-γ (50 ng/mL) or both for 5 days. Data are shown as means ± s.d., and analyzed by one-way ANOVA with Tukey’s post-hoc test. Numbers in the bars represent exact P values. Data are representative of at least three independent experiments.
Extended Data Fig.3|
Extended Data Fig.3|. Analysis of the GPR91 signaling and HIF-1α activation on succinate-mediated FoxP3 downregulation.
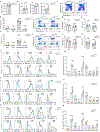
a-b, Immunoblot (a) and quantification (b) of FoxP3 protein levels in human Treg-like MT-2 cells cultured with succinic acid (SA, 5 mM) or the SUCNR1-specific antagonist NF-56-EJ40 (1 μM) or both, for 2 days. c-d, Representative flow cytometry (c) and quantification (d) of the percentage of CD25+FoxP3+ iTreg cells in human naïve CD4+ T cells cultured under iTreg cells polarizing conditions (IL-2+TGF-β) in the presence of SA (1 mM) and/or NF-56-EJ40 (1 μM) for 5 days. e-f, Representative flow cytometry (e) and quantification (f) of the percentage of CD25+FoxP3+ iTreg cells in C57BL/6J murine splenic CD4+ T cells cultured under iTreg cells polarizing conditions (IL-2+TGF-β) in the presence of in the presence of SA (1 mM) and/or Bay 87–2243 (20 nM), a HIF-1α inhibitor, for 5 days. g, RT-PCR expression of Suclg1, Suclg2, and Sucla2 in splenic C57BL/6J murine CD4+ T cells cultivated under TH0 (IL-2), TH1 (IL-2+IL-12), TH2 (IL-2+IL-4), TH17 (IL-6+TGF-β) and iTreg cells (IL-2+TGF-β) polarization conditions for 3 days. Data are shown as means ± s.d., and analyzed by one-way ANOVA with Tukey’s post-hoc test (b,d,f) or unpaired 2-tailed Student’s t test (g). Numbers in the bars represent exact P values. Data are representative of at least three independent experiments.
Extended Data Fig.4|
Extended Data Fig.4|. Immune profiling in DlstTreg-WT and DlstTreg-KO mice.
a-b, Representative images of H&E staining (a) and histopathological scores (b) from the liver, lung, and kidney of 3-week-old DlstTreg-WT and DlstTreg-KO mice. n = 5, per group. Scale bar, 100 μm. c-e, Representative flow cytometry (c) and quantification of the percentage (d) and absolute numbers (e) of CD4+CD8, CD4CD8+, CD4+CD8+, and CD4CD8T cells in the thymus from 3-week-old DlstTreg-WT and DlstTreg-KO mice. n = 7, per group. f-h, Representative flow cytometry (f) and quantification of the percentage (g) and absolute numbers (h) of CD4+CD8 and CD4CD8+ T cells in the spleen from 3-week-old DlstTreg-WT and DlstTreg-KO mice. n = 7, per group. i-k, Representative flow cytometry (i) and quantification of the percentage (j) and absolute numbers (k) of CD4+CD8 and CD4CD8+ T cells in the lymph nodes from 3-week-old DlstTreg-WT and DlstTreg-KO mice. n = 7, per group. Data are shown as means ± s.d. (d,e,g,h,j,k) or sem (b), and analyzed by unpaired 2-tailed Student’s t test. Numbers in the bars represent exact P values.
Extended Data Fig.5|
Extended Data Fig.5|. Immune profiling in DlstTreg-WT and DlstTreg-KO mice.
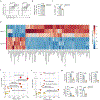
a-c, Representative flow cytometry (a) and quantification of the percentage of CD62LhiCD44low naïve and CD62LlowCD44hi effector CD4+ T cells in the spleen (b) and lymph node (c) from 3-week-old DlstTreg-WT and DlstTreg-KO mice. n = 7, per group. d-f, Representative flow cytometry (d) and quantification of the percentage of CD62LhiCD44low naïve and CD62LlowCD44hi effector CD8+ T cells in the spleen (e) and lymph nodes (f) from 3-week-old DlstTreg-WT and DlstTreg-KO mice. n = 7, per group. g-h, Representative flow cytometry (g) and quantification (h) of the percentage of IL-2+CD4+FoxP3, IL-4+CD4+FoxP3, IL-17+CD4+FoxP3, and IFN-γ+CD4+FoxP3 T cells in the spleen from 3-week-old DlstTreg-WT and DlstTreg-KO mice. n = 6, per group. i-n, Histogram and quantification of specified cell surface proteins in CD4+CD25+FoxP3+ Treg cells in the thymus (i,j), spleen (k,l), and lymph node (m,n) from 3-week-old DlstTreg-WT and DlstTreg-KO mice. n = 6, per group. Numbers in quadrants indicate the value of mean fluorescent intensity (MFI) (i,k,m). Data are shown as means ± s.d. (b,c,e,f,h) or sem (j,l,n), and analyzed by unpaired 2-tailed Student’s t test.
Extended Data Fig.6|
Extended Data Fig.6|. Immune profiling in DlstTreg-iWT and DlstTreg-iKO mice.
6–9-week-old DlstTreg-iWT and DlstTreg-iKO mice were treated with tamoxifen for 6 days, and sacrificed at day 8. a, Spleen weight in DlstTreg-iWT and DlstTreg-iKO mice. n = 5, per group. b, Total cellularity of thymus, spleen, and lymph node in DlstTreg-iWT and DlstTreg-iKO mice. n = 5, per group. c-e, Representative flow cytometry (c) and quantification of the percentage (d) and absolute numbers (e) of CD4+CD8, CD4CD8+, CD4+CD8+, and CD4CD8T cells in the thymus of DlstTreg-iWT and DlstTreg-iKO mice. n = 5, per group. f-h, Representative flow cytometry (f) and quantification of the percentage (g) and absolute numbers (h) of CD4+CD8, CD4CD8+ T cells in the spleen of DlstTreg-iWT and DlstTreg-iKO mice. n = 5, per group. i-k, Representative flow cytometry (i) and quantification of the percentage (j) and absolute numbers (k) of CD4+CD8, CD4CD8+ T cells in the lymph node of DlstTreg-iWT and DlstTreg-iKO mice. n = 5, per group. l-q, Histogram and quantification of specified cell surface proteins in CD4+CD25+FoxP3+ Treg cells in the thymus (l,m), spleen (n,o), and lymph node (p,q) from DlstTreg-iWT and DlstTreg-iKO mice. n = 5, per group. Numbers in quadrants indicate the value of mean fluorescent intensity (MFI). (l,n,p) Data are shown as means ± s.d. (a,b,c,d,e,g,h,j,k) or sem (m,o,q), and analyzed by unpaired 2-tailed Student’s t test.
Extended Data Fig.7|
Extended Data Fig.7|. Metabolite alterations in DLST-deficient Treg cells.
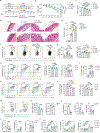
a-c, Representative flow cytometry (a) and the quantification of the percentage of CD25+FoxP3+ iTreg cells (b) and FoxP3 MFI in CD4+ T cells cultured under iTreg cells polarizing conditions (IL-2+TGF-β) in the presence of 4-hydroxytamoxifen (1 μM) for 5 days from the spleen of DlstTreg-iWT and DlstTreg-iKO mice. d-g, Heatmap showing the altered metabolites in iTreg cells polarized from DlstTreg-iWT and DlstTreg-iKO mice, quantified by LC–MS (d), the pathway enrichment for the upregulated (e) and downregulated (f) metabolites in iTreg cells polarized from DlstTreg-iKO mice, and TCA cycle-associated metabolites in iTreg cells polarized from DlstTreg-iWT and DlstTreg-iKO mice, quantified by LC–MS (g). Data are shown as means ± s.d., and analyzed by unpaired 2-tailed Student’s t test. Data are representative of three independent experiments.
Extended Data Fig.8|
Extended Data Fig.8|. Analysis of FoxP3 mRNA levels in iTregs and total protein succinylation in MT-2 cells.
a, RT-PCR expression of FoxP3 in splenic C57BL/6J mice CD4+ T cells cultured under iTreg cells polarizing conditions (IL-2+TGF-β) in the presence of 0 mM (control) or 1 mM succinic acid (SA) for 5 days. b, RT-PCR expression of FoxP3 in splenic DlstTreg-iWT and DlstTreg-iKO mice CD4+ T cells cultured under iTreg cells polarizing conditions (IL-2+TGF-β) in the presence of SA (1 mM) and 4-hydroxytamoxifen (1 μM) for 5 days. c, Immunoblot of FoxP3, DLST, succinyllysine, and GAPDH in the cell lysates of human Treg-like MT-2 cells after 24 hour-treatment with SA (5 mM) for 24 hours. d, Immunoblot of succinyllysine, FoxP3, and GAPDH in the cell lysates of MT-2 cells after 24 hour-treatment with 0 μM, 1 μM, or 5 μM succinyl-CoA. e, Immunoblot of succinyllysine, FoxP3, and GAPDH in the cell lysates of MT-2 cells after 24 hour-treatment with 0 μM, 1 μM, or 5 μM succinyl-CoA. Data are shown as means ± s.d., and analyzed by unpaired 2-tailed Student’s t test. Data are representative of at least two independent experiments.
Extended Data Fig. 9|
Extended Data Fig. 9|. Analysis of Succinyl-CoA effects on the suppressive functions of DlstTreg-iKO cells in vitro.
a-b, Histogram (a) and quantification (b) of the in vitro suppressive activity of iTreg cells polarized from splenic CD4+T cells of DlstTreg-iWT and DlstTreg-iKO mice assessed by the division of CD8+ T cells in the presence or absence of succinyl-CoA (5 μM). 1:1, 1:2, and 1:4 indicated the ratio of iTreg cells to CD8+T cells. See method for details. Splenic CD4+ T cells from DlstTreg-iWT and DlstTreg-iKO mice were cultivated under iTreg cells polarizing conditions (IL-2+TGF-β) in the presence of 4-hydroxytamoxifen (1 μM) for 5 days, and further treated with IL-2 (5 ng/mL), with/without inflammatory cytokines IFN-γ (100 ng/mL), IL-4 (10 ng/mL), IL-6 (50 ng/mL), and IL-12 (10 ng/mL) for another 3 days. c-d, Representative flow cytometry (c) and quantification of the MFI of FoxP3 (d) in CD4+CD25+FoxP3+ iTreg cells from DlstTreg-iWT and DlstTreg-iKO mice. e, The degradation rate of FoxP3 MFI in CD4+CD25+FoxP3+ iTreg cells in various inflammatory contexts, normalized to no treatment (control).Data are shown as means ± s.d., and analyzed by unpaired 2-tailed Student’s t test. Data are representative of three independent experiments.
Fig. 1.
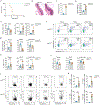
Fig. 1.. Succinate downregulates FOXP3 and OGDH expression in Treg cells.
a, Schematic of the experimental setup showing C57BL/6J mice were treated with 2 or not (control, n = 5) with 2.5% DSS (hereafter 2.5% DSS, n = 8) or 3% DSS (3% DSS, n = 7) for 7 days, or with 3% succinate for 3 days followed by 3% succinate + 2.5% DSS, both in drinking water, for 7 days (2.5% DSS + 3% succinate, n = 8). b-e, Body weight changes relative to starting weight (b), colon length (c), representative H&E staining in the colon (d) and histological score in the colon (e) in control mice, and mice treated with 2.5% DSS, 2.5% DSS + 3% succinate or 3% DSS, as in a. Scale bar, 100 μm. f,g, Representative flow cytometry (f) and quantification of the percentage of FOXP3+ cells and FOXP3 MFI (g) in CD4+FOXP3+ Treg cells from the colons of mice as in a. hj, Representative flow cytometry (h), frequency of CD25+FOXP3+ Treg cells and FOXP3 MFI (i) and quantification of IL-17+FOXP3+ cells (j) in C57BL/6J mouse splenic CD4+ T cells cultured in iTreg cell-polarizing condition (IL-2 + TGFβ) in the presence of 0 mM (control), 1.0 mM or 5.0 Mm succinic acid (SA) for 5 days. k,l, Representative flow cytometry (k) and quantification of the percentage of CD25+FOXP3+ Treg cells and FOXP3 MFI (l) in splenic iTreg cells as in hj in the presence of with 0 μM (control), 10 μM, 25 μM or 50 μM cell-permeable succinate (NV-118) for 5 days. m,n, Representative flow cytometry (m), quantification of the percentage of CD25+FOXP3+ Treg cells and FOXP3 MFI (n) in human CD4+CD25+FoOXP3+ iTreg cells derived from CD4+ TN cells isolated from peripheral blood and cultured with IL-2 + TGFβ in the presence or not (control) of 1 mM succinic acid for 5 days. o,p, RT–PCR expression of Ogdh, Dlst and Dld (o) and Suclg1, Suclg2 and Sucla2 (p) in mouse splenic iTreg cells polarized as in h,i in the presence or not (control) of 1 mM succinic acid for 3 days. q, RT–PCR expression of Ogdh, Dlst and Dld in C57BL/6J mouse spleen CD4+ T cells cultured under TH0 (IL-2), TH1 (IL-2 + IL-12), TH2 (IL-2 + IL-4), TH17 (IL-6 + TGFβ) and iTreg (IL-2 + TGFβ) cell polarization conditions for 3 days. Data are shown as mean ± s.d. and analyzed by two-way analysis of variance (ANOVA) (b), one-way ANOVA (c,e,g,i,j,l) with Tukey’s post hoc test or two-tailed unpaired Student’s t-test (nq). Numbers in the bars represent exact P values.
Fig. 2.
Fig. 2.. DLST is required for Treg cell restriction of lethal inflammation.
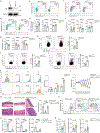
a, Survival of DlstTreg-WT and DlstTreg-KO mice (P < 0.0001 using one-sided log-rank test). b,c, Representative images of H&E staining (b) and histopathological scores (c) from the colon of DlstTreg-WT or DlstTreg-KO mice (n = 5 mice per group). Scale bars, 100 μm. d, Spleen weight in DlstTreg-WT or DlstTreg-KO mice (n = 7 mice per group). e, Total cell numbers in thymus, spleen and lymph nodes in DlstTreg-WT or DlstTreg-KO mice (n = 7 mice per group). fi, Representative flow cytometry showing percentage (upper numbers) and FOXP3 MFI (lower numbers) (f), frequency among CD4+ T cells (g), absolute numbers (h) and FOXP3 MFI (i) of CD4+CD25+FOXP3+ Treg cells in the thymus, spleen and lymph nodes of DlstTreg-WT or DlstTreg-KO mice (n = 7 mice per group). j,k, Representative flow cytometry (j) and quantification (k) of intracellular staining of IL-2, IL-4, IL-17 and IFNγ in splenic CD4+FOXP3+ Treg cells from DlstTreg-WT or DlstTreg-KO mice (n = 6 mice per group). Data are shown as mean ± s.d. and analyzed by two-tailed unpaired Student’s t-test.
Fig. 3.
Fig. 3.. DLST is required for the suppressive function of Treg cells.
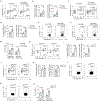
a, Immunoblot analysis of DLST protein in CD4+CD25+FOXP3-GFP+tdTomato+ Treg cells from the spleen of 6–9-week-old Dlstwt/wtFoxp3GFP-creERT2ROSA26SorCAG-tdTomato (DlstTreg-iWT) or Dlstfl/flFoxp3GFP-creERT2ROSA26SorCAG-tdTomato (DlstTreg-iKO) mice at day 8 post-initiation of tamoxifen treatment for 6 days. b-g, Flow cytometry analysis in the thymus (b), spleen (c) and lymph node (d), frequency among CD4+T cells (e), absolute cell numbers (f) and FOXP3 MFI (g) of CD4+CD25+FOXP3+ Treg cells in DlstTreg-iWT or DlstTreg-iKO mice (n = 5 mice per group). h,i, Intracellular staining and quantification of IL-2 (h) and IL-17 (i) in splenic CD4+CD25+FOXP3+ Treg cells in DlstTreg-iWT or DlstTreg-iKO mice (n = 4 mice per group). j, Intracellular staining and quantification of IL-17 in iTreg cells derived from splenic CD4+ T cells from DlstTreg-iWT or DlstTreg-iKO mice (n = 4). k, Histograms and quantification of the division of CTV+CD8+ T cells cultured with DlstTreg-iWT or DlstTreg-iKO iTreg cells for 3 days. CTV, Cell Trace Violet. l,m, Changes in body weight relative to baseline at week 1 to week 8 (W1–W8) (l) and H&E staining and histological score of colon tissues at week 8 (m) in Rag1−/− mice that received splenic CD4+ TN cells from CD45.1 mice either alone (no Treg cells, n = 4) or with DlstTreg-iWT iTreg cells (n = 5) or DlstTreg-iKO iTreg cells (n = 5). Scale bar, 100 μm. np, Representative flow cytometry of colon tissue (n), absolute number of CD45.1+, IFNγ+CD45.1+ and IL-17+CD45.1+ cells (o) and absolute number of CD45.2+, IFNγ+CD45.2+ and IL-17+CD45.2+ iTreg cells (p) in Rag1−/− mice that received splenic CD4+TN cells from CD45.1 mice either alone (no Treg cells, n = 4) or with DlstTreg-iWT iTreg cells (n = 5) or DlstTreg-iKO iTreg cells (n = 5). Data are shown as mean ± s.d. and analyzed by one-way ANOVA with Tukey’s post hoc test (l,m,o) or two-tailed unpaired Student’s t-test (ek,p).
Fig. 4.
Fig. 4.. Succinate promotes Treg cell production of IL-17 independent of FoxP3.
a,b, Representative flow cytometry analysis (a) and quantification (b) of colonic tdTomato+FOXP3–eGFP+CD4+ Treg cells and tdTomato+FOXP3–eGFPCD4+ exTreg cells in total CD4+ T cells and total tdTomato+ cells in 2.5% DSS (n = 4) or 2.5% DSS + 3% succinate (n = 5) Foxp3GFP-creERT2ROSA26SorCAG-tdTomato mice at day 7. c,d, Representative flow cytometry analysis (c) and quantification (d) of colonic tdTomato+FOXP3+ Treg cells and tdTomato+FOXP3 exTreg cells in total CD4+ T cells and total tdTomato+ cells in mice as in a,b. eg, Representative flow cytometry analysis (e,f) and quantification (g) of IL-17+ cells among tdTomato+FOXP3+ Treg cells (e) and tdTomato+FOXP3 exTreg cells (f) in mice as in a,b. h,i, Representative flow cytometry analysis (h) and quantification (i) of splenic tdTomato+FOXP3–eGFP+CD4+ Treg cells and tdTomato+FOXP3–eGFPCD4+ exTreg cells in total CD4+T cells and total tdTomato+ cells in DlstTreg-iWT and DlstTreg-iKO mice (n = 4 mice per group). j,k, Representative flow cytometry analysis (j) and quantification (k) of splenic tdTomato+FOXP3+ Treg cells and tdTomato+FOXP3 exTreg cells in total CD4+ T cells and total tdTomato+ cells in DlstTreg-iWT or DlstTreg-iKO mice as in h,i. ln, Representative flow cytometry analysis (l,m) and quantification (n) of IL-17+ cells among tdTomato+FOXP3+ Treg cells (l) and tdTomato+FOXP3 exTreg cells (m) in DlstTreg-iWT or DlstTreg-iKO mice as in j,k. Data are shown as mean ± s.d. and analyzed by two-tailed unpaired Student’s t-test.
Fig. 5.
Fig. 5.. Succinate inhibits succinyl-CoA levels in Treg cells.
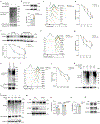
a, Heatmap showing the differentially expressed genes in sorted CD4+CD25+tdTomato+FOXP3–GFP+ iTreg cells at day 2 of culture of splenic CD4+ T cells from DlstTreg-iWT or DlstTreg-iKO mice in the presence of 4-hydroxytamoxifen, IL-2 and TGFβ (n = 3, per group). b, Functional enrichment pathways for the genes upregulated in DlstTreg-iKO iTreg cells. c, Volcano plot showing metabolites alterations between DlstTreg-iKO iTreg cells and DlstTreg-iWT iTreg cells at day 5 of culture, quantified by liquid chromatography–mass spectrometry (LC–MS) (n = 3, per group). d, TCA cycle schematic (top) and α-KG and succinic acid abundance (bottom) in DlstTreg-iKO iTreg cells and DlstTreg-iWT iTreg cells, quantified by LC–MS (n = 3, per group). e, OCR plot and quantification of DlstTreg-iWT iTreg cells (n = 10) and DlstTreg-iKO iTreg cells (n = 11) after 5-day culture. f, Expression of succinyl-CoA (n = 6, per group) and acetyl-CoA (n = 3, per group) in DlstTreg-iKO iTreg cells and DlstTreg-iWT iTreg cells, quantified by ELISA or LC–MS, respectively. g, Immunoblot of succinyllysine after immunoprecipitation with FOXP3 antibodies in human Treg-like MT-2 cells. h, Immunoblot of FOXP3 after immunoprecipitation with succinyllysine (Ksucc) antibodies in MT-2 cells. i, Immunoblot of succinyllysine after immunoprecipitation with FOXP3 antibodies in DlstTreg-iKO iTreg cells and DlstTreg-iWT iTreg cells at day 5 in culture. j, Immunoblot of succinyllysine after immunoprecipitation with FOXP3 antibodies in MT-2 cells 24 h post-treatment with 5 μM succinyl-CoA. k,l, Representative flow cytometric analysis (k), frequency of CD4+CD25+FOXP3+ iTreg cells and FOXP3 MFI (l) among CD4+ T cells treated with succinic acid (1 mM) or succinyl-CoA (5 μM) for 5 days. m,n, Immunoblot of succinyllysine after immunoprecipitation with FOXP3 antibodies (m) and quantification of succinylated FOXP3 (su-FOXP3) levels (n) in WT and Suclg2−/− MT-2 cells. o, Expression of succinyl-CoA in WT and Suclg2−/− MT-2 cells, quantified by ELISA. Data are shown as mean ± s.d. and analyzed by two-tailed unpaired Student’s t-test (df,i,j,n,o) or one-way ANOVA (l) with Tukey's post-hoc test.
Fig. 6.
Fig. 6.. Succinate promotes the ubiquitination and degradation of FoxP3.
a, Immunoblot of HA on MYC immunoprecipitants in HEK293T cells transfected with MYC-FOXP3 and HA-ubiquitin plasmids at 24 h post-treatment with 5 μM succinyl-CoA. b, Immunoblot analysis of FOXP3 protein in cell lysates as in a. c,d, Representative flow cytometry (c) and quantification (d) of FOXP3-GFP expression in HEK293T cells transfected with a FOXP3-GFP fusion-expressing plasmid at 24 h post-treatment with 5 μM succinyl-CoA. e, Representative immunoblot and quantification (n = 3) of FOXP3 protein amount in MT-2 cells treated with 5 μM succinyl-CoA for 24 h followed by treatment with cycloheximide (CHX, 20 μg ml−1) for 0 h, 1 h, 2 h and 4 h. f,g, Representative flow cytometry (f) and quantification (n = 4) (g) of FOXP3 in iTreg cells derived from mouse C57BL/6J CD4+T cells and treated with 5 μM succinyl-CoA and CHX (20 μg ml−1) as in e. h, Immunoblot of Ub-FOXP3 after immunoprecipitation with FOXP3 antibodies in DlstTreg-iKO and DlstTreg-iWT Treg cells. i,j, Representative flow cytometry (i) and quantification (n = 3) (j) of FOXP3 protein in DlstTreg-iWT and DlstTreg-iKO iTreg cells treated with CHX (20 μg/mL) for 0 h, 4 h, 8 h and 12 h. k,l, Immunoblot of FOXP3 ubiquitination (k) and cell lysates analyzed with HA antibodies, MYC antibodies and GAPDH as loading controls (l) in HEK293T cells transfected with MYC-tagged FOXP3 and HA-tagged WT, K48 or K63 mutant ubiquitin for 24 h, then treated with 5 mM succinic acid for another 24 h. mo, Representative immunoblot (m) and semi-quantification of FOXP3 (n) and STUB1 (o) protein levels in WT and Stub1−/− MT-2 cells treated with or without 5 mM succinic acid for 24 h. p, Representative immunoblot of cell lysates from MT-2 cells treated with or without 5 mM succinic acid for 24 h. Data are shown as mean ± s.d. and analyzed by one-way ANOVA with Tukey’s post hoc test (d,e,g,j,n) or two-tailed unpaired Student’s t-test (b,o).
Fig. 7.
Fig. 7.. Succinylation protects FOXP3 from proteasomal degradation.
a, Mass spectra showing ubiquitination to succinylation on K8 and K263 site in MT-2 cells treated with succinyl-CoA (5 μM) for 24 h followed by FOXP3 protein immunoprecipitation and MS. b, Representative immunoblot and quantification (n = 3) of FOXP3 succinylation in HEK293T cells transfected with FOXP3WT, FOXP3K8R, FOXP3K263R and FOXP3KDR for 24 h and immunoprecipitated with an HA antibody. c, Immunoblot of FOXP3 ubiquitination in HEK293T cells transfected with FOXP3WT and FOXP3KDR and Flag-ubiquitin plasmids and immunoprecipitated with an HA antibody. d, Representative immunoblot and quantification (n = 3) of FOXP3 protein in HEK293T cells transfected with FOXP3WT and FOXP3KDR followed by treatment with CHX (20 μg ml−1) for 1 h, 2 h or 4 h. e, Representative immunoblot and quantification (n = 3) of FOXP3 protein amounts in HEK293T cells transfected with FOXP3WT and FOXP3KDR for 24 h, followed by treatment with 5 mM succinic acid for another 24 h. f, Representative flow images and quantification (n = 3) of CTV+ CD8+ T cells division in DlstTreg-iWT and DlstTreg-iKO iTreg cells transfected with FOXP3KDR or control plasmids (EV). g, Representative flow cytometry analysis of FOXP3 expression in DlstTreg-iWT and DlstTreg-iKO iTreg cells transduced with a Thy1.1-FOXP3KDR retrovirus and cultured for 4 days. hj, Body weight changes (h), H&E staining (i) and histological analysis (j) of colon tissues in Rag1−/− mice transferred with naive CD4+ cells from CD45.1 WT mice (no iTreg cells, n = 4) or with FOXP3KDR-Thy1.1+ DlstTreg-iWT iTreg cells (n = 3) or FOXP3KDR-Thy1.1+ DlstTreg-iKO iTreg cells (n = 4). Scale bar, 100 μm. Data are shown as mean ± s.d. and analyzed by one-way ANOVA with Tukey’s post hoc test.
Fig. 8.
Fig. 8.. Elevated succinate associate with Treg cell dysfunction in IBD patients.
ad, Representative flow cytometry analysis of CD4+CD25+FOXP3+ (a) and CD4+CD25+CD127lo (d) Treg cells and percentage (b) and FOXP3 MFI (c) of CD4+CD25+FOXP3+ Treg cells in peripheral blood mononuclear cells (PBMCs) from patents with active Crohn’s disease (A-CD, n = 67) or during recovery phase of Crohn’s disease (R-CD, n = 23) and healthy control (HCs; n = 37). e, ELISA of plasma succinate level in patients as in ad. f, Correlation of FOXP3 MFI with plasma succinate levels in all individuals with Crohn’s disease. g,h, Succinate level in the plasma of healthy controls (n = 37), active ulcerative colitis (A-UC, n = 25) and recovery ulcerative colitis (R-UC, n = 10) patients (g) or in the colon tissues of healthy controls (n = 4), individuals with A-UC (n = 4) and individuals with R-UC (n = 10) (h). il, Representative flow cytometry analysis of CD4+CD25+FOXP3+ (i) and CD4+CD25+CD127lo (l) Treg cells and percentage (j) and FOXP3 MFI (k) of CD4+CD25+FOXP3+ Treg cells in PBMCs from individuals with ulcerative colitis. m, Correlative analysis of succinate level in plasma and colon tissue in individuals with ulcerative colitis. n, Correlative analysis of plasma succinate level and FOXP3 MFI in individuals with ulcerative colitis. o, RT–PCR of Ogdh, Dlst and Dld expression in CD4+CD25+CD127lo Treg cells sorted from the PBMCs of healthy controls (n = 33), individuals with A-CD (n = 67) and individuals with R-CD (n = 23). pr, Correlation of Ogdh (p), Dlst (q) and Dld (r) expression with plasma succinate level in all individuals with Crohn’s disease. su, Correlative analysis of Ogdh (s), Dlst (t) and Dld (u) expression and FOXP3 MFI in all individuals with Crohn’s disease. Data are shown as mean ± s.d. and analyzed by one-way ANOVA with Tukey’s post hoc test (b,c,e,g,h,j,k,o) or Pearson’s correlation analysis (f,m,n,pu).

References

    1. Muzammil MA et al. Advancements in inflammatory bowel disease: a narrative review of diagnostics, management, epidemiology, prevalence, patient outcomes, quality of life, and clinical presentation. Cureus. 15, e41120 (2023). - PMC - PubMed
    1. Glassner KL, Abraham BP & Quigley EMM The microbiome and inflammatory bowel disease. J Allergy Clin Immunol 145, 16–27 (2020). - PubMed
    1. Ooi M et al. GC/MS-based profiling of amino acids and TCA cycle-related molecules in ulcerative colitis. Inflamm Res 60, 831–840 (2011). - PubMed
    1. Wei YH, Ma X, Zhao JC, Wang XQ & Gao CQ Succinate metabolism and its regulation of host-microbe interactions. Gut Microbes 15, 2190300 (2023). - PMC - PubMed
    1. Osaka T et al. Meta-Analysis of Fecal Microbiota and Metabolites in Experimental Colitic Mice during the Inflammatory and Healing Phases. Nutrients 9 (2017). - PMC - PubMed

MeSH terms

Grants and funding

LinkOut - more resources