. 2025 Jun;57(6):1357-1361.
doi: 10.1038/s41588-025-02205-2. Epub 2025 Jun 2.

Phylogenetic inference reveals clonal heterogeneity in circulating tumor cell clusters

Affiliations

Phylogenetic inference reveals clonal heterogeneity in circulating tumor cell clusters

David Gremmelspacher et al. Nat Genet. 2025 Jun.

Abstract

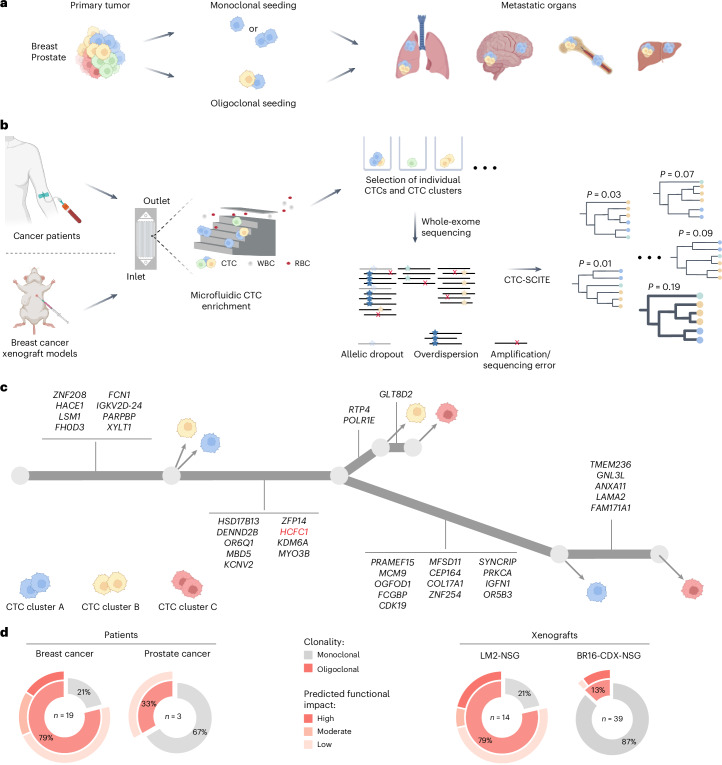
Circulating tumor cell (CTC) clusters are highly efficient metastatic seeds in various cancers. Yet, their genetic heterogeneity and clonal architecture is poorly characterized. Using whole-exome sequencing coupled with phylogenetic inference from CTC clusters of patients with breast and prostate cancer, as well as mouse cancer models alongside barcode-mediated clonal tracking in vivo, we demonstrate oligoclonal composition of individual CTC clusters. These results improve our understanding of metastasis-relevant clonal dynamics.


Conflict of interest statement

Competing interests: N.A. is a cofounder and member of the board of PAGE Therapeutics AG, listed as an inventor in patent applications related to CTCs, a paid consultant for companies with an interest in liquid biopsies and a Novartis shareholder. C.R. is a cofounder, employee and member of the board of PAGE Therapeutics AG. The other authors declare no competing interests.

Figures

Fig. 1
Fig. 1. Phylogenetic inference reveals CTC cluster oligoclonality in carcinoma patient samples and breast cancer xenografts.
a, Schematic representation of clonal architectures of CTCs during cancer metastasis. b, Experimental and computational strategy for deriving phylogenetic trees from CTC mutational profiling. RBC, red blood cell. c, Best-fitting phylogenetic tree (simplified) for patient with breast cancer ‘Br61’ obtained with CTC-SCITE, highlighting three CTC clusters inferred as oligoclonal after statistical evaluation of the probability of branching evolution among their constituent cells. Cell colors reflect CTC cluster identity. Genes with moderate or high predicted functional impact on protein activity are depicted. Oncogenic drivers predicted by the Cancer Genome Interpreter are highlighted in red. Panels ac are created with BioRender.com. d, Proportion of monoclonal and oligoclonal CTC clusters (inner circle) inferred for patient samples (left) and breast cancer xenograft samples (right). For oligoclonal CTC clusters, the fraction of CTC clusters with low, moderate and high predicted functional impact of lineage-defining mutations is depicted (outer circle). The total number of examined CTC clusters (n) for each cancer type and xenograft model is provided. Source data
Fig. 2
Fig. 2. CTC cluster clonality is associated with primary tumor clonal complexity and CTC cluster size.
a, Schematic representation of the experimental strategy used to model clonal expansion with varying clonal complexities and infer the prevalence of oligoclonal CTC clusters. Panel a is created with BioRender.com. b, Proportion of oligoclonal CTC clusters disseminated from tumors with low, medium and high clonal complexities (***P < 1 × 10−15, Cochran–Armitage test, Z = 9.89). The total number of interrogated CTC clusters (n) is specified for each primary tumor complexity. c, Proportion of oligoclonality in CTC clusters with two cells and three or more cells (***P = 3.7 × 10−7, Fisher’s exact test (two-sided), odds ratio = 0.33, 95% confidence interval = 0.20–0.52). All mouse samples with detection of CTC clusters in both categories are shown (n = 3 for low, n = 4 for medium and n = 4 for high primary tumor complexities). Source data
Extended Data Fig. 1
Extended Data Fig. 1. Patient-derived and xenograft-derived CTC clusters.
a, Representative microscopic images of patient-derived CTC clusters stained for EpCAM, HER2 and EGFR (CTCs, green) and CD45 (white blood cells, magenta). Pseudo-coloring and gamma adjustments were applied to fluorescent images. Scale bar, 10 µm. b, Representative images of xenograft-derived CTC clusters preselection and postselection via robotic micromanipulation. The black arrow points to the targeted CTC cluster. Scale bar, 20 µm.
Extended Data Fig. 2
Extended Data Fig. 2. Assessment of clonality in CTC clusters.
a, Schematic representation of the strategy used to estimate the clonality of patient-derived and xenograft-derived CTC clusters. For each patient and xenograft, genealogical tree topologies are sampled from the posterior distribution using CTC-SCITE. For each CTC cluster, we determine the distribution of splitting scores (S), reflecting the probability of branching (versus linear) evolution between pairs of cells (orange histogram). In parallel, monoclonal CTC clusters matching the genotypes of single CTCs are simulated to provide an estimate of the distribution of splitting scores in monoclonal CTC clusters (null distribution; blue histogram). A CTC cluster is assigned oligoclonal if the mean splitting score (dashed orange vertical line) exceeds the 95-percentile of the null distribution (dotted blue vertical line). Panel a is created with BioRender.com. b, Schematic representation of the inference of splitting scores (S) for pairs of individual CTC cluster-derived cells. For a selected pair of cells within a given phylogeny sampled from the posterior distribution of tree topologies, we inspect the paths to their most recent common ancestor. A CTC cluster splits with high confidence if at least one mutation is mapped with high probability to each of the two branches, and it splits with low confidence if all mutations are mapped with low probability to one or both branches. We account for this by computing each mutation’s probability (P) of mapping to either of the two branches A (P = δ) and B (P = ε) and consider the maximum probability of any mutation mapping to it. The splitting score S reflects the lower of those two maximal probabilities.
Extended Data Fig. 3
Extended Data Fig. 3. Molecular barcoding of LM2 cells.
a, Clonetracker XP plasmid map and structure of the barcode cassette obtained from SnapGene software v7.0.0 (from Dotmatics; available at snapgene.com). b, Graphical representation of the experimental design with target multiplicity of infection. c, Left, plot showing the simulated mean proportion of uniquely barcoded cells within sampled cell pools of varying complexities for in vivo engraftment as a function of the number of initially transduced cells (10,000× resampling; Supplementary Note 2). Error bars, s.d. Vertical red line at 151,800 represents the actual number of transduced cells in the conducted experiment as determined via FACS. Right, table depicting the mean and s.d. of the proportion of unique barcodes in sampled pools of 102, 103, 104 and 5 × 104 cells, 72 h after successful transduction of 151,800 cells (10,000× resampling). Panel b is created with BioRender.com. MOI, multiplicity of infection.
Extended Data Fig. 4
Extended Data Fig. 4. Quality filtering of barcoded CTC clusters.
Plot showing the ratio of the smallest number of barcodes accumulating 90% of total aligned reads over the number of cells per cluster (y axis, log2 scale), for CTC clusters included (number of barcodes/number of cells > 1, filter status = pass, n = 426) and removed (number of barcodes/number of cells > 1, filter status = out, n = 94) from the analysis. The horizontal line at y = 0 illustrates the cut-off for filtering. For comparison, the smallest number of barcodes accumulating 90% of aligned reads in negative control samples (n = 6), containing only lysis buffer without cells, is depicted.
Extended Data Fig. 5
Extended Data Fig. 5. Calling clonality in barcoded CTC clusters.
Plots for two-cell CTC clusters (top) and three-cell CTC clusters (bottom) show, for each CTC cluster labeled monoclonal (BC#1 > BC#2 × number of cells, top) or oligoclonal (BC#1 ≤ BC#2 × number of cells, bottom), the fraction of total aligned reads for the most dominant (BC#1, red) and the second most dominant (BC#2, gray) barcode. BC, barcode.
Extended Data Fig. 6
Extended Data Fig. 6. Correlation of detected primary tumor barcodes with engrafted cell counts, and Shannon diversity index of barcode populations.
a, Number of detected barcodes (y axis, log10 scale, cutoff of ten counts per million) as a function of the number of engrafted barcoded cell clones (x axis, log10 scale) in sequenced primary tumor samples (Pearson´s correlation coefficient R2 = 0.90, P = 6.4 × 10−5, 95% confidence interval = 0.68–0.97, two-sided). Points are colored according to classification into low, medium and high complexity based on the Shannon diversity index. b, Shannon diversity index for clonal barcode populations in tumors grown from 102 (n = 2), 103 (n = 2), 104 (n = 4) and 5 × 104 (n = 4) engrafted barcoded cell clones. Bars depict the mean.
Extended Data Fig. 7
Extended Data Fig. 7. Comparing primary tumor clonal frequencies with clonal prevalence in CTC clusters, evaluating the expected versus observed fraction of oligoclonal CTC clusters.
a, Plot showing the mean clonal frequencies of barcodes in primary tumor and CTC clusters stratified by primary tumor abundance (‘high’ for clones within the 99.9 percentile of the empirical distribution of its relative abundances in primary tumors, and ‘low’ for clones outside the 99.9 percentile). Bootstrapping (sample size = 1,000) addresses uncertainty in the estimate. The centers of the boxplots are defined as the medians of the estimates, top and bottom hinges show the first and third quartiles, respectively, and whiskers reach out to the furthest points whose distance from the hinges is smaller than 1.5 times the interquartile range. All outliers are plotted as points. The distortion of clonal representation in CTC clusters is significant (combined one-sided, ***P < 1 × 10−15, χ2 = 3,992.58 with 852 degrees of freedom; Supplementary Note 3). b, Heatmap illustrating the inferred fraction of monoclonality among CTC clusters, stratified by CTC cluster size (x axis, depicted are CTC clusters with two to five cells) and mouse sample (y axis). P values (one-sided) represent significance levels for the deviation from expected monoclonality levels by random clonal mixing (Supplementary Note 4). P values at the margins represent the combined P values obtained by Fisher’s method. NA, not applicable.

References

    1. Hua, X. et al. Genetic and epigenetic intratumor heterogeneity impacts prognosis of lung adenocarcinoma. Nat. Commun.11, 2459 (2020). - PMC - PubMed
    1. Morris, L. G. T. et al. Pan-cancer analysis of intratumor heterogeneity as a prognostic determinant of survival. Oncotarget7, 10051–10063 (2016). - PMC - PubMed
    1. Jamal-Hanjani, M. et al. Tracking the evolution of non–small-cell lung cancer. N. Engl. J. Med.376, 2109–2121 (2017). - PubMed
    1. Noble, R. et al. Spatial structure governs the mode of tumour evolution. Nat. Ecol. Evol.6, 207–217 (2021). - PMC - PubMed
    1. Llofta, L. A., Klelnerman, J. & Saldel, G. M. The significance of hematogenous tumor cell clumps in the metastatic process. Cancer Res.36, 889–894 (1976). - PubMed

LinkOut - more resources