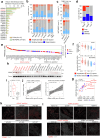
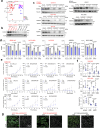
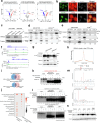
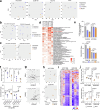
. 2025 Jun;57(6):1463-1477.
doi: 10.1038/s41588-025-02197-z. Epub 2025 Jun 2.

KDM4C inhibition blocks tumor growth in basal breast cancer by promoting cathepsin L-mediated histone H3 cleavage

Affiliations

KDM4C inhibition blocks tumor growth in basal breast cancer by promoting cathepsin L-mediated histone H3 cleavage

Zheqi Li et al. Nat Genet. 2025 Jun.

Abstract

Basal breast cancer is a subtype with a poor prognosis in need of more effective therapeutic approaches. Here we describe a unique role for the KDM4C histone lysine demethylase in KDM4C-amplified basal breast cancers, where KDM4C inhibition reshapes chromatin and transcriptomic landscapes without substantial alterations of its canonical substrates, trimethylated histone H3 lysine 9 (H3K9me3) and lysine 36 (H3K36me3). Rather, KDM4C loss causes proteolytic cleavage of histone H3 mediated by cathepsin L (CTSL), resulting in decreased glutamate-cysteine ligase expression and increased reactive oxygen species. CTSL is recruited to the chromatin by the grainyhead-like 2 (GRHL2) transcription factor that is methylated at lysine 453 following KDM4C inhibition, triggering CTSL histone clipping activity. Deletion of CTSL rescued KDM4-loss-mediated tumor suppression. Our study reveals a function for KDM4C that connects cellular redox regulation and chromatin remodeling.


Conflict of interest statement

Competing interests: K.P. serves on the Scientific Advisory Board of the Susan G. Komen Foundation, the V Foundation and Ideaya Biosciences; is an adviser to Curie.Bio; holds equity in Antares and stock options in Ideaya Biosciences; receives sponsored research funding from Novartis and received honoraria from AstraZeneca and sale of Scorpion Therapeutics stocks upon their acquisition by Eli Lilly in the past 12 months. F.M. is a cofounder of and has equity in Harbinger Health, has equity in Zephyr AI, and serves as a consultant for Harbinger Health, Zephyr AI and Red Cell Partners. F.M. declares that none of these relationships are directly or indirectly related to the content of this paper. L.E.S. and M.E. are current employees of AstraZeneca. M.L.-N. is a current employee of InSphero. D.J.M. is a current employee of Veralox Therapeutics. A.J. is a current employee of Pfizer. J.J. is a current employee of Odyssey Therapeutics. The other authors declare no competing interests.

Figures

Fig. 1
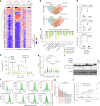
Fig. 1. KDM4C inhibition-induced transcriptomic and chromatin remodeling.
a, Heatmap showing the log2(fold change (FC)) of the union of all DEGs between vehicle versus shKDM4C merged from all the indicated Dox-inducible shKDM4C cell models. Gene expression FCs were normalized to each hairpin control. b, Heatmap illustrating the Pearson correlation R value of log2(FCs) of all DEGs from each pairwise comparison. Correlations among KDM4C-amplified basal cell lines are highlighted in a green rectangle. c, Heatmap depicting alterations of the 50 Hallmark gene signature enrichment scores induced by downregulation of KDM4C and KDM4 inhibitor treatments. Delta enrichment scores were calculated by subtracting the scores of control groups from each treatment condition. Pathways were ranked from the most decreased to the most increased upon KDM4C inhibition. Metabolic pathways commonly repressed in KDM4C-amplified lines are highlighted by light blue rectangle. d, Dot plot showing the 50 Hallmark gene signature enrichment score differences between TNBCs with (n = 49) or without (n = 61) KDM4C copy number gain in the TCGA cohort. Delta enrichment scores were calculated by subtracting the mean values of KDM4C-non-amplified group from KDM4C-amplified group. e, Scatter plots representing the log2-normalized counts of H3K9me3 and H3K36me3 ChIP–seq (5 kb bin) and merged ATAC–seq peaks between control and shKDM4C groups in all 3 cell lines. Numbers of differential regions and directionality (up or down) are indicated on each plot. f, Genomic track view of KDM4C, ATAC–seq, H3K36me3 and H3K9me3 signals at the ADARB1 gene locus in SUM149 cells with or without KDM4C knockdown. Chr21, chromosome 21. g, Heatmap showing the top 30 and 2 consistently and uniquely enriched motifs in gained and lost ATAC sites, respectively, normalized to vehicle groups in the indicated cell lines. log10(E values) represent the significance of enrichment. Motifs of transcription factors associated with EMT (pro-EMT or anti-EMT) or antioxidant response are highlighted with different colors. TF, transcriptional factor. Source data
Fig. 2
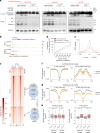
Fig. 2. KDM4C inhibition induces proteolytic cleavage of histone tails.
a, Heatmap showing histone peptide abundance by MS in the indicated cell lines expressing Dox-inducible shKDM4C following control (no Dox, dimethyl sulfoxide (DMSO)), shKDM4C induction (1 μg ml−1 Dox, DMSO) or 10 μm ML324 (no Dox) treatment. Peptide abundances were normalized to the mean values of vehicle group within each cell line and ranked from N to C terminus. b, Schematic illustration of proteolytic cleavage sites in histones H3 and H4 after KDM4C blockade. c, Bar plot showing the clipped H3 peptide (TKAAR) total ion chromatogram signal intensity in the indicated groups. Mean ± s.d. are shown. Two-sided Dunnett’s test was used within each cell line for groups with biological triplicates, except T47D shKDM4C group. d, Immunoblot for histone H3 using C (C′-H3) and N (N′-H3) terminal antibodies in 5 cell lines with inducible shKDM4C infection, following control (DMSO, no Dox), 1 μg ml−1 Dox (shKDM4C), 10 μm ML324 (no Dox) or 1 μm QC6352 (no Dox) for 5 days. Tubulin was used as a loading control. Clipped H3 bands are marked with red arrow. Experiments were repeated independently three times (HCC1954, SUM149 and HCC38) or twice (HDQP1 and HCC1806) with similar results. e, Heatmap showing histone peptide abundance by MS in SUM149 cell line following DMSO (vehicle) or 10 μm ML324 treatment in the presence or absence of the indicated protease inhibitors (100 μm AEBSF HCl, 100 μm pepstatin A, 10 μm SID2668150, 10 μm E64d and 5 μm CTSLi-III) for 24 h. Peptide abundances were normalized to the mean values of vehicle group within each cell line and ranked from N to C terminus. f, Box plots depicting differences in N-terminal histone H3 (amino acid positions 0–26) peptide abundances between vehicle and KDM4C-inhibited samples following the indicated protease treatment in the SUM149 cell line. Box plots span the upper quartile (upper limit), median (center) and lower quartile (lower limit). Whiskers extend a maximum of 1.5× IQR. Statistical significance of differences was determined by two-sided Kruskal–Wallis test. g, Bar plot showing the ML324-induced FC of clipped H3 peptide (TKAAR) total ion chromatogram signal intensity in the indicated groups. Mean ± s.d. are shown for each group with n = 3 (CTSLi-III group) and n = 2 (all the rest) biological replicates. h, Representative flow cytometry plots depicting the shift of CTSL magic red signal after 1 μm QC6352 treatment for 5 days. i, Bar plot summarizing the QC6352-induced FCs in CTSL activity merging from n = 5 (SUM149), n = 4 (HCC1954) and n = 3 (other cell lines) independent experiments in each cell line (mean ± s.d.). Two-sided Mann–Whitney U test was used to compare average FCs between four KDM4C-amplified and four non-amplified cell lines. SID, SID2668150; AEBSF, 4-(2-aminoethyl)benzenesulfonyl fluoride hydrochloride. Source data
Fig. 3
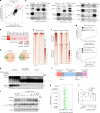
Fig. 3. CTSL is a chromatin-bound histone H3 protease activated by KDM4C inhibition.
a, Immunoblot showing H3 protein detected with C-terminal antibodies and CTSL in three KDM4C-amplified cell lines after 5 days of treatments with DMSO, 10 μm ML324 or 1 μm QC6352 in sgScramble and CTSL KO models. Tubulin was used as a loading control. All experiments were repeated independently at least twice with similar results. b, Genomic track view of KDM4C and CTSL binding signals in SUM149 cell lines with or without ML324 treatment at the NFATC4 gene locus. Chr14, chromosome 14. c, Heatmap showing differential and unchanged CTSL peaks after ML324 treatment in SUM149 cell line. Signal intensity is illustrated in a 4 kb window. Venn diagram on the right side illustrating the intersection of unchanged and lost CTSL peaks with KDM4C binding sites. Fisher’s exact test (two-sided) was used. d, Line plot showing Binding and Expression Target Analysis (BETA) to assess the association between lost CTSL sites and DEGs in SUM149 cells following ML324 treatment. Statistical comparison to the background genes was performed using one-sided Kolmogorov–Smirnov test. eg, Intensity plots representing ATAC–seq signal at CTSL peaks lost following ML324 treatment in SUM149 cell line (e), histone H3 signal using the indicated antibodies for ChIP in vehicle and ML324-treated SUM149 cells expressing N-terminal GFP- (f) or V5-tagged (g) histone H3 at CTSL binding sites at the range of ±2 kb of the PC. The 95% confidence interval of each curve is presented. h, Box plots showing ML324-induced H3 signal changes in each indicated ChIP–seq sample at CTSL peaks or at the same number of random peaks (n = 16,141 peaks). Box plots span the upper quartile (upper limit), median (center) and lower quartile (lower limit). Whiskers extend a maximum of 1.5× IQR. Two-sided Mann–Whitney U test was used. PC, peak center. Source data
Fig. 4
Fig. 4. GRHL2 recruits CTSL to the chromatin, and its methylation modulates CTSL activity.
a, Scatter plot showing the correlation of log2(FC) (normalized to IgG control) MS signal of proteins detected in CTSL immunoprecipitants in SUM149 cell models shKDM4C #17 and shKDM4C #20 at baseline without Dox treatment. The linear regression line with 95% confidence interval is shown. P values were derived from two-sided Pearson correlation. b, Heatmap depicting rank order of transcription factor binding site motifs enriched in CTSL binding sites of vehicle-treated cells in SUM149 and HCC1954 cell lines. log10(E values) were used to define the significance of enrichment. c, Immunoblot analysis of KDM4C, GRHL2 and CTSL immunoprecipitants and 10% of input detected with the indicated antibodies in SUM149 cells. CTCF was used as negative control. Signal intensity normalized to input is indicated for each protein. All experiments were repeated at least twice independently with similar results. d, Venn diagrams showing intersections of CTSL and GRHL2 binding sites in HCC1954 and SUM149 cells. e, Heatmap showing overall intensities of CTSL chromatin binding in scramble control and GRHL2 KO SUM149 cell line. Signal intensity is illustrated in a 4 kb window (PC). f, Heatmaps illustrating triple (CTSL+GRHL2+KDM4C+) and double (CTSL+GRHL2+) overlapping peaks in SUM149 cell lines. Signal intensity is depicted in a 4 kb window. g, Line plot showing BETA for assessing the association of triple and double overlapping peaks with differentially expressed genes in SUM149 following ML324 treatment. One-sided Kolmogorov–Smirnov test was applied to calculate the P values. h, Immunoblot for GRHL2 and CTSL in 10% input and immunoprecipitants of pan-lysine methylation and IgG antibody from cells with the indicated treatments. GRHL2 and CTSL signal normalized to input is indicated for each condition. The experiment was repeated three times independently with similar results. i, Schematic view of GRHL2 protein structure indicating the location of the lysine methylation sites. j, Immunoblot for GHRL2 and C-terminal histone H3 following 3 days of treatment with vehicle or 1 μm QC6352 of SUM149 cells expressing WT or the indicated mutant GRHL2. This experiment was repeated twice independently with similar results. k, Representative flow cytometry plots depicting the shift of CTSL activity signal in SUM149 cells with the indicated conditions. l, Bar plot summarizing the QC6352-induced CTSL magic red FCs in SUM149 cell models merging three independent experiments (mean ± s.d.). Two-sided ordinary one-way analysis of variance (ANOVA) test was used. Source data
Fig. 5
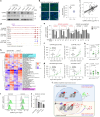
Fig. 5. KDM4C blockade causes redox imbalance that activates CTSL.
a, Heatmap showing clustering of 248 polar metabolites in Dox-inducible shKDM4C-infected HCC1954, SUM149 and T47D cells following control (no Dox, DMSO), shKDM4C induction (1 μg ml−1 Dox, DMSO) or 10 μm ML324 (no Dox) treatment and in HCC70 parental cells with or without 10 μm ML324 treatment. Metabolite abundances in each condition were normalized to the mean value of vehicle group of each cell line. b, Venn diagrams showing intersections of upregulated or downregulated metabolites in shKDM4C-expressing HCC1954 and SUM149 cells with either Dox (shKDM4C) or ML324 treatment. c, Bar plot representing the top ten consistently decreased metabolites in shKDM4C-expressing HCC1954 and SUM149 cells with either Dox or ML324 treatments. d, Dot plots depicting normalized reduced (GSH) and oxidized (GSSG) GSH levels and their ratios in HCC1954 and SUM149 cell lines with shKDM4C or ML324 treatment. Mean ± s.d. from n = 3 is shown. Dunnett’s test (two-sided) was used. m/z, mass-to-charge ratio of ions. e, Line plot depicting oxygen consumption rate (OCR) changes recorded by seahorse mito-stress assay in SUM149 cell lines treated with DMSO, 10 μm ML324 or 1 μm QC6352 for 3 days. Three time points were recorded for each state. This experiment was repeated three times independently with similar results. f, Representative flow cytometry plots depicting the shift of CellROX green signal in 8 cell lines after 1 μm QC6352 for 5 days. g, Bar plot showing QC6352-induced FCs in CellROX green signal merging five (SUM149), four (HCC1954) and three (all the other cell lines) independent experiments of each cell line (mean ± s.d.). Mann–Whitney U test was used to compare average FCs between four KDM4C-amplified and four non-amplified cell lines. h, Dot plot depicting quantification of CTSL activity signal quantified from 120 individual cells from 3 representative fluorescence images of inducible shKDM4C-expressing SUM149 cells treated with DMSO (vehicle), 1 μg ml−1 Dox (shKDM4C), 10 μm ML324 or 1 μm QC6352 or combined with 2 mM GSH-EE for 5 days. Mean and s.d. are shown. Statistical significance of differences was determined by two-sided ordinary one-way ANOVA. i, Immunoblot analysis of histone H3 using antibodies for the C terminus in SUM149 cells treated with 1 µM of QC6352 in the presence or absence of 2 mM GSH-EE for 3 days. Tubulin was used as a loading control. Experiment was repeated three times independently with similar results. j, Line plot illustrating the QC6352-induced log2(FCs) of CTSL magic red and CellROX green signals at the indicated time points in SUM149 cells. Data represent mean ± s.d. merged from three independent experiments. Two-sided two-way ANOVA at each time point was used for statistical comparison. Source data
Fig. 6
Fig. 6. KDM4C blockade decreases GCLC expression via CTSL.
a, Immunoblot analysis of KDM4C and GCLC protein levels in HCC1954 and SUM149 Dox-inducible shKDM4C-expressing cell lines treated with control (no Dox, DMSO), shKDM4C induction (1 μg ml−1 Dox, DMSO), 10 μm ML324 (no Dox) or 1 μm QC6352 (no Dox) treatment for 5 days. Tubulin was used as loading control. Experiment was repeated three times independently with similar results. b, Representative images of GCLC immunofluorescence staining of xenografts derived from SUM149 cells expressing Dox-inducible shKDM4C from mice fed with (n = 4) or without (n = 5) Dox diet. Signal intensity of each tumor was quantified by calculating the mean of three representative regions and shown as mean ± s.d. Two-sided Student’s t test was used. c, Scatter plot depicting correlation between KDM4C and GCLC mRNA levels in 190 basal breast tumors from the TCGA cohort. Two-sided Pearson correlation was used to calculate the P value. The linear regression line with 95% confidence interval is shown. TPM, transcripts per million. d, Genomic track view of CTSL, GRHL2 and KDM4C binding in HCC1954 and SUM149 cells at GCLC genomic locus. ATAC peaks from Dox-inducible shKDM4C-expressing SUM149 cells treated with vehicle, Dox, ML324 and QC6352 are also displayed using the same scaling. Chr6, chromosome 6. e, Bar plot showing the cell percentage normalized to sgScramble cell models treated with DMSO in the indicated groups. Results are shown as mean ± s.d. from n = 3 as representative experiments from at least 2 independent trials. Two-sided ordinary one-way ANOVA was used within each cell line. f,g, Plots depicting the tumor volumes of xenografts derived from SUM149 (f) and HCC1806 (g) sgScramble and CTSLKO cells in mice treated with vehicle or QC6352 at the indicated time points. Data are presented as mean ± s.d. with n = 5 (SUM149) and n = 10 (HCC1806) tumors. Two-sided repeated-measure two-way ANOVA was used to compare the tumor growth kinetics. h, Heatmap illustrating unsupervised clustering of samples based on the GSVA enrichment scores of the 50 hallmark gene signatures. QC6352 upregulated and downregulated pathways that were rescued by CTSL depletion are highlighted by magenta and cyan rectangles, respectively. i, Representative flow cytometry plots depicting the shift of CellROX green signal in SUM149 and HCC38 sgScramble and CTSLKO models after 1 μm QC6352 for 5 days. j, Bar plot depicting QC6352-induced CellROX green FCs merging three independent experiments (mean ± s.d.). Two-sided Student’s t test was used. k, Dot plot depicting GSH levels normalized to tumor weight in SUM149 and HCC1806 xenografts collected at endpoint. Data are presented as mean ± s.d. with n = 5 (SUM149) or n = 10 (HCC1806) tumors. Two-sided Kruskal–Wallis test was used for each comparison. RLU, relative light units. l, Schematic illustration of major findings. HDM KDM4C blocks GRHL2-mediated CTSL activation and histone H3 tail clipping, which have a pivotal role in redox balance via maintaining GSH production and promoting basal breast tumor growth. KDM4C blockade activates CTSL either directly or indirectly and induces redox imbalance, which elevates oxidative stress and impairs basal breast tumor growth. Panel l created with BioRender.com. Source data
Extended Data Fig. 1
Extended Data Fig. 1. KDM4C is frequently amplified in TNBC.
a, Bar plot representing alteration frequencies of 19 genes encoding histone demethylases in TCGA and METABRIC TNBC tumors. b, Stacked bar plots showing KDM4C copy number alteration distribution across PAM50 subtypes in TCGA and METABRIC cohorts. c, Stacked bar plots showing KDM4C copy number alteration distribution across TNBC transcriptomic subtypes. d, Stacked bar plot depicting KDM4C copy number alteration distribution across 57 breast cancer cell lines. e, Dot plot showing log2 copy number value of KDM4C in 57 breast cancer cell lines from CCLE. Colors indicate tumor subtypes. NC indicates no changes. f, Box plots showing KDM4C mRNA expression in TCGA and METABIRC TNBC tumors grouped by copy number alteration types. g, Scatter plot illustrating correlation of KDM4C mRNA expression and log2 copy number in 57 breast cancer cell lines. Colors indicate subtype. R and p values were determined by two-sided Pearson correlation. h, Immunoblot showing KDM4C protein levels across 21 basal breast cancer cell lines with or without KDM4C amplification. Tubulin was used as loading control. i, Box plot showing quantification of KDM4C protein levels normalized to tubulin from h. Each dot represents a cell line in h from n = 7 KDM4C-amplified and n = 14 KDM4C non-amplified basal breast cancer cell lines. Two-sided Mann–Whitney U test was used. j, Scatter plots depicting the correlation of KDM4C protein-to-mRNA and protein-to-copy number across all 21 cell lines in h. P and R values were calculated based on two-sided Pearson correlation. The linear regression lines with 95% confidence interval are shown. k,l, Representative images of immunofluorescence analysis of KDM4C expression in six PDX models (k) and eight primary TNBC clinical samples (l). Scale bar, 100 μm. KDM4C amplification status is indicated for each sample. Staining experiments for k and l have been performed once, while multiple regions were taken for each tissue. All box plots span the upper quartile (upper limit), median (center) and lower quartile (lower limit). Whiskers extend a maximum of 1.5× IQR. Specific sample sizes are labeled for bd and f. Source data
Extended Data Fig. 2
Extended Data Fig. 2. KDM4C knockdown diminishes basal breast tumor growth.
a, Principal component analysis plot showing the clustering of 59 breast cancer cell lines based on PAM50 gene expression panel profiled by CCLE. The names of the eight cell lines used in this study are indicated, and five of these, used for doxycycline-inducible shKDM4C model engineering, are highlighted with an asterisk. b, Immunoblot analysis for KDM4C in four KDM4C-amplified and four non-amplified cell lines used in this study. Tubulin was used as a loading control. This experiment has been performed once. c, Immunoblot showing KDM4C protein levels in the doxycycline-inducible KDM4C knockdown models; 2–3 hairpins were used in each line. Tubulin was used as loading control. Longer exposure for HCC1806 and HDQP1 models was used, given their low baseline levels. All experiments were repeated twice with similar results, except HDQP1, which was done once. d, Bar plots depicting quantification of colony growth assays in the indicated models in the presence or absence of 1 μg/ml doxycycline. Data represent mean ± s.d. from n = 3 of a representative experiment from at least two independent trials with similar results. Two-sided ordinary one-way ANOVA was used in each cell line. e, Growth curves depicting tumor volumes of HCC1954, SUM149 and HCC1806 xenografts expressing shLacZ or shKDM4C Dox-inducible shRNA on control or doxycycline diet. Each dot represents mean ± s.d. of ten tumors per group. Two-sided repeated-measure two-way ANOVA was used for comparing tumor growth ratios within each model. f, Dot plots depicting tumor weights at endpoint. Data represent mean ± s.d. of seven (HCC1954) or ten (SUM149 and HCC1806) tumors per group. Two-sided Kruskal–Wallis test was used. g, Representative images of KDM4C immunofluorescence in HCC1954, SUM149 and HCC1806 xenografts in the presence or absence of doxycycline diet treatment. DAPI was used to stain nuclei. Scale bar, 50 μm. Source data
Extended Data Fig. 3
Extended Data Fig. 3. Pharmacological and transcriptomic characterization of KDM4C blockade.
a, Dose–response curve to ML324 and QC6352 in KDM4C-amplified (n = 5 for QC6532 and n = 4 for ML324) and non-amplified (n = 10) breast cancer cell lines (mean ± s.d. with n = 6 from one experiment). b, Quantification of area under the curve (AUC) in a (two-sided Mann–Whitney U test). c, Dot plots showing PRISM screen-derived QC6352 AUC between luminal and (n = 12) and basal (n = 20) breast cancer cell lines (two-sided Mann–Whitney U test). d,e, Plots depicting tumor volume of HCC1954 and SUM149 xenografts (d) and HCI-041 PDX (e). Mean ± s.d. from n = 10 (d) or n = 4–5 (e) tumors per group are shown (two-sided repeated-measure two-way ANOVA) f,i, Immunoblot for KDM4C and HA in SUM149 cells overexpressing HA-tagged KDM4CWT and KDM4CS198M with siRNA interference against KDM4C 5′UTR region for 3 days (f) and KDM4A/KDM4B/KDM4C from SUM149 Dox-inducible cell models with or without 1 μg/ml doxycycline for 3 days (i) with tubulin was loading controls. (three (f) and two (i) independent repeats with similar results). g,h, Representative images (g) and quantification (h) of colony growth assay with mean ± s.d. from n = 3 of SUM149 parental and KDM4C overexpression models transfected with KDM4C 5′UTR siRNA. (two-sided ordinary one-way ANOVA and two independent repeats with similar results). j,k, Representative images (j) and quantification (k) of colony growth assay of SUM149-inducible cell models from one experiment (mean ± s.d. with n = 3 and two-sided ordinary one-way ANOVA). l, Bar plot showing KDM4C mRNA levels from RNA-seq with mean ± s.d. from n = 3 (HCC1954), n = 4 (SUM149 sh17 − Dox), n = 6 (SUM149 sh17 + Dox) and n = 2 (others; two-sided Student’s t test for HCC1954 and SUM149 sh17 models). m, Stacked bar plot showing numbers of differentially expressed genes (DEGs). n, ML324 dose–response curves of parental and ML324-resistant (MLR) cells (mean ± s.d. with n = 3) o, Representative images of colony growth assay in parental and MLR cells treated with or without 10 μm ML324 for 2 weeks. p, Heatmaps showing the union of DEGs induced by ML324 or in MLR compared to parental cells normalized to the parental-vehicle controls. q, Heatmap depicting the alteration of the Hallmark signature enrichment scores in MLR models. Source data
Extended Data Fig. 4
Extended Data Fig. 4. Chromatin alterations following KDM4C inhibition.
a, Principal component analysis of KDM4C peaks in the indicated cell lines. b, Stacked bar plots showing the distribution of KDM4C peaks in the indicated cell lines in distinct genomic regions. c, Heatmap illustrating ChIP–seq peaks for the indicated marks and cell lines. Windows of peak center with ±2 kb or ±10 kb are shown. d, Box plots showing the ChIP–seq read counts for the indicated histone mark projected on KDM4C peaks or the equivalent number of random peaks (HCC1954, n = 21,768; SUM149, n = 19,675; MCF7, n = 18,160; T47D, n = 19,244). Box plots span the upper quartile (upper limit), median (center) and lower quartile (lower limit). Whiskers extend a maximum of 1.5× IQR (two-sided Mann–Whitney U test). e, Scatter plots representing the log2-normalized counts of H3K9me3 and H3K36me3 ChIP–seq (5 kb bin) and merged ATAC–seq peaks between controls and ML324-treated groups in two cell lines. Numbers of differential regions are indicated. f, Venn diagram showing the intersection of KDM4A, KDM4B and KDM4C ChIP–seq peaks in the SUM149 cell line. g, Plot depicting H3K36me3 ChIP–seq signal in the presence or absence of ML324 treatment at KDM4A or KDM4B peaks. Windows of peak center with ±10 kb are shown. The 95% confidence interval of each curve is presented. h, Venn diagrams showing intersections of H3K4me3 peaks between vehicle and shKDM4C or ML324-treated groups in two cell lines. i, Bar plots showing −log10(p) calculated by the BETA algorithm representing the association of differential H3K4me3 peaks with differentially expressed genes from RNA-seq in the indicated contexts. j, Immunoblot analysis for KDM4C in cell lysates of SUM149 cells with or without KDM4CWT or KDM4CΔTTD overexpressing with 5′UTR region siRNA interference for 3 days. Tubulin was used as loading control. This experiment was repeated independently three times with similar results. k,l, Representative images (k) and quantification (l) of colony growth assay of SUM149 parental and KDM4CWT or KDM4CΔTTD mutant overexpression models transfected with siRNA against KDM4C 5′UTR region. Data are presented as mean ± s.d. with n = 3 normalized to parental with siScramble group from a representative experiment from three independent repeats with similar results (two-sided ordinary one-way ANOVA). Source data
Extended Data Fig. 5
Extended Data Fig. 5. KDM4C inhibition induces proteolytic cleavage of histone tails.
ac, Immunoblot for C′-H3 in three cell lines following DMSO, 10 μm ML324 or 1 μm QC6352 treatment for 5 days (a), SUM149 doxycycline-inducible models with or without 1 μg/ml doxycycline for 5 days (b) and SUM149 cells overexpressing KDM4CWT and KDM4CS198M with siRNA against KDM4C 5′UTR for 5 days (c; two independent repeats for all with similar results). d, Heatmap showing normalized histone peptide abundance in parental and MLR models with or without ML324 treatment. e,i, Box plots showing average N-terminal peptides abundances of histone H3 (n = 27 peptides) or H4 (n = 16 peptides) in the indicated groups (two-sided Kruskal–Wallis test). Box plots span the upper quartile (upper limit), median (center) and lower quartile (lower limit). Whiskers extend a maximum of 1.5× IQR. f, Immunoblot for total and phospho-histone H3 (Ser10) in SUM149 parental and MLR cells (two independent repeats with similar results). g, Cell viability curves normalized to vehicle group in response to CDK8 or AURKA/AURKB inhibitors in SUM149 parental and MLR cells (mean ± s.d. of n = 6 from one experiment). h, Immunoblot for C′-H3 in SUM149-inducible-shKDM4C cells with either 1 μg/ml doxycycline or 10 μm ML324 with different protease inhibitors (5 μm CTSL-inhibitor III, 10 μm SID2668150 or 100 μm AEBSF), with tubulin as loading control (three independent repeats for CTSLi-III experiment with similar results and one experiment for the rest). j, Representative plots depicting the CTSL activity signal in the indicated shKDM4C cell models with 1 μg/ml doxycycline treatment for 5 days. k, Immunoblot analysis for CTSL in the indicated cell lines from one experiment. l,m Representative plot (l) and quantification of mean ± s.d. from three independent experiments (m) of indicated SUM149 models with or without 1 μg/ml doxycycline for 5 days (two-sided ordinary one-way ANOVA). n,o, Representative images of CTSL activity signal in SUM149 cells overexpressing KDM4CWT and KDM4CS198M with siRNA interference against KDM4C 5′UTR for 5 days (n) and quantification of signals of 120 cells from three to four representative regions in mean ± s.d. (two-sided ordinary one-way ANOVA; o). Scale bar, 100 μm. Tubulin was used as loading control for all the immunoblots. Source data
Extended Data Fig. 6
Extended Data Fig. 6. CTSL is a chromatin-bound histone H3 protease activated by KDM4C inhibition.
a, Immunoblot depicting CTSL in sgScramble and CTSLKO models in the indicated cell lines with vinculin as a loading control (two independent repeats with similar results). b, Immunofluorescence staining of CTSL and nuclei in the corresponding sgScramble and CTSLKO derivatives from one experiment. Scale bar, 10 μm. c, Immunoblot depicting CTSL in different fractions in SUM149 sgScramble and CTSLKO derivatives with tubulin, AIF and histone H3 as controls for subcellular fractionation (two independent repeats with similar results). d, Immunofluorescence for CTSL and nuclei in SUM149-inducible-shKDM4C cells treated with DMSO, 1 μg/ml doxycycline (shKDM4C), 10 μm ML324 or 1 μm QC6352 for 3 days from one experiment. Treatment of 1 μm LLoMe for 24 h was a positive control. Scale bar, 10 μm. e, Immunoblot for CTSL in the indicated fractions of SUM149-inducible-shKDM4C cells under the same treatment as d for 5 days (three independent repeats with similar results). f, Immunoblot showing C′-H3 and CTSL in HCC1806 and HDQP1 sgScramble and CTSLKO derivatives with 10 μm ML324 or 1 μm QC6352 treatment for 5 days with tubulin as loading control (two independent repeats with similar results). g, Binding and Expression Target Analysis showing association between ML324-induced gained CTSL sites and differentially expressed genes in SUM149 cells (one-sided Kolmogorov–Smirnov test). h, Intensity plots depicting CTSL ChIP–seq signal in vehicle and ML324-treated SUM149 parental and MLR cells at lost CTSL sites at ±2 kb range of the peak centers. The 95% confidence interval is presented. i, Immunoblot showing H3K4me3, total H3 levels in SUM149 cells ectopically expressing GFP- (left) and V5-tagged (right) histone H3 from one experiment. Ectopic proteins were differentiated by molecular weight and indicated by an asterisk. j, Heatmap showing intrachromosomal and interchromosomal CTSL interactions in SUM149 cells with vehicle or ML324 treatment. k, Box plot showing ML324-induced differential intrachromosomal CTSL interactions with frequency >10 and adjusted p value < 0.05. Box plots span the upper quartile (upper limit), median (center) and lower quartile (lower limit). Whiskers extend a maximum of 1.5× IQR. l, Venn diagrams showing intersections among ML324-induced gained or lost CTSL binding sites in ChIP–seq and intrachromosomal or interchromosomal interaction sites in Hi-ChIP. Source data
Extended Data Fig. 7
Extended Data Fig. 7. Regulation of CTSL chromatin binding and activity by GRHL2.
a, Volcano plots showing CTSL-interacting proteins in SUM149 shKDM4C models (17 and 20 without doxycycline and 17 with doxycycline treatment) identified by mass spectrometry of CTSL immunoprecipitants. Red and blue indicate targets with FDR < 0.05 compared to IgG control. b, Immunofluorescence staining of CTSL (red), nuclei (gray) and GRHL2 or KDM4C (green) in SUM149 cell line from one experiment. Scale bar, 10 μm. c, Immunoblot depicting the expression of GRHL2 in HCC1954 and SUM149 sgScramble and GRHL2KO derivatives with tubulin as a loading control (two independent repeats with similar results). d,e, Immunoblot for KDM4C, GRHL2 and CTSL in the indicated immunoprecipitants of KDM4C in SUM149 GRHL2KO (d) and CTSL in CTSLKO (e) derivates for one experiment. f, Genomic track view of GRHL2 (in parental cells) and CTSL ChIP–seq signal in SUM149 sgScramble and GRHL2KO models at the ASAP3 and NFATC4 loci. g, Immunoblot for C′-H3 and GRHL2 of SUM149 sgScramble and GRHL2KO models following 1 µM of QC6352 treatment for 5 days with tubulin as a loading control (two independent repeats with similar results). h, Intensity plot depicting GRHL2 ChIP–seq signal in vehicle and ML324-treated SUM149 cells on lost CTSL binding sites. i, Venn diagram showing the intersection of upregulated or downregulated differentially expressed genes associated with triple (KDM4C + GRHL2 + CTSL) and double (GRHL2 + CTSL) overlap peaks. j, Dot plot depicting Hallmark signature enrichment predicted from top 300 triple (KDM4C + GRHL2 + CTSL) and double (GRHL2 + CTSL) overlap peaks-associated genes. (Fisher’s exact test using Enrichr). k,l, Immunoblot for GRHL2 in 10% input and immunoprecipitants of pan-lysine methylation and IgG antibody in KDM4C-amplified HCC1954 (k) and KDM4C non-amplified HCC1806 and HDQP1 cells (l) grown in the indicated conditions from one experiment. m, Annotated mass spectra for methylated lysine 94 and 453. Lowercase amino acids indicate these are modified (c is alkylated cysteine, and k is monomethylated lysine). n, Immunoblot of GRHL2 in SUM149 cells following 3 days of siRNA transfection targeting the 3′UTR region of GRHL2, following 3 days of WT or mutant GRHL2 lentiviral infection (two independent repeats with similar results). Target proteins from IP experiments were quantified by normalizing to the corresponding input and labeled below each band. Source data
Extended Data Fig. 8
Extended Data Fig. 8. KDM4C-blockade-induced metabolic alteration.
ac, Principal component analysis plots of metabolomic profiles of the indicated doxycycline-inducible shKDM4C models treated with vehicle (DMSO, no doxycycline), 0.1 μg/ml doxycycline (Dox) or 10 μm ML324 (no doxycycline) for 5 days (a), HCC1954 and SUM149 doxycycline-inducible shKDM4C cells-derived xenografts with regular (−Dox) or doxycycline (+Dox) diets (b) or vehicle and ML324 treatments (c). d, Heatmap illustrating the impact scores of metabolic pathways significantly altered by doxycycline (shKDM4C) or ML324 treatment after integration of metabolomics and RNA-seq data in cell lines or in tumors. Metabolic pathways were ranked starting from the strongest consistent impact (asterisk: pathways with p value < 0.05). e, Bar plots showing intracellular GSH levels and GSH/GSSG ratio in SUM149 and HCC1806 inducible-shKDM4C-expressing cell models treated vehicle (DMSO), 1 μg/ml doxycycline or 10 μm ML324 for 2 days. Data are presented as mean ± s.d. from n = 3 from one experiment (two-sided ordinary one-way ANOVA). f, Dot plot showing GSH levels and GSH/GSSG ratio measured by mass spectrometry in HCC1954 and SUM149-inducible shKDM4C model-derived xenografts from mice fed regular (control) or doxycycline diets (shKDM4C) or treated with vehicle or ML324. Data represent mean ± s.d. with n = 6 tumors (SUM149 vehicle group) or n = 3 tumors for all the other groups (two-sided Student’s t test). g, Scatter plot representing correlations between KDM4C mRNA expression and GSH or GSSG abundance in 72 TNBC tumors profiled in the FUSCC cohort. R and p values were derived from two-sided Pearson correlation. h,i, Principal component analysis plots (h) and a heatmap of unsupervised clustering of 248 polar metabolites (i) of metabolomic profiles of HCC1954 and SUM149 parental or ML324-resistant (MLR) models treated with DMSO or 10 μm ML324 for 5 days. Metabolite abundances in each condition were normalized to the mean value of vehicle group of each parental cell line. j, Dot plots depicting the GSH levels and GSH/GSSG ratio measured by mass spectrometry in HCC1954 and SUM149 parental or MLR models treated with DMSO or 10 μm ML324 for 5 days. Data represent mean ± s.d. of n = 3 biological replicates per group (two-sided ordinary one-way ANOVA). Source data
Extended Data Fig. 9
Extended Data Fig. 9. KDM4C-blockade-induced redox imbalance aids histone clipping.
a, Plots showing the CellROX green signal of five inducible-shKDM4C models treated with or without 1 μg/ml doxycycline for 5 days. b, Representative images (left) and quantification (right) of CellROX orange signal in SUM149 cells overexpressing KDM4CWT and KDM4CS198M with siRNA against KDM4C 5′UTR for 5 days. Mean ± s.d. of 120 cells from three to four representative regions are shown (two-sided ordinary one-way ANOVA). Scale bar, 100 μm. c, Immunoblot for C′-H3 from SUM149 cells treated with 0.5 mM H2O2 for 1 day (top) or 1 μm BSO for 3 days (bottom; two (BSO) and three (H2O2) independent repeats with similar results). d,f, Representative images of CTSL activity and CellROX green signal in SUM149 cells treated with water, 0.5 mM H2O2 with or without 2 mM GSH-EE for 1 day (d) or 1 μm BSO for 3 days (f). Scale bar, 100 μm. e,g, Quantification of d and f. Mean ± s.d. are shown from 60 (e) or 120 (g) cells from three representative regions of each condition (two-sided ordinary one-way ANOVA for e and Student’s t test for g). h, Magnified images of H2O2-treated SUM149 cells. Overlapped CTSL and ROS nuclei signals are highlighted. Scale bar, 30 μm. i, Bar plot showing intracellular GSH levels in inducible-shKDM4C SUM149 cells with DMSO, 1 μg/ml doxycycline (shKDM4C), 10 μm ML324 or 1 μm QC6352 with or without 2 mM GSH-EE for 2 days normalized to the corresponding cell numbers. Mean ± s.d. are shown from n = 3 from one experiment (two-sided ordinary one-way ANOVA). j, Representative images of CTSL activity and CellROX green signal under the same conditions as i for 5 days. Scale bar, 100 μm. k, Mean ± s.d. are shown for ROS signal of 120 cells from three representative regions (two-sided ordinary one-way ANOVA). l, Immunoblot of CTSL isoforms in different fractions of SUM149 cells under the same conditions as i for 5 days with tubulin and histone H3 as loading controls (three independent repeats with similar results). m, Plots showing CTSL activity and CellROX green signals in SUM149 cells treated with 1 μm QC6352 for the indicated time. Representative experiment from three independent repeats is shown. Source data
Extended Data Fig. 10
Extended Data Fig. 10. KDM4C suppression triggers redox imbalance via decreasing GCLC.
a, Schematic view of glutathione synthesis pathway. Enzymes or transporters analyzed in b are indicated with red and blue representing increase and decrease upon KDM4C blockade, respectively. b, Heatmap showing fold change in expression of nine key enzymes or transporters involved in glutathione biosynthesis in HCC1954 and SUM149 Dox-inducible shKDM4C cell lines following treatment with 0.1 μg/ml doxycycline (Dox), 10 μm ML324 or 1 μm QC6352 for 5 days. Gene expression was normalized to the corresponding vehicle controls. c, Left: scatter plots showing the correlation of GCLC expression with GSH abundance from 34 TNBC cell lines. R and p values were derived from two-sided Pearson correlation. Right: dot plot depicting mean ± s.d. of GCLC expression (log2(FPKM)) in GSH-high (n = 24) and GSH-low (n = 10) TNBC cell lines (two-sided Mann–Whitney U test). d, Immunoblot for KDM4C and GCLC in SUM149 cells overexpressing KDM4CWT and KDM4CS198M with siRNA against KDM4C 5′UTR for 3 days with tubulin as a loading control (two independent repeats with similar results). e, Immunoblots showing CTSL and GCLC protein levels in SUM149 sgScramble and CTSLKO cell lines treated with or without 10 μm ML324 or 1 μm QC6352 for 5 days, with vinculin as a loading control (three independent repeats with similar results). f, Principal component analysis plot of RNA-seq profiles of SUM149 sgScramble and CTSLKO models treated with DMSO (vehicle) or 1 μm QC6352 for 3 days. g, Volcano plots showing QC6352-induced differentially expressed genes in SUM149 sgScramble and CTSLKO models. DEGs were selected with adjusted p < 0.05 and log2(FC) > 2, and specific numbers were labeled on the plots. FDR values were calculated by the Wald test following Benjamini–Hochberg correction using DESeq2. h, Venn diagram illustrating the overlap of upregulated and downregulated DEGs induced by QC6352 in SUM149 sgScramble and CTSLKO models. Source data

References

    1. Perou, C. M. et al. Molecular portraits of human breast tumours. Nature406, 747–752 (2000). - PubMed
    1. Garrido-Castro, A. C., Lin, N. U. & Polyak, K. Insights into molecular classifications of triple-negative breast cancer: improving patient selection for treatment. Cancer Discov.9, 176–198 (2019). - PMC - PubMed
    1. Lehmann, B. D. et al. Multi-omics analysis identifies therapeutic vulnerabilities in triple-negative breast cancer subtypes. Nat. Commun.12, 6276 (2021). - PMC - PubMed
    1. Lehmann, B. D. et al. Identification of human triple-negative breast cancer subtypes and preclinical models for selection of targeted therapies. J. Clin. Invest.121, 2750–2767 (2011). - PMC - PubMed
    1. Alderton, G. K. Epigenetic and genetic heterogeneity in metastasis. Nat. Rev. Cancer17, 141 (2017). - PubMed

MeSH terms

LinkOut - more resources