

Integrating SNP data to reveal the adaptive selection features of goat populations in extreme environments
- PMID: 40457191
- PMCID: PMC12128531
- DOI: 10.1186/s12864-025-11743-2
Integrating SNP data to reveal the adaptive selection features of goat populations in extreme environments
Abstract
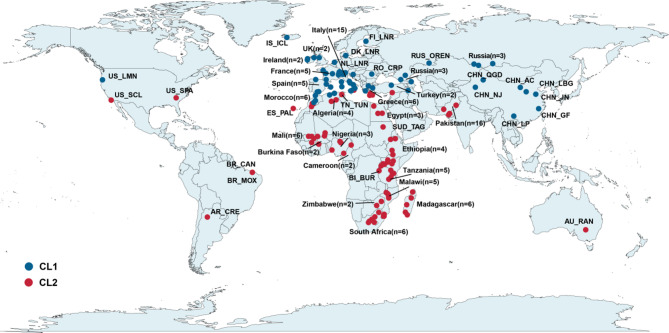
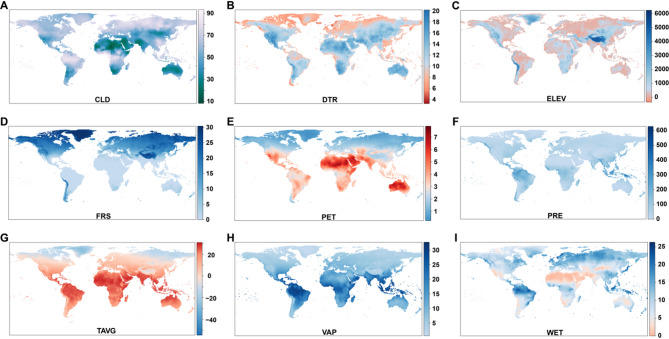
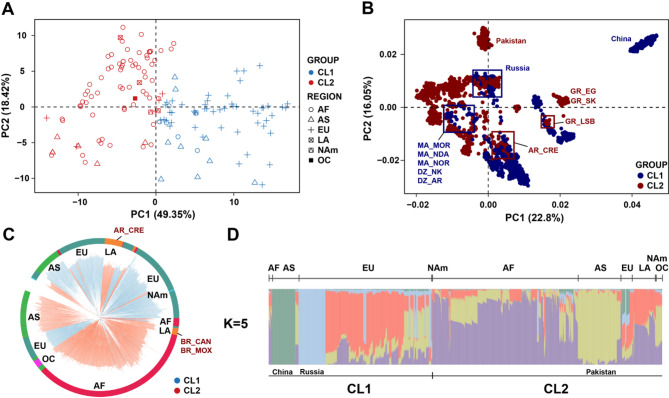
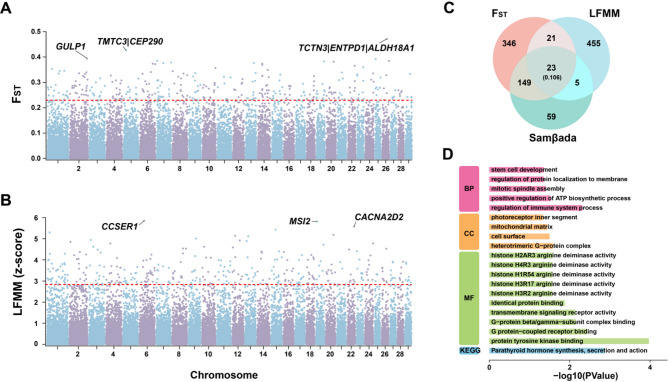
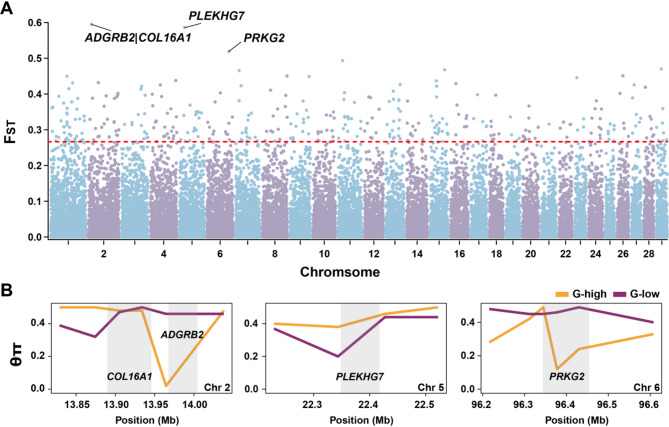
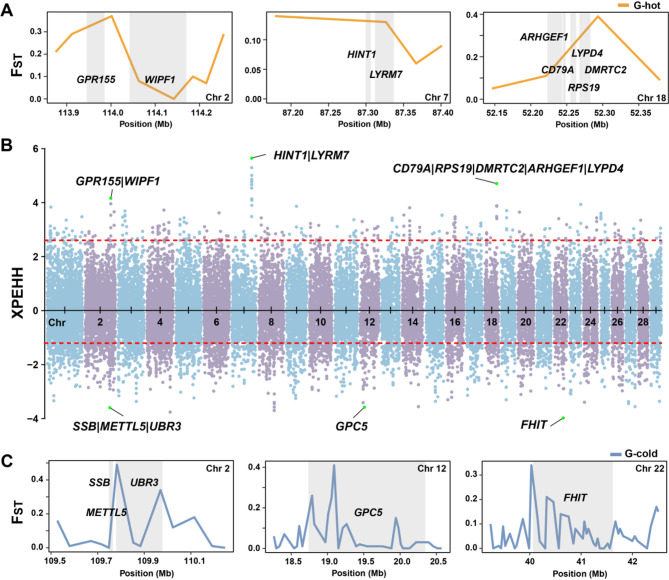
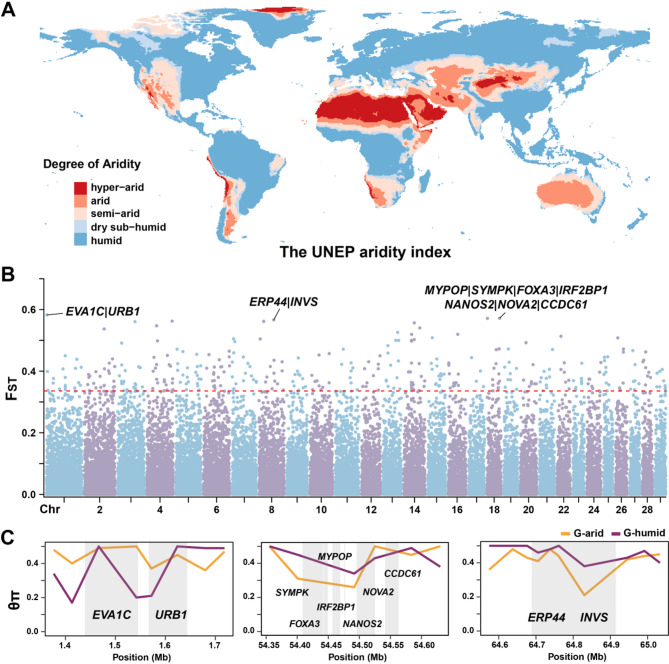
The frequent occurrence of extreme climate events globally has elevated the requirements for environmental adaptability in livestock and poultry. Some goat populations have shown strong adaptability in specific extreme environments, and their genomes often leave genetic traces of adaptive evolution. This study integrated global goat single nucleotide polymorphism (SNP) chip data and raster data of 11 environmental variables. We retained 162 native goat populations and analyzed the environmental data of their regions. We detected 23 candidate genes related to environmental adaptation using selection signal analysis and genome-environment association analysis. After that, we screened out goat populations in extreme environments based on environmental data. Then, we used three selection signal analysis methods (FST, XPEHH and θπ methods) to detect the genomes of these goat populations. In four different extreme environments (high elevation, hot, cold, and arid), 91, 43, 21, and 115 candidate genes were identified, respectively. Combined with studies related to environmental adaptation, we found that genes such as GULP1, GPC5, GPC6, and PDE4D may play important roles in the adaptation of goats to extreme environments. This study provides new insights into the adaptive mechanism of goats in extreme environments and provides an important theoretical basis for goat breed improvement and stress resistance breeding. At the same time, these findings also provide a reference for the study of the adaptability of other livestock in extreme environments.
Keywords: Extreme environment; Genetic-environmental association; Goat; SNP; Selection signal.
© 2025. The Author(s).
Conflict of interest statement
Declarations. Ethics approval and consent to participate: Institutional Review Board Statement: This study has been reviewed and approved by the Institutional Animal Care and Use Committee of Shanxi Agricultural University (Approval number: SXAU-EAW-2022G.WX.0116211). Consent for publication: Not applicable. Competing interests: The authors declare no competing interests. Conflict of interest: The authors declare no conflict of interest.
Figures
Similar articles
-
Selection signatures and landscape genomics analysis to reveal climate adaptation of goat breeds.BMC Genomics. 2024 Apr 29;25(1):420. doi: 10.1186/s12864-024-10334-x. BMC Genomics. 2024. PMID: 38684985 Free PMC article.
-
Genomic analysis uncovers novel candidate genes related to adaptation to tropical climates and milk production traits in native goats.BMC Genomics. 2024 May 14;25(1):477. doi: 10.1186/s12864-024-10387-y. BMC Genomics. 2024. PMID: 38745140 Free PMC article.
-
Whole-Genome Selective Scans Detect Genes Associated with Cashmere Traits and Climatic Adaptation in Cashmere Goats (Capra hircus) in China.Genes (Basel). 2025 Feb 27;16(3):292. doi: 10.3390/genes16030292. Genes (Basel). 2025. PMID: 40149444 Free PMC article.
-
Climate resilience in goats: a comprehensive review of the genetic basis for adaptation to varied climatic conditions.Mamm Genome. 2025 Mar;36(1):151-161. doi: 10.1007/s00335-024-10101-z. Epub 2024 Dec 30. Mamm Genome. 2025. PMID: 39738581 Review.
-
[Progress in goat genome studies].Yi Chuan. 2019 Oct 20;41(10):928-938. doi: 10.16288/j.yczz.19-147. Yi Chuan. 2019. PMID: 31624055 Review. Chinese.
References
-
- Petretto E, Dettori ML, Luigi-Sierra MG, Noce A, Pazzola M, Vacca GM, Molina A, Martínez A, Goyache F, Carolan S. AdaptMap consortium; Amills M. Investigating the footprint of post-domestication dispersal on the diversity of modern european, African and Asian goats. Genet Sel Evol. 2024;56(1):55. - PMC - PubMed
-
- Bertolini F, Servin B, Talenti A, Rochat E, Kim ES, Oget C, Palhière I, Crisà A, Catillo G, Steri R, Amills M, Colli L, Marras G, Milanesi M, Nicolazzi E, Rosen BD, Van Tassell CP, Guldbrandtsen B, Sonstegard TS, Tosser-Klopp G, Stella A, Rothschild MF, Joost S, Crepaldi P, AdaptMap consortium. Signatures of selection and environmental adaptation across the goat genome post-domestication. Genet Sel Evol. 2018;50(1):57. - PMC - PubMed
MeSH terms
Grants and funding
LinkOut - more resources
Full Text Sources
Miscellaneous
