. 2025 Jun 3;25(1):747.
doi: 10.1186/s12870-025-06703-7.

Transcript profiling of plastid ferrochelatase two mutants reveals that chloroplast singlet oxygen signals lead to global changes in RNA profiles and are mediated by Plant U-Box 4

Affiliations

Transcript profiling of plastid ferrochelatase two mutants reveals that chloroplast singlet oxygen signals lead to global changes in RNA profiles and are mediated by Plant U-Box 4

Snigdha Rai et al. BMC Plant Biol. .

Abstract

Background: In response to environmental stresses, chloroplasts generate reactive oxygen species, including singlet oxygen (1O2), an excited state of oxygen that regulates chloroplast-to-nucleus (retrograde) signaling, chloroplast turnover, and programmed cell death (PCD). Yet, the central signaling mechanisms and downstream responses remain poorly understood. The Arabidopsis thaliana plastid ferrochelatase two (fc2) mutant conditionally accumulates 1O2, and Plant U-Box 4 (PUB4), a cytoplasmic E3 ubiquitin ligase, is involved in propagating 1O2 signals for chloroplast turnover and cellular degradation. Thus, the fc2 and fc2 pub4 mutants are useful genetic tools to elucidate these signaling pathways. Previous studies have focused on the role of 1O2 in promoting cellular degradation in fc2 mutants, but its impact on retrograde signaling from mature chloroplasts (the major site of 1O2 production) is poorly understood.

Results: To gain mechanistic insights into 1O2 signaling pathways, we compared transcriptomes of adult wt, fc2, and fc2 pub4 plants. The accumulation of 1O2 in fc2 plants broadly repressed genes involved in chloroplast function and photosynthesis, while inducing genes and transcription factors involved in abiotic and biotic stress, the biosynthesis of jasmonic acid (JA) and salicylic acid (SA), microautophagy, and senescence. Elevated JA and SA levels were observed in 1O2-stressed fc2 plants. pub4 reversed most of this 1O2-induced gene expression and reduced the JA content in fc2 plants. The pub4 mutation also blocked JA-induced senescence pathways in the dark. However, fc2 pub4 plants maintained constitutively elevated levels of SA even in the absence of bulk 1O2 accumulation.

Conclusions: Together, this work demonstrates that in fc2 plants, 1O2 leads to a robust retrograde signal that may protect cells by downregulating photosynthesis and ROS production while simultaneously mounting a stress response involving SA and JA. The induction of microautophagy and senescence pathways indicate that 1O2-induced cellular degradation is a genetic response to this stress, and the bulk of this transcriptional response is modulated by the PUB4 protein. However, the effect of pub4 on hormone synthesis and signaling is complex and indicates that an intricate interplay of SA and JA are involved in promoting stress responses and programmed cell death during photo-oxidative damage.

Keywords: Arabidopsis thaliana; Abiotic stress; Chloroplast; Jasmonic acid; Programmed cell death; Reactive oxygen species; Salicylic acid; Singlet oxygen.


Conflict of interest statement

Declarations. Ethics approval and consent to participate: Not applicable. Consent for publication: Not applicable. Competing interests: The authors declare no competing interests.

Figures
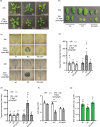
Fig. 1
Fig. 1
The singlet oxygen stress response in fc2 adult plants is blocked by the pub4 mutation. The effect of chloroplast 1O2 accumulation was assessed in adult plants. a Four-week-old plants grown in constant (24 h) light or under stressed conditions (three weeks in 24 h light and one week in 16 h light/8 h dark diurnal (cycling) light conditions). b Representative rosette leaves (#’s 3 and 4) from the plants in (a). (c) Representative leaves (#’s 3 and 4) of plants after two and seven days of cycling light conditions, stained with trypan blue. The deep dark color is indicative of cell death. d and e show mean values (± SEM) of the trypan blue signal in leaves shown in (c) (n ≥ 6 leaves from separate plants). f shows the mean total leaf area (± SEM) of plants in panel (a) (n = 3 plants). g Mean total chlorophyll content (mg/g FW) (± SEM) of adult plant leaves grown in 24 h light conditions (n = 6 biological replicates). For panels d, e, and g, statistical analyses were performed by a one-way ANOVA test followed by Tukey's HSD. Letters indicate statistically significant differences between samples (P ≤ 0.05). For panel f, a two-way ANOVA followed by Sidak multiple comparison test were used for statistical analysis (n = 3 leaves from separate plants) (***, P value ≤ 0.001). Closed circles represent individual data points
Fig. 2
Fig. 2
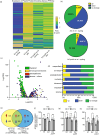
Photo-oxidative stress in fc2 leads to a global change in transcript levels that is mostly reversed by the pub4 mutation. An RNA-Seq analysis was performed to measure steady-state transcript levels in plants grown in permissive constant (24 h) light conditions for 19 days or 17 days in constant light conditions and shifted to singlet oxygen (1O2)-producing 16 h light/8 h dark diurnal (cycling) light conditions for two days. a A heatmap representation of the 1682 differentially expressed genes (DEGs) identified by at least one pairwise comparison between genotypes (fc2 vs. wt or fc2 pub4 vs. wt) in one condition (24 h or cycling) that passed the applied cutoff values (Log2FC > ± 1.5 and a Padj < 0.01). The z-score color bar at the bottom shows the range of expression values, from decreased expression (blue) to increased expression (red). Genes are hierarchically clustered based on Euclidian distance of Log2FC and complete linkage. b and c Venn diagrams depicting unique and shared up-regulated and down-regulated DEGs in 24 h light and cycling light conditions, respectively
Fig. 3
Fig. 3
Gene ontology enrichment analysis of differentially expressed genes in fc2. Gene ontology (GO) term enrichment analyses of the identified (a) up- and (b) down-regulated differentially expressed genes (DEGs) in fc2 mutants (compared to wt) in 16 h light/8 h dark diurnal (cycling) light conditions. Expression data is from the DESeq2 analysis of the included RNA-seq data set. GO-term enrichment analyses were performed using ShinyGO 0.80 with an FDR cutoff of p ≤ 0.01. x-axes indicate fold-enrichment. The ball size indicates the number of genes. The line colors represent FDR values. Shown are heatmaps representing the expression of (c) inducible and (d) repressible core singlet oxygen (.1O2) response genes from the pairwise analyses “wt vs. fc2” and “wt vs. fc2 pub4” under cycling or constant light (24 h) conditions. The z-score bar at the right shows the range of expression values, from decreased expression (blue) to increased expression (red)
Fig. 4
Fig. 4
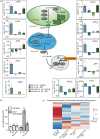
Analysis of plastid protein-encoding gene expression during singlet oxygen stress. We assessed the effect of singlet oxygen (1O2) signaling on the expression of plastid protein-encoding genes (PPEGs). Expression data is from the DESeq2 analysis of the included RNA-seq data set. (a) Heat map showing the expression of 1730 PPEGs (both plastid- and nuclear-encoded) in fc2 and fc2 pub4 (relative to wt), grown under constant light (24 h) and 16 h light/8 h dark diurnal (cycling) light conditions. The up-regulated genes are shown in yellow, the down-regulated genes in blue, and genes with no change in expression are shown in green. (b) Pie chart showing the same 1730 PPEGs differentially expressed in fc2 vs. wt (top) and fc2 pub4 vs. wt (bottom), in cycling light conditions (padj < 0.01). The up-regulated genes are shown in yellow, the down-regulated genes in blue, and genes with no significant change in expression are shown in green. (c) Volcano plot representation of PPEG expression in fc2 compared to wt, grown in cycling light conditions. The genes are color coded based on the predicted localization of their protein products (thylakoid, envelope membranes, plastoglobules, and stroma with other associated locations). The x- and y-axes show log2 fold-change in expression and the Log10 false discovery rate of a transcript being differentially expressed, respectively. (d) Bar graph showing percentage of PPEGs that are up-regulated (yellow), down-regulated (blue), or have no significant change (green) in fc2 in cycling light conditions (compared to wt), based on predicted sub-plastid localization of their protein products (envelope membranes, thylakoid, stroma, plastoglobule, ribosome, nucleoid, and unspecified locations within plastid) (padj < 0.01). (e) Venn diagram comparing differentially expressed PPEGs in fc2 and fc2 pub4, in cycling light conditions compared to wt (padj < 0.01). The total gene counts are grouped as up-regulated or down-regulated, indicated by a red or blue arrow, respectively. Immunoblot analysis of selected plastid-encoded proteins (f) RbcL, (g) PsaA, and (h) PsbD from leaves of three-week-old plants grown in constant (24 h) light conditions or grown in 24 h light conditions and shifted to 16 h light/8 h dark diurnal (cycling) light conditions for two days. Shown are mean values compared to actin levels (± SEM) and normalized to wt in 24 h light conditions (n ≥ leaves from 3 separate plants). Statistical analyses were performed using one-way ANOVA tests, and the different letters above the bars indicate significant differences within data sets determined by Tukey–Kramer post-tests (P ≤ 0.05). Separate analyses were performed for the different light conditions, and the significance of the cycling light is denoted by letters with a prime symbol (ʹ). Statistical analyses of genotypes between conditions were performed by student’s t-tests (*, P ≤ 0.05; ns, P ≥ 0.05). Closed circles indicate individual data points
Fig. 5
Fig. 5
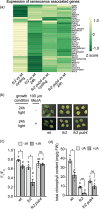
Singlet oxygen and pub4 alter the expression of salicylic acid-related genes and salicylic acid content. The effect of singlet oxygen (1O2) on salicylic acid (SA) content and signaling was assessed. (a) An overview of SA synthesis via the isochorismate synthesis (ICS) (left side) and the phenylalanine ammonia-lyase (PAL) pathway (right side). (b) Relative expression (compared to wt in the same light condition) of ten key SA biosynthesis genes from panel a. Genes involved in the ICS and PAL pathways are labeled in yellow and blue, respectively. Expression data is from the DESeq2 analysis of the included RNA-seq data set. Error bars in the graph represent standard error (ifcSE) estimated by DESeq2 (*, padj < 0.01). (c) Heatmap showing relative expression of genes associated with the regulation of SA biosynthesis from the RNA-seq data set (“wt. vs. fc2” or “wt vs. fc2 pub4” in constant 24 h light conditions or after two days of 16 h light/8 h dark diurnal (cycling) light conditions). The blue and red colors correspond to low and high gene expression, respectively. (d) SA content (ng/g fresh weight (FW)) measured in 17-day-old plants (grown in 24 h light conditions or after two days of cycling light conditions). Shown are mean values ± SEM (n = 3 replicates). Statistical analysis was performed by one-way ANOVA followed by Tukey’s multiple comparison test. Different letters above the bars indicate significant differences (P value ≤ 0.05). Closed circles represent individual data points
Fig. 6
Fig. 6
Jasmonic acid biosynthesis and signaling are induced in fc2 under cycling light conditions. The impact of singlet oxygen (1O2) on jasmonic acid (JA) biosynthesis and signaling was assessed in constant light (24 h) and 16 h light/8 h dark diurnal (cycling) light conditions. (a) Schematic illustration of the JA biosynthesis pathway, with relative expression (compared to wt in the same light condition) of 11 key JA biosynthesis and signaling genes. Expression data is from the DESeq2 analysis of the included RNA-seq data set. Error bars in the graph represent standard error (ifcSE) estimated by DESeq2 (**, padj < 0.01; ***, padj < 0.001). In chloroplasts, Defective In Anther Dehiscence 1 (DAD1) catalyzes the conversion of galactolipids into α-linolenic acid (α-LeA), which is converted into 12-oxo-phytodienoic acid (OPDA) by a series of enzymes; 13-Lipoxygenase (LOX), Allene Oxide Synthase (AOS), and Allene Oxide Cyclase (AOC). Subsequently, OPDA is exported out of the chloroplast via the channel protein JASSY. Inside the peroxisome, OPDA is reduced by the OPDA reductase 3 (OPR3) and shortened in the carboxylic acid side chain by β-oxidation enzymes (ACX1) into JA. In the cytosol, Jasmonate Resistant 1 (JAR1) conjugates isoleucine to JA converting it into JA-Ile. Jasmonate Transporter 1 (JAT1) transports JA-Ile into the nucleus. In response to stressed conditions, JA-Ile attach with the COI1-SCF (coronatine insensitive1- Skp1-Cul1-F-box), to promote ubiquitination and degradation of jasmonic acid repressors JAZ and JAV1, thereby activating JA response genes. (b) Graph showing JA content (ng/g fresh weight (FW)) measured in whole rosettes from plants grown for 19 days constant (24 h) light conditions or 17 days in 24 h light conditions and two days of 16 h light/8 h dark diurnal (cycling) light conditions. Values are means ± SEM (n = 3 biological replicates). Statistical analyses in b were performed using one-way ANOVA tests, and the different letters above the bars indicate significant differences within data sets determined by Tukey–Kramer post-tests (P ≤ 0.05). Separate analyses were performed for the different light treatments, and the significance of cycling light treatment is denoted by letters with a prime symbol (ʹ). (c) Heatmap showing relative expression of 58 genes from gene ontology term “JA mediated signaling pathway” (GO:0009867). The blue and red colors correspond to low and high gene expression, respectively
Fig. 7
Fig. 7
Activation of senescence pathways is blocked by the pub4 mutation. Senescence is induced in fc2 mutants under cycling light conditions and blocked by the pub4 mutation. (a) Expression data from the DESeq2 analysis of the included RNA-seq data set was used to create a heatmap of genes associated with senescence. Increased and decreased expression relative to wt is indicated by yellow and green, respectively. (b) Representative images of detached 3rd and 4th rosette leaves from plants grown in constant (24 h) light conditions. The leaves were incubated in the dark with water (control conditions) or with 100 μM methyl jasmonate (MeJA) for 3 days. (c) Measurement of the maximum quantum efficiency of photosystem II (Fv/Fm) of leaves in panel b. (d) Total chlorophyll content of leaves in panel b. Statistical analyses were performed using one-way ANOVA tests, and the different letters above the bars indicate significant differences within data sets determined by Tukey–Kramer post-tests (P ≤ 0.05). Separate analyses were performed for the different treatments, and the significance of the MeJA treatment is denoted by letters with a prime symbol (ʹ). Statistical analyses of genotypes between conditions were performed by student’s t-tests (*, P ≤ 0.05; **, P ≤ 0.01; ns, P ≥ 0.05). n = whole leaves from 3 separate plants. Error bars = ± SEM. Closed circles indicate individual data points

Update of

Similar articles

Cited by

References

    1. Triantaphylides C, Havaux M. Singlet oxygen in plants: production, detoxification and signaling. Trends Plant Sci. 2009;14(4):219–28. - PubMed
    1. Triantaphylides C, Krischke M, Hoeberichts FA, Ksas B, Gresser G, Havaux M, Van Breusegem F, Mueller MJ. Singlet oxygen is the major reactive oxygen species involved in photooxidative damage to plants. Plant Physiol. 2008;148(2):960–8. - PMC - PubMed
    1. Chan KX, Mabbitt PD, Phua SY, Mueller JW, Nisar N, Gigolashvili T, Stroeher E, Grassl J, Arlt W, Estavillo GM, et al. Sensing and signaling of oxidative stress in chloroplasts by inactivation of the SAL1 phosphoadenosine phosphatase. Proc Natl Acad Sci U S A. 2016;113(31):E4567–4576. - PMC - PubMed
    1. Sun AZ, Guo FQ. Chloroplast Retrograde Regulation of Heat Stress Responses in Plants. Front Plant Sci. 2016;7:398. - PMC - PubMed
    1. Suo J, Zhao Q, David L, Chen S, Dai S. Salinity Response in Chloroplasts: Insights from Gene Characterization. Int J Mol Sci. 2017;18(5):1011. - PMC - PubMed

LinkOut - more resources