. 2025 Jun 3;21(1):398.
doi: 10.1186/s12917-025-04848-z.

Integrative transcriptomic and proteomic analyses reveal that carbon metabolism and complement system of Madin Darby Bovine Kidney cells are affected by bovine coronavirus infection

Affiliations

Integrative transcriptomic and proteomic analyses reveal that carbon metabolism and complement system of Madin Darby Bovine Kidney cells are affected by bovine coronavirus infection

Hui Zhang et al. BMC Vet Res. .

Abstract

Background: Bovine coronavirus (BCoV) is a major pathogen of bovine respiratory disease, causing respiratory and enteric infections in cattle and wild ruminants. It is responsible for economic losses and threatens the health and welfare of cattle industry.

Results: In this study, a BCoV isolate, BCoV/SUWN/XHD-5, had cytopathogenic effects in Madin Darby bovine kidney (MDBK) cells and showed a high viral titer at 24 and 48 h post infection (hpi). Gene expression profiling using RNA sequencing and protein network mapping using the Tandem Mass Tag-based quantitative proteomics approach were performed in MDBK cells with BCoV infection at 24 and 48 hpi, respectively. Compared with mock-infected MDBK cells, 8,720 differentially expressed genes (DEGs) and 296 differentially expressed proteins (DEPs) were identified in BCoV infection at 24 hpi, whereas 5,838 DEGs and 747 DEPs were identified in BCoV infection at 48 hpi. Following GO annotation and KEGG enrichment analysis, most DEGs and DEPs were significantly enriched in metabolic pathways, endocytosis, ribosome and protein processing in endoplasmic reticulum, apoptosis and immune response. A correlation analysis of the proteome and transcriptome revealed that the up-regulated DEGs and DEPs were predominantly associated with metabolic pathways, apoptosis and the MAPK/TNF/Ras signaling pathway, whereas the down-regulated DEGs and DEPs were involved in complement and coagulation cascades and the Wnt signaling pathway. Importantly, BCoV decreases the mRNA and protein levels of complement component C3 in MDBK cells.

Conclusions: The findings of this study provide the first report of the integrative transcriptomic and proteomic analyses of BCoV infection in MDBK cells. It revealed a regulatory network for analyzing the mechanisms of BCoV-host interactions and provides valuable insights into the pathogenesis of BCoV.

Keywords: Bovine coronavirus; C3; Carbon metabolism; Complement systems; MDBK; Proteomics; Transcriptomics.


Conflict of interest statement

Declarations. Ethics approval and consent to participate: Not applicable. Consent for publication: Not applicable. Competing interests: The authors declare no competing interests.

Figures

Fig. 1
Fig. 1
BCoV infection of MDBK cells. A. CPEs observed after independent inoculations with three passages of BCoV/SUWN/XHD-5 strain (P1, P2, P3) in MDBK cells. B. Indirect immunofluorescence assay (IFA) was performed to visualize BCoV replication in MDBK cells, utilizing a BCoV nucleocapsid (N) protein-specific antibody for viral antigen detection; DAPI was used for nuclear staining. C. One-step growth curves of BCoV at different MOI values in MDBK and HCT-8 cells. D. MDBK cells were infected with different doses of BCoV for 48 hpi and then viral replication and proliferation were analyzed by western blotting using monoclonal antibody-targeting BCoV nucleocapsid (N) protein
Fig. 2
Fig. 2
Significant differentially expressed genes (DEGs) during BCoV infection. Transcriptomic profiles of the control and 24 h BCoV-infected cells (A), control and 48 h BCoV-infected cells (B) visualized by heatmap, scatter plot and volcano plot analyses. The heatmap of clustered relative intensities of DEGs for each group. In each scatter plot, the abscissa and ordinate coordinates represent the expression of genes in the two samples, respectively. Red, blue and black dots indicate up-regulated, down-regulated and not significantly changed gene expression levels. In each volcano plot, the abscissa represents the logarithm of the multiple difference in the expression of genes between the two groups; the larger the absolute value, the greater the difference in gene expression. The ordinate represents the negative logarithm of the statistical significance of the gene expression; the larger the value, the more significant the differential expression and the more reliable the differential gene. Each point represents a gene. Red, green and gray indicate up-regulation, down-regulation and not significantly changed gene expression levels
Fig. 3
Fig. 3
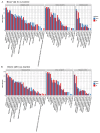
GO annotation enrichment analyses of the DEGs from the RNA-seq transcriptomics data of BCoV-infected MDBK cells at 24 hpi (A) and 48 hpi (B). The x-axis shows the enrichment ratio (ER), calculated as the proportion of DEGs mapped to a specific GO term divided by the proportion of all background genes associated with that term. The y-axis displays the hierarchical GO functional classification. Bubble size corresponds to the count of enriched DEGs per category, while the color gradient (light to dark blue) indicates statistical significance (-log10-transformed p-values). All p-values shown are uncorrected for multiple testing
Fig. 4
Fig. 4
KEGG pathway enrichment analyses of the DEGs from the RNA-seq transcriptomics data of BCoV-infected MDBK cells at 24 hpi (A) and 48 hpi (B). C. Heatmap visualization of differential genes of the central carbon-targeted network after BCoV infected MDBK cells at 24 hpi and 48 hpi based on transcriptomic analysis
Fig. 5
Fig. 5
Significant differentially proteins during BCoV infection. A. Statistics for the differentially expressed proteins (DEPs) according to the TMT proteomics data for BCoV-infected MDBK cells at 24 hpi and 48 hpi. B. Heatmap with hierarchical clustering of proteomic data. The intensity of color reflects the degree of change. Red and blue indicate highly and lowly expressed DEPs, respectively. C and D. Volcano plots of all the DEPs identified between BCoV-infected and control group. Each point represents a protein. Red, blue and gray indicate up-regulation, down-regulation and no significant change, respectively
Fig. 6
Fig. 6
Gene Ontology (GO) annotation for the DEPs between BCoV-infected and control MDBK cells at 24 hpi (A) and 48 hpi (B). DEPs were annotated in three categories: biological processes, cellular components and molecular functions
Fig. 7
Fig. 7
KEGG pathway enrichment analysis of the DEPs of BCoV-infected MDBK cells at 24 hpi and 48 hpi. A. 24 hpi (H24) vs. control. B. 48 hpi (H48) vs. control. The circles and colors indicate the numbers of enriched proteins and the p-values, respectively. The X-axis represents the enrichment factor for each pathway, with the pathway name occurring on the Y-axis
Fig. 8
Fig. 8
Four-dimensional bubble diagram of the GO enrichment correlation analysis. A. 24 hpi (H24) vs. Control. B. 48 hpi (H48) vs. control. Hypergeometric testing was used to detect the correlated genes and proteins. The X-axis represents the enrichment factor, the Y-axis represents the GO entries, and the number of proteins correlated with each entry is shown in parentheses. Different bubble shapes represent different omics data; circles and rhombuses represent proteome and mRNA enrichment results, respectively. Bubble size indicates the number of DEPs or DEGs enriched in the term. The color represents the p-value of the significant enrichment. The greater the enrichment factors, the greater the proportion of DEPs or DEGs in this type of functions
Fig. 9
Fig. 9
Four-dimensional bubble diagram of the pathway enrichment correlation analysis and the taxonomic distribution map of pathways of significantly enriched related genes. A. 24 hpi (H24) vs. control. B. 48 hpi (H48) vs. control. In the left figure, the Y-axis represents each pathway, with the number of proteins correlated with each entry shown in parentheses, and the X-axis represents the enrichment factor. In the right figure, on the X-axis, T and P represent transcriptome and proteome, repectively, and up, down and none represent up-regulation, down-regulation, and no significant change, respectively. The Y-axis represents each pathway, with the number of proteins correlated with each entry shown in parentheses. The heatmap color represents the proportion of proteins correlated with a pathway under each situation
Fig. 10
Fig. 10
Validation of RNAseq-based transcriptomics data and the TMT-based proteomics data as assessed by qRT-PCR
Fig. 11
Fig. 11
BCoV infection of MDBK cells decreased C3 expression in MDBK cells. A. Schematic diagram of the Complement cascade pathway. TMT protein sequencing of the MDBK cells infected with BCoV was performed, and the complement cascade was determined using BCoV-infected MDBK cells at 24 hpi and 48 hpi versus control groups. The green and red rectangle denote the genes encoding proteins with down- and up-regulated expression, respectively. B. Fold changes of major complement components were analyzed according to the proteome data. BCoV infection increased C3 mRNA and protein expression levels in MDBK cells. The MDBK cells were inoculated with the BCoV strain at 0.1 MOI, and the infected cells were analyzed using the C3 mRNA transcript level as assessed by qRT-PCR (C) and the protein level of C3 and BCoV N protein were assessed by western blotting (D). For the data, two-way ANOVA multiple comparisons tests were used to compare the data from different treatment groups. Values are means ± SDs. * p < 0.05, **** p < 0.0001, ns means not significant. The error bars indicate the standard deviations

Similar articles

References

    1. Owens F, Di Serio F, Li S, Pallás V, Randles J, Sano. Vidalakis: virus taxonomy: ninth report of the international committee on taxonomy of viruses. Edn. 2012:1221–34.
    1. Cui J, Li F, Shi Z-L. Origin and evolution of pathogenic coronaviruses. Nat Rev Microbiol. 2018;17(3):181–92. - PMC - PubMed
    1. Saif LJ. Bovine respiratory coronavirus. Veterinary Clin North America: Food Anim Pract. 2010;26(2):349–64. - PMC - PubMed
    1. Mebus CA, White RG, Stair EL, Rhodes MB, Twiehaus MJ. Neonatal calf diarrhea: results of a field trial using a reo-like virus vaccine. Vet Med Small Anim Clin. 1972;67(2):173–4. passim. - PubMed
    1. Calderón Bernal JM, Fernández A, Arnal JL, Baselga C, Benito Zuñiga A, Fernández-Garyzábal JF, Vela Alonso AI, Cid D. Cluster analysis of bovine respiratory disease (BRD)-associated pathogens shows the existence of two epidemiological patterns in BRD outbreaks. Vet Microbiol. 2023;280:109701. - PubMed

LinkOut - more resources