

The molecular impact of cigarette smoking resembles aging across tissues
- PMID: 40457411
- PMCID: PMC12131351
- DOI: 10.1186/s13073-025-01485-x
The molecular impact of cigarette smoking resembles aging across tissues
Abstract
Background: Tobacco smoke is the main cause of preventable mortality worldwide. Smoking increases the risk of developing many diseases and has been proposed as an aging accelerator. Yet, the molecular mechanisms driving smoking-related health decline and aging acceleration in most tissues remain unexplored.
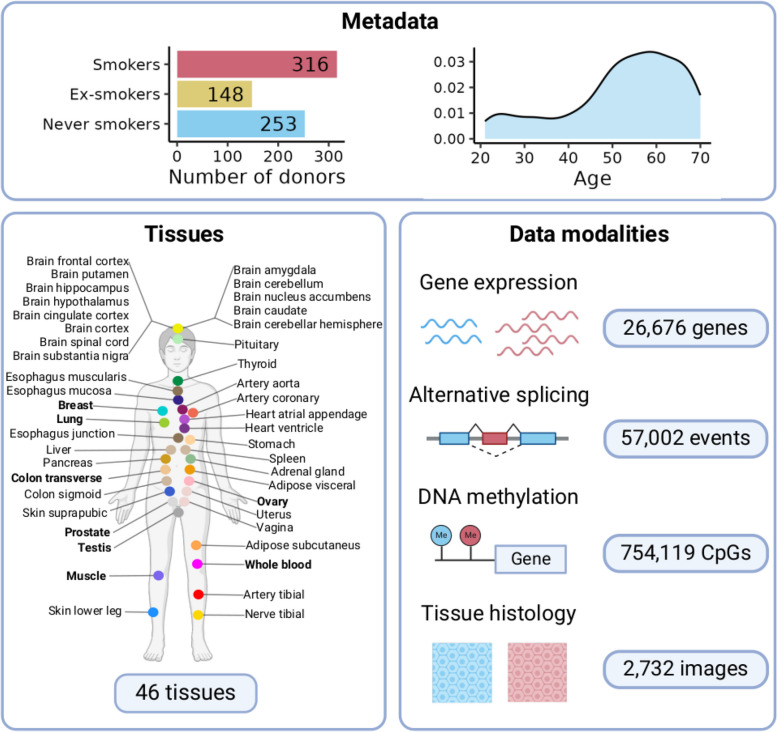
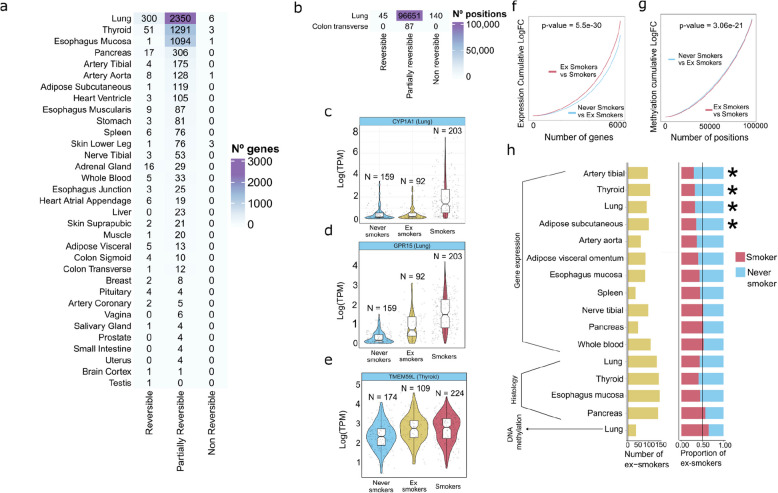
Methods: Here, we use data from the Genotype-Tissue Expression Project (GTEx) to perform a characterization of the effect of cigarette smoking across human tissues. We perform a multi-tissue analysis across 46 human tissues. Our multi-omics characterization includes analysis of gene expression, alternative splicing, DNA methylation, and histological alterations. We further analyze ex-smoker samples to assess the reversibility of these molecular alterations upon smoking cessation.
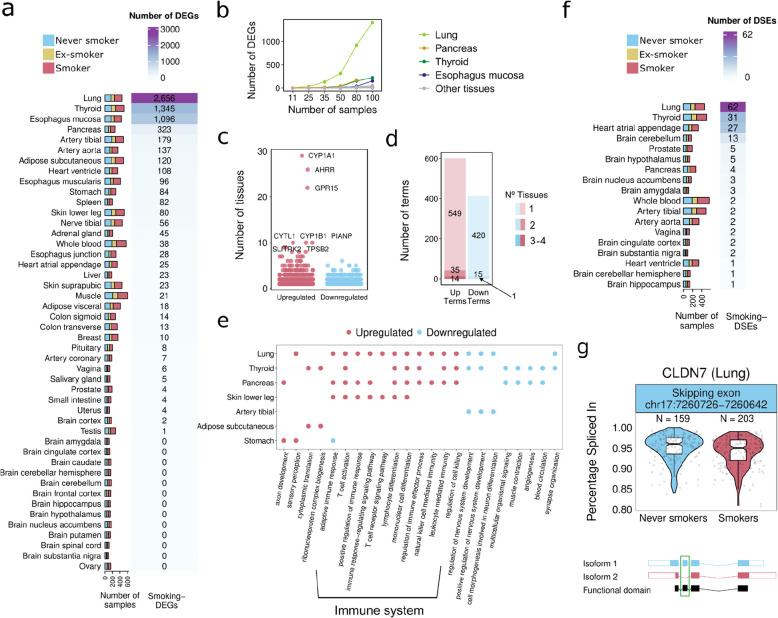
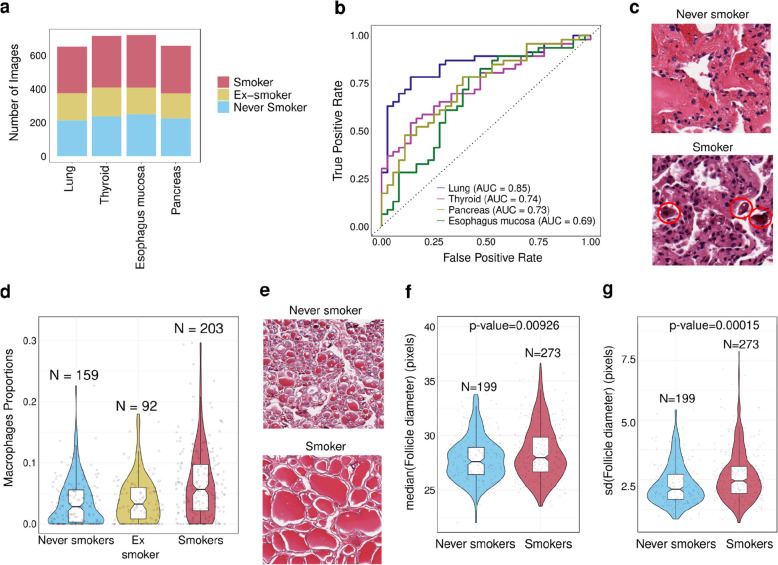
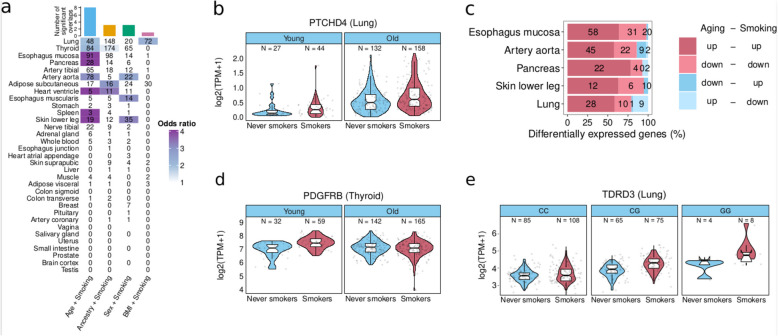
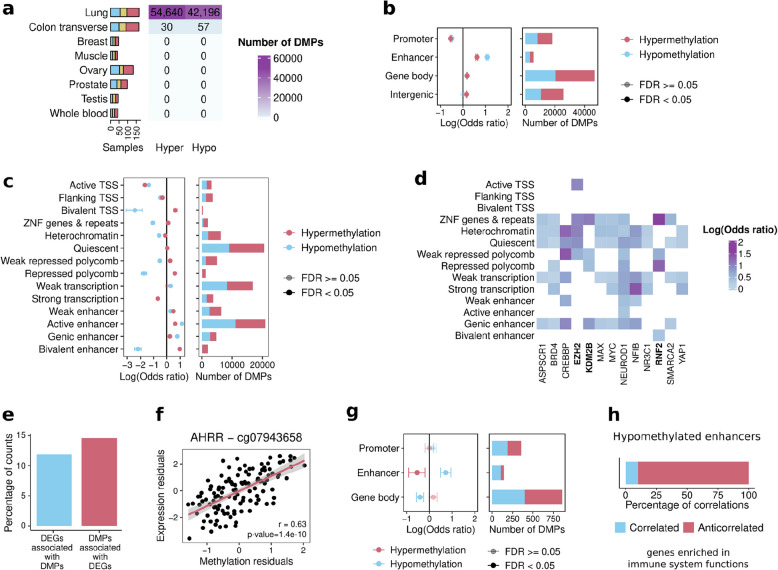
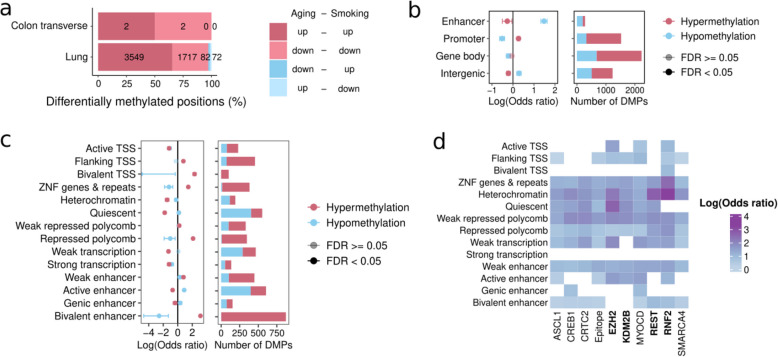
Results: We show that smoking impacts tissue architecture and triggers systemic inflammation. We find that in many tissues, the effects of smoking significantly overlap those of aging. Specifically, both age and smoking upregulate inflammatory genes and drive hypomethylation at enhancers (odds ratio (OR) = 2). In addition, we observe widespread smoking-driven hypermethylation at target regions of the Polycomb repressive complex (OR = 2), which is a well-known aging effect. Smoking-induced epigenetic changes overlap causal aging CpGs, suggesting that these methylation changes may directly mediate the aging acceleration observed in smokers. Finally, we find that smoking effects that are shared with aging are more persistent over time.
Conclusion: Overall, our multi-tissue and multi-omic analysis of the effects of cigarette smoking provides an extensive characterization of the impact of tobacco smoke across tissues and unravels the molecular mechanisms driving smoking-induced tissue homeostasis decline and aging acceleration.
Keywords: Aging; Cigarette smoking; DNA methylation; Gene expression; Histology images; Multi-omics; Multi-tissue.
© 2025. The Author(s).
Conflict of interest statement
Declarations. Ethics approval and consent to participate: The GTEx research protocol was reviewed by Chesapeake Research Review Inc., Roswell Park Cancer Institute’s Office of Research Subject Protection, and the institutional review board of the University of Pennsylvania. Further details can be found in the GTEx biobank paper [22]. All research conforms to the principles of the Helsinki Declaration. Consent for publication: Not applicable. Competing interests: The authors declare no competing interests.
Figures
Similar articles
-
The association of cigarette smoking with DNA methylation and gene expression in human tissue samples.Am J Hum Genet. 2024 Apr 4;111(4):636-653. doi: 10.1016/j.ajhg.2024.02.012. Epub 2024 Mar 14. Am J Hum Genet. 2024. PMID: 38490207 Free PMC article.
-
Epigenome-450K-wide methylation signatures of active cigarette smoking: The Young Finns Study.Biosci Rep. 2020 Jul 31;40(7):BSR20200596. doi: 10.1042/BSR20200596. Biosci Rep. 2020. PMID: 32583859 Free PMC article.
-
Cigarette Smoking and E-cigarette Use Induce Shared DNA Methylation Changes Linked to Carcinogenesis.Cancer Res. 2024 Jun 4;84(11):1898-1914. doi: 10.1158/0008-5472.CAN-23-2957. Cancer Res. 2024. PMID: 38503267 Free PMC article.
-
A systematic review of smoking-related epigenetic alterations.Arch Toxicol. 2019 Oct;93(10):2715-2740. doi: 10.1007/s00204-019-02562-y. Epub 2019 Sep 25. Arch Toxicol. 2019. PMID: 31555878
-
Cigarette smoke-induced alterations in blood: A review of research on DNA methylation and gene expression.Exp Clin Psychopharmacol. 2021 Feb;29(1):116-135. doi: 10.1037/pha0000382. Epub 2020 Jul 13. Exp Clin Psychopharmacol. 2021. PMID: 32658533 Free PMC article. Review.
Cited by
-
Tobacco smoke alters the trajectory of lung adenocarcinoma evolution via effects on somatic selection and epistasis.bioRxiv [Preprint]. 2025 Jul 25:2024.11.27.625765. doi: 10.1101/2024.11.27.625765. bioRxiv. 2025. PMID: 40777438 Free PMC article. Preprint.
References
-
- Reitsma MB, Kendrick PJ, Ababneh E, Abbafati C, Abbasi-Kangevari M, Abdoli A, et al. Spatial, temporal, and demographic patterns in prevalence of smoking tobacco use and attributable disease burden in 204 countries and territories, 1990–2019: a systematic analysis from the Global Burden of Disease Study 2019. Lancet. 2021;397:2337–60. - PMC - PubMed
-
- Carter BD, Abnet CC, Feskanich D, Freedman ND, Hartge P, Lewis CE, et al. Smoking and mortality–beyond established causes. N Engl J Med. 2015;372:631–40. - PubMed
-
- David Bernhard, Christina Moser, Aleksandar Backovic, Georg Wick. Cigarette smoke – an aging accelerator? Exp Gerontol. 2007;42:160–5. 10.1016/j.exger.2006.09.016. - PubMed
-
- Nicita-Mauro V, Lo Balbo C, Mento A, Nicita-Mauro C, Maltese G, Basile G. Smoking, aging and the centenarians. Exp Gerontol. 2008;43:95–101. 10.1016/j.exger.2007.06.011. - PubMed
MeSH terms
Grants and funding
LinkOut - more resources
Full Text Sources
Medical
