Observational Study
. 2025 Jun 2;29(1):219.
doi: 10.1186/s13054-025-05403-w.

The value of dynamic cerebral compliance monitoring after pediatric traumatic brain injury: a STARSHIP study sub-analysis

Collaborators, Affiliations
Observational Study

The value of dynamic cerebral compliance monitoring after pediatric traumatic brain injury: a STARSHIP study sub-analysis

Stefan Yu Bögli et al. Crit Care. .

Abstract

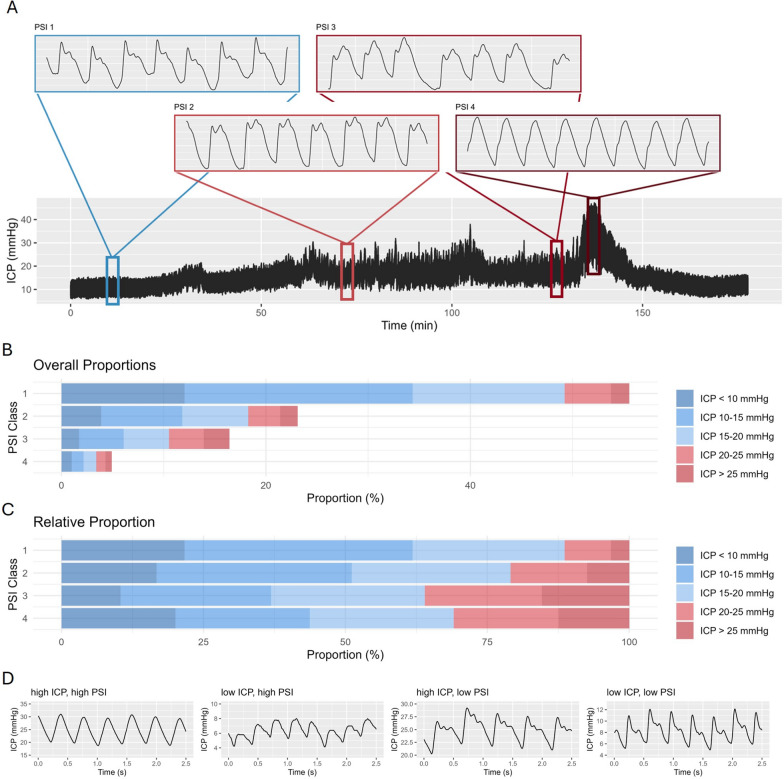
Introduction: Cerebral compliance describes the pressure-volume relationship within the intracranial space, quantifying the brain's capacity to accommodate changes in volume before significant increases in intracranial pressure (ICP) occur. The pulse shape index - PSI-classifies the ICP pulse-wave-configuration into 4 categories representing the incremental state of compliance. In this analysis we explore the metric in a cohort of prospectively collected pediatric TBI patients in relation to outcome, physiological parameters, and individual ICP insults.

Methodology: Data acquired by the prospective observational STARSHIP study which included clinical information, 12-month outcome, and monitoring data from 98 pediatric TBI patients admitted to 10 pediatric intensive care units across the UK was assessed. PSI was calculated and compared using univariable and multivariable analyses, as well as considering their time-trends and relation to individual ICP insults.

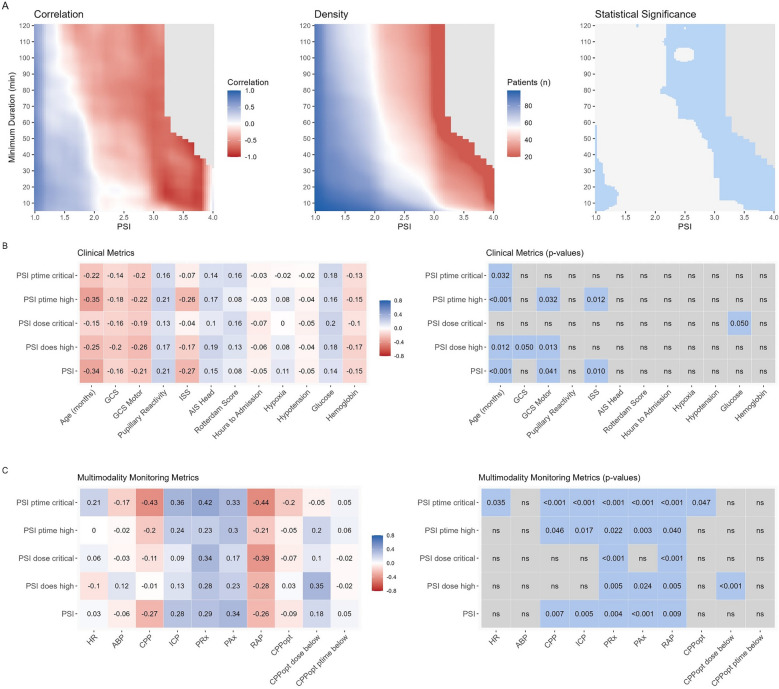
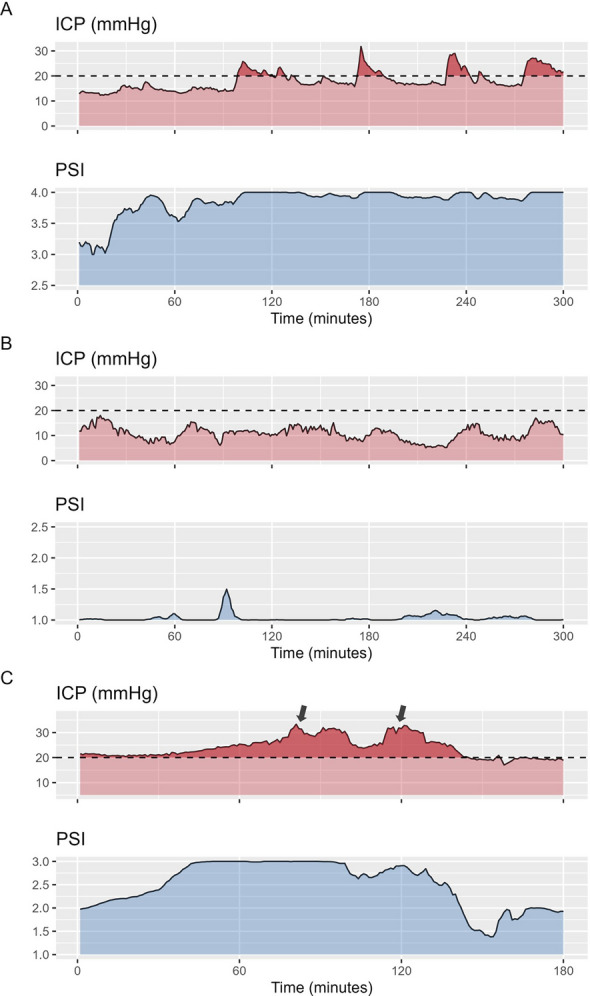
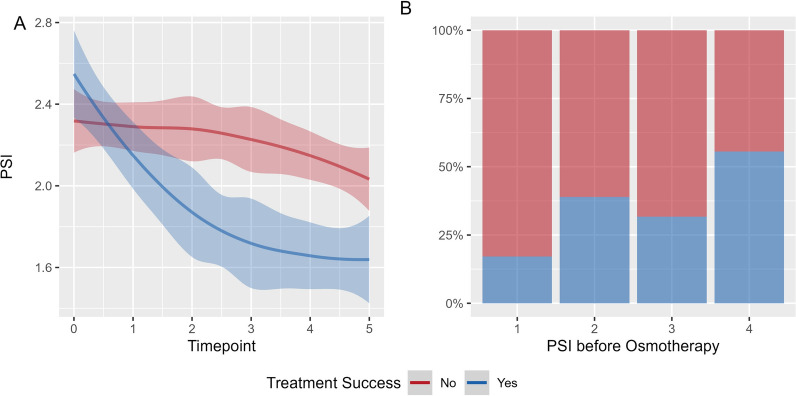
Results: PSI derived metrics were associated with outcomes within univariable analyses, additionally they were associated with ICP, and worse cerebrovascular reactivity (absolute correlation coefficients close to 0.3 for the described metrics). Cross correlation analysis revealed a median delay of 8 min for changes in ICP after changes in PSI (95% confidence interval of 7.6 to 8.5 min). Higher PSI value before ICP elevations was associated with longer duration and greater magnitude of subsequent ICP insults. Additionally, higher PSI before and faster decrease in PSI after osmotherapy were associated with successful reduction of ICP.

Conclusions: PSI enhances bedside monitoring of pediatric TBI by enabling dynamic assessment of cerebral compliance. Variations in PSI appear to precede subsequent ICP insults and are associated with their severity, thereby potentially facilitating timely interventions. Furthermore, assessing the PSI level before administering osmotherapy may allow gauging treatment success.

Keywords: Compliance; Multimodality monitoring; Osmotherapy; Traumatic brain injury; Treatment.


Conflict of interest statement

Declarations. Ethics approval: The STARSHIP trial was approved by the Health Research Authority, Southwest-Central Bristol Research Ethics Committee (Ref: 18/SW/0053). Consent to participate: Due to the observational nature of the acute phase of the project, a deferred consent for acute data collection and sharing was taken to allow for the acquisition of a bias-free sample. Informed consent was received by the patients’ legal guardian for data sharing and follow-up before discharge. Consent to publish: Not applicable. Competing interests: Peter Smielewski and Marek Czosnyka receive part of the licensing fees for ICM + software, licensed by Cambridge Enterprise Ltd, University of Cambridge, Cambridge. The other authors declare no financial or non-financial conflicts of interest.

Figures

Fig. 1
Fig. 1
Intracranial pressure and pulse shape: Panel A presents a 3-h ICP time trend, with magnified PSI waveforms displayed above, illustrating the different PSI classes. The different classes describe the different ICP pulse waveform shapes (based on the relative relationships between the three peaks P1, P2, P3), which are related to different cerebral compliance states. The PSI index [3, 10] represents 5-min averages of classified waveforms within that time bin. Panel B and C display the overall and relative frequencies of different levels of ICP and the corresponding pulse shapes considering all patients. Panel D illustrates example sections where ICP and PSI are both high, both low, or diverging from each other
Fig. 2
Fig. 2
Pulse Shape Index Heatmap – time dependence and correlation to clinical and multimodality monitoring metrics. Panel A presents three heatmaps. The left heatmap illustrates the correlations between different PSI levels, their respective minimum durations, and patient outcomes. Red indicates an association with unfavorable outcomes, whereas blue indicates an association with favorable outcomes. Notably, a shift in association occurs around PSI values 1.5 to 2, depending on the duration spent at that state. The middle heatmap shows the number of patients included in each cell, with higher counts in blue and lower counts in red. The right heatmap displays the results of the statistical analysis, with significant cells highlighted in blue. For all heatmaps, cells containing fewer than 20 patients are shown in gray. Panels B and C each depict correlations on the left—between PSI and clinical metrics (Panel B) or between PSI and multimodality monitoring metrics (Panel C). Here, color indicates the magnitude and direction of correlation (blue for positive, red for negative). On the right side of both panels, the corresponding significant p-values are shown
Fig. 3
Fig. 3
Example sections. Panel A and B display two 5-h example sections. Both start with intracranial pressure (ICP) around 10 to 15 mmHg. In case A the pulse shape index (PSI) is already high at the beginning and increases to values close to 4 without corresponding changes in ICP. This increase is then followed by reoccurring ICP insults lasting up to 60 min. In case B, a highly dynamic ICP trace can be appreciated without corresponding changes in PSI or ICP insults. In case C, a shorter section covering 3 h is shown, where a distinct rise in PSI can be appreciated within the first hour of the section with a delayed increase in ICP, ultimately treated with osmotherapy (black arrows). While the initial administration only leads to a short-lasting improvement in PSI and ICP, the second administration is associated with a distinct improvement of PSI decreasing from 3 to below 2 and a sustained decrease in ICP
Fig. 4
Fig. 4
Pulse Shape Index and Treatment Response. Panel A illustrates the PSI levels over time, stratified by treatment response. Treatment response was defined as either sustained ICP below 20 mmHg for 30 min or a sustained ICP reduction of at least 10 mmHg for 30 min following osmotherapy. Timepoint 0 represents the 10 min preceding osmotherapy, while timepoints 1–5 correspond to consecutive non-overlapping 5-min intervals from 5 to 30 min after administration. For visualization, we applied a locally weighted scatterplot smoothing method, displaying the fitted curve along with its 95% confidence interval. Although PSI decreased in both groups, the reduction was more pronounced in patients where treatment successfully lowered ICP. Panel B depicts the proportion of patients achieving treatment response based on PSI levels before osmotherapy. Overall, a higher PSI prior to treatment was associated with an increased likelihood of treatment response

Similar articles

References

    1. Yau Y-H, Piper IR, Clutton RE, Whittle IR. An experimental evaluation of the Spiegelberg intracranial pressure and intracranial compliance monitor. J Neurosurg. 2000;93(6):1072–7. - PubMed
    1. Shapiro K, Marmarou A. Clinical applications of the pressure-volume index in treatment of pediatric head injuries. J Neurosurg. 1982;56(6):819–25. - PubMed
    1. Mataczyński C, Kazimierska A, Uryga A, Burzyńska M, Rusiecki A, Kasprowicz M. End-to-end automatic morphological classification of intracranial pressure pulse waveforms using deep learning. IEEE J Biomed Health Inform. 2021;26(2):494–04. - PubMed
    1. Cardoso ER, Rowan JO, Galbraith S. Analysis of the cerebrospinal fluid pulse wave in intracranial pressure. J Neurosurg. 1983;59(5):817–21. - PubMed
    1. Kazimierska A, Kasprowicz M, Czosnyka M, Placek MM, Baledent O, Smielewski P, et al. Compliance of the cerebrospinal space: comparison of three methods. Acta Neurochir. 2021;163:1979–89. - PMC - PubMed

Publication types

LinkOut - more resources