. 2025 Jun 2;16(1):274.
doi: 10.1186/s13287-025-04422-2.

Short-Term DMOG treatment rejuvenates senescent mesenchymal stem cells by enhancing mitochondrial function and mitophagy through the HIF-1α/BNIP3 pathway

Affiliations

Short-Term DMOG treatment rejuvenates senescent mesenchymal stem cells by enhancing mitochondrial function and mitophagy through the HIF-1α/BNIP3 pathway

Jiaxin Wen et al. Stem Cell Res Ther. .

Abstract

Background: Mesenchymal stem cells (MSCs) have potential for treating degenerative and immune diseases, but their clinical efficacy is limited by senescence, characterized by mitochondrial dysfunction, impaired mitophagy, and metabolic imbalance. The goal of this study was to investigate the effects of dimethyloxalylglycine (DMOG), a hypoxia-mimetic agent that stabilizes hypoxia-inducible factor 1 alpha (HIF-1α), on rejuvenating senescent MSCs by enhancing mitochondrial function, mitophagy, and metabolic reprogramming.

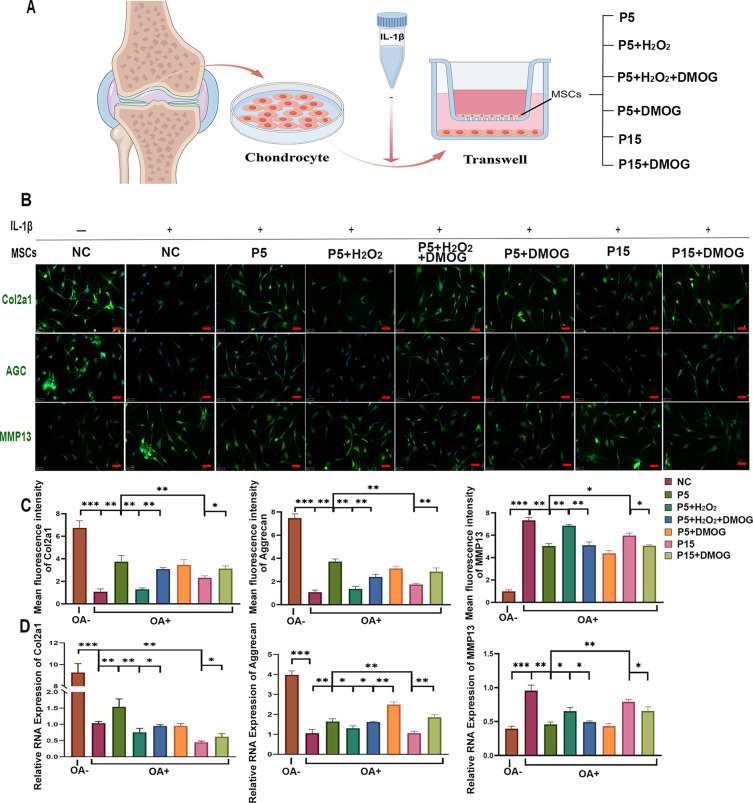
Methods: Two models of MSC senescence were established: oxidative stress-induced senescence using hydrogen peroxide and replicative senescence through serial passaging. Umbilical cord derived MSCs were treated with DMOG for 48 h under normoxic conditions. Mitochondrial function, mitophagy, and metabolism were assessed using assays that measured mitochondrial membrane potential, reactive oxygen species levels, ATP production, and mitophagy. Western blotting and real-time PCR were employed to analyze the expression changes of relevant molecules. RNA sequencing (RNA-seq) was performed to identify key genes and pathways regulated by DMOG. Additionally, to evaluate the therapeutic potential of rejuvenated MSCs, a co-culture system was established, where DMOG-treated senescent MSCs were co-cultured with IL-1β-treated chondrocytes.

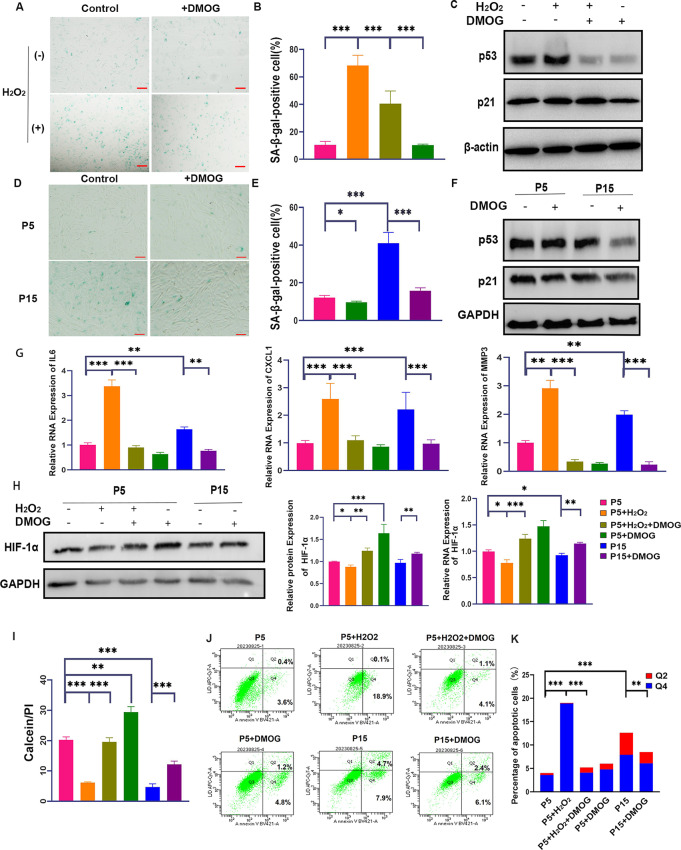
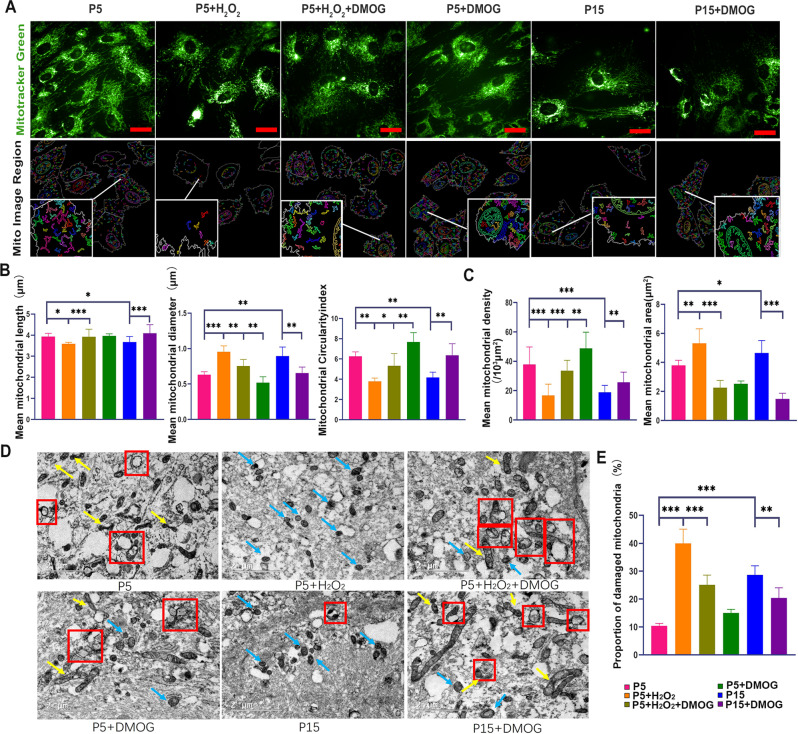
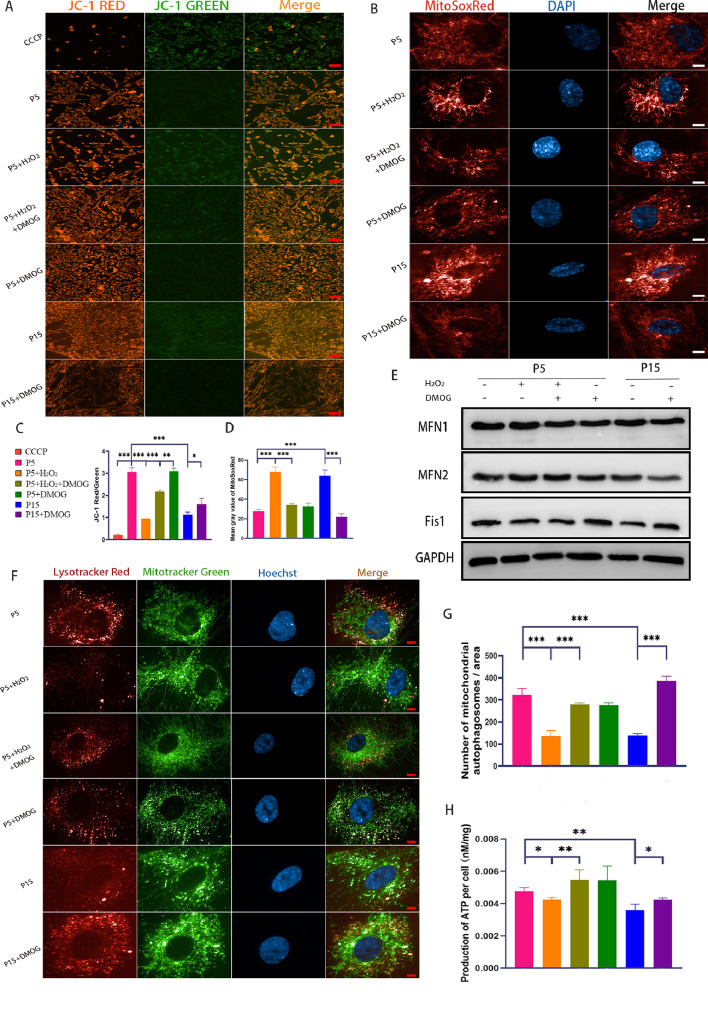
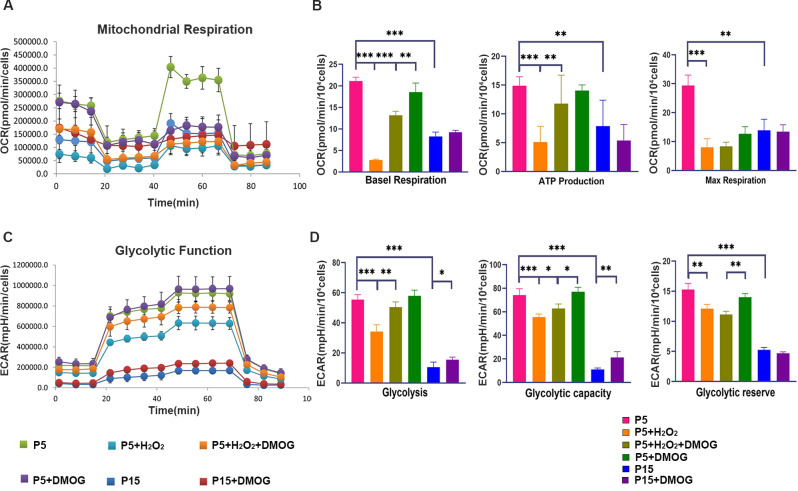
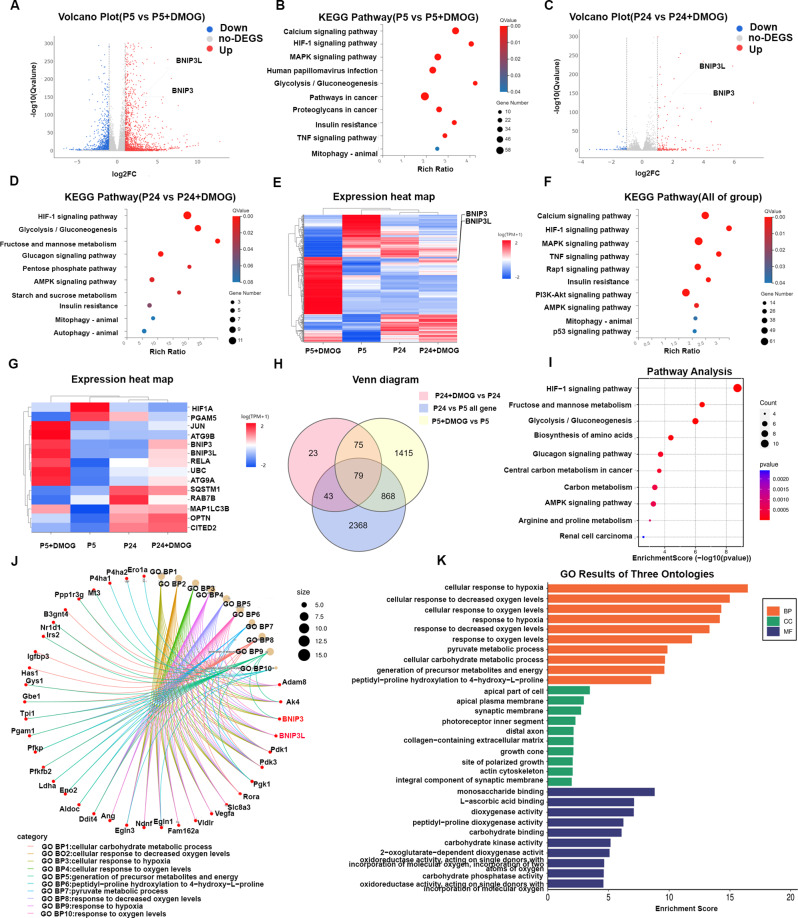
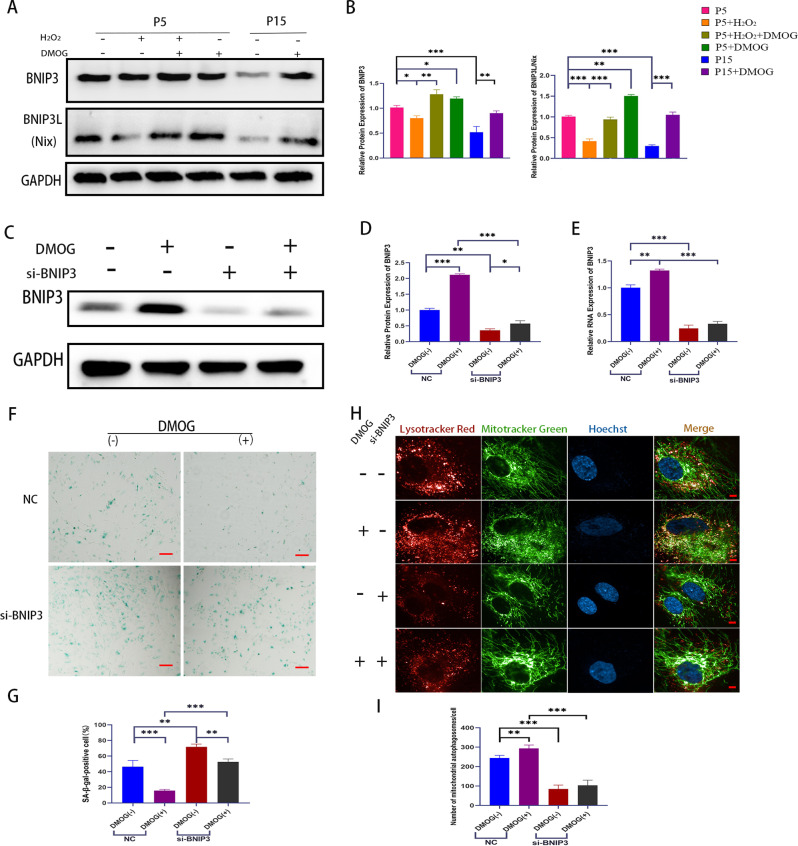
Results: DMOG treatment significantly reduced key senescence markers, including senescence-associated beta-galactosidase, p53, and p21, in both senescence models. DMOG treatment restored mitochondrial morphology and function, improving mitochondrial membrane potential, reducing mitochondrial reactive oxygen species, and enhancing ATP production. DMOG also promoted mitophagy, as evidenced by increased colocalization of mitochondria with lysosomes. RNA-seq analysis revealed that DMOG activated key pathways, including HIF-1 signaling, calcium signaling, and mitophagy-related gene (BNIP3 and BNIP3L). Notably, BNIP3 knockdown greatly abolished DMOG-induced mitophagy and its anti-senescence effects. Furthermore, DMOG treatment improved metabolic flexibility by enhancing both mitochondrial respiration and glycolysis in senescent MSCs. Moreover, DMOG-treated senescent MSCs partially restored their therapeutic efficacy in an osteoarthritis model by improving extracellular matrix regulation in IL-1β-stimulated chondrocytes.

Conclusions: Short-term DMOG treatment rejuvenates senescent MSCs by enhancing mitochondrial function, promoting mitophagy via HIF-1α/BNIP3, and improving metabolic reprogramming. DMOG-treated MSCs also showed enhanced therapeutic efficacy in co-culture with IL-1β-treated chondrocytes, suggesting its potential to improve MSC-based therapies in regenerative medicine.

Keywords: BNIP3; HIF-1α; Hypoxia-Mimetic agent; Mesenchymal stem cells (MSCs); Mitophagy; Senescence.


Conflict of interest statement

Declarations. Ethical approval: The ethics Committee of Chinese PLA General Hospital in China approved the isolation of chondrocytes from articular cartilage samples (Beijing, China). (1) Title of the approved project: Study on the treatment of cartilage cell mitochondrial damage in aging MSCs through hypoxic preconditioning. (2) Name of the institutional approval committee or unit: The Clinical Trial Ethics Committee of the Fourth Medical Center of the PLA General Hospital. 3.Approval number: 2024KY0132-KS001. 4. Date of approval: October 8, 2024. Consent for publication: Not applicable. Declaration of AI assisted copy editing in the writing process: During the preparation of this work the author(s) used ChatGPT to improve the language. After using this tool, the authors reviewed and edited the content as required and took full responsibility for the content of the publication. Competing of interest: The authors declare that they have no competing interests.

Figures

Fig. 1
Fig. 1
Short-term DMOG treatment reduces MSC senescence by activating HIF-1α and decreasing apoptosis. (A, B) Representative images of SA-β-gal staining showing the proportion of senescent cells in H₂O₂-treated MSCs before and after DMOG treatment. Scale bar = 500 μm. (C) Western blot analysis of p53 and p21 protein expression during oxidative stress-induced senescence. (D, E) SA-β-gal staining in replicative senescence (P15) MSCs, demonstrating the effect of DMOG in reducing senescence markers. Scale bar = 500 μm. (F) Western blot analysis of p53 and p21 protein levels in P5 (young) and P15 (senescent) MSCs. (G) Expression levels of senescence-associated genes (IL6, CXCL1, and MMP3) in both senescence models as assessed by qRT-PCR. (H) Western blotting and qPCR analysis showing increased HIF-1α protein and mRNA levels in both senescence models after DMOG treatment. (I) Calcein/PI live-dead staining revealed an increase in the proportion of live cells following DMOG treatment in both senescence models. (J, K) Flow cytometric analysis of apoptosis. Error bars represent the mean ± SD of three independent experiments. Statistical significance was set as p < 0.05. Full-length blots are presented in Supplementary Materials - WB Raw Data
Fig. 2
Fig. 2
Short-term DMOG treatment restores mitochondrial morphology and reduces damage in aged MSCs. (A) Representative fluorescence microscopy images of mitochondria labeled with Mitotracker Green in senescent MSCs (induced by oxidative stress or replicative aging) after DMOG treatment. The second row shows the mitochondrial morphology after software processing. Scale bar = 20 μm. The locally enlarged portion of this is a typical region that reflects the mitochondrial morphology of the group. (B, C) Quantitative analysis of mitochondrial morphological parameters (length, diameter, circularity, and density) s. (D) Transmission electron microscopy (TEM) images of the mitochondrial ultrastructure in aged MSCs. (Red box: mitochondrial autophagosomes; yellow arrow: dividing mitochondria; blue arrow: damaged and swollen mitochondria). (E) Quantitative TEM analysis showing reduced mitochondrial damage and restored structural integrity after DMOG treatment. Error bars represent the mean ± SD from three independent experiments. Statistical significance was set at p < 0.05
Fig. 3
Fig. 3
DMOG treatment ameliorates mitochondrial dysfunction and enhances mitophagy and ATP production in aged MSCs. (A) Representative JC-1 fluorescence images showing mitochondrial membrane potential in different groups: CCCP (positive control for mitochondrial depolarization), P5 MSCs, P5 + H₂O₂-treated MSCs, P5 + H₂O₂+DMOG-treated MSCs, P15 MSCs, and P15 + DMOG-treated MSCs. JC-1 red fluorescence indicates high mitochondrial membrane potential, whereas green fluorescence indicates depolarized mitochondria. Scale bar = 100 μm. (B) Representative MitoSox Red fluorescence images showing mitochondrial ROS levels in different treatment groups. Scale bar = 10 μm. (C, D) Quantitative analysis of the mitochondrial membrane potential (C) and mitochondrial ROS levels (D). (E) Western blot analysis showing the expression levels of mitophagy-related proteins (MFN1, MFN2, and Fis1) in P5 and P15 MSCs with or without H₂O₂ and DMOG treatment. GAPDH was used as a loading control. (F) Representative confocal images of co-staining with LysoTracker Red (lysosomes) and MitoTracker Green (mitochondria) in MSCs under different conditions. Scale bar = 10 μm. (G) Quantitative analysis of the number of mitophagosomes per cell in the different groups. (H) Quantitative analysis of ATP production per cell in the different groups. Data are expressed as the mean ± SEM (n = 3). *p < 0.05, **p < 0.01. ***p < 0.001. Full-length blots are presented in Supplementary Materials - WB Raw Data
Fig. 4
Fig. 4
DMOG treatment improves mitochondrial respiration and glycolytic function in senescent MSCs. (A) Oxygen consumption rate (OCR) profiles representing mitochondrial respiration in MSCs under various conditions. (B) Quantitative analysis of mitochondrial respiration parameters, including baseline respiration, ATP production, and maximal respiratory capacity of MSCs. (C) Extracellular acidification rate (ECAR) profiles representing the glycolytic function in MSCs under various conditions. (D) Quantitative analysis of glycolytic parameters, including glycolysis, glycolytic capacity, and glycolytic reserves. Data are expressed as the mean ± SEM (n = 3). *p < 0.05, **p < 0.01, ***p < 0.001
Fig. 5
Fig. 5
DMOG treatment activates hypoxia- and mitophagy-related pathways in aged MSCs. (A, C) Volcano plots of differentially expressed genes (DEGs) in P5 (A) and P24 (C) MSCs after DMOG treatment. Key mitophagy-related genes, BNIP3 and BNIP3L, were consistently upregulated in both groups. (B, D) KEGG pathway enrichment analysis in P5 (B) and P24 (D) MSCs showing that DMOG activated HIF-1 signaling, glycolysis/gluconeogenesis, and mitophagy-related pathways in both young and aged MSCs. (E) Heatmap of DEGs in the P5, P5 + DMOG, P24, and P24 + DMOG groups. Each group has three biological replicates. (F) KEGG pathway analysis of all groups highlights the key pathways activated by DMOG, including HIF-1 signaling and glycolysis. (G) Heatmap showing the expression levels of key mitophagy-related genes (e.g., BNIP3, BNIP3L, HIF-1 A) upregulated by DMOG treatment. (H) Venn diagram illustrating the shared and unique DEGs across comparisons. A total of 79 genes were co-regulated by DMOG in both P5 and P24 MSCs. (I-K) GO and pathway analyses of co-regulated genes revealed enrichment in hypoxia response, glycolysis, and other metabolic processes
Fig. 6
Fig. 6
DMOG rejuvenates senescent MSCs through BNIP3-dependent mitophagy. (A, B) Western blot analysis (A) and quantification (B) showing the expression of mitophagy-related proteins BNIP3 and BNIP3L in P5, P15, and H₂O₂-treated P5 MSCs with or without DMOG treatment. (C, D) Western blot analysis (C) and quantification (D) of BNIP3 expression in P15 MSCs after BNIP3 knockdown with siRNA. (E) Real-time PCR analysis of BNIP3 expression in P15 MSCs with or without DMOG treatment and BNIP3 knockdown. (F, G) SA-β-gal staining (F) and quantification (G) showing the percentage of senescent cells in P15 MSCs. Scale bar = 500 μm. (H, I) Confocal images (H) and quantification (I) of colocalization between mitochondria (Mitotracker Green) and lysosomes (Lysotracker Red) in P15 MSCs. Scale bar = 10 μm. Data are expressed as mean ± SEM (n = 3). **p < 0.01, ***p < 0.001. Full-length blots are presented in Supplementary Materials - WB Raw Data
Fig. 7
Fig. 7
DMOG enhances the therapeutic potential of senescent MSCs to mitigate metabolic dysfunction in OA chondrocytes. (A) Schematic diagram of the co-culture system. Human articular chondrocytes were treated with IL-1β to induce OA-like conditions and co-cultured with MSCs from various experimental groups using a Transwell system. (B) Representative immunofluorescence staining of ECM-related proteins, including Collagen II (Col2a1), Aggrecan (AGC), and MMP13, in OA chondrocytes co-cultured with MSCs from different experimental groups. Scale bar = 50 μm. (C) Quantitative analysis of immunofluorescence intensity for Col2a1, AGC, and MMP13. (D) Quantitative real-time PCR (qRT-PCR) analysis of mRNA levels for Col2a1, AGC, and MMP13 in OA chondrocytes co-cultured with MSCs. Data are expressed as mean ± SEM (n = 3). *p < 0.05, **p < 0.01, ***p < 0.001

Similar articles

References

    1. Swain HN, Boyce PD, Bromet BA, Barozinksy K, Hance L, Shields D, Olbricht GR, Semon JA. Mesenchymal stem cells in autoimmune disease: A systematic review and meta-analysis of pre-clinical studies. Biochimie. 2024;223:54–73. - PubMed
    1. Wang G, Xing D, Liu W, Zhu Y, Liu H, Yan L, Fan K, Liu P, Yu B, Li JJ, Wang B. Preclinical studies and clinical trials on mesenchymal stem cell therapy for knee osteoarthritis: A systematic review on models and cell doses. Int J Rheum Dis. 2022;25:532–62. - PubMed
    1. Fraile M, Eiro N, Costa LA, Martin A, Vizoso FJ. (2022) Aging and Mesenchymal Stem Cells: Basic Concepts, Challenges and Strategies. Biology (Basel). 11. - PMC - PubMed
    1. Liu J, Ding Y, Liu Z, Liang X. Senescence in mesenchymal stem cells: functional alterations, molecular mechanisms, and rejuvenation strategies. Front Cell Dev Biol. 2020;8:258. - PMC - PubMed
    1. Kretlow JD, Jin YQ, Liu W, Zhang WJ, Hong TH, Zhou G, Baggett LS, Mikos AG, Cao Y. Donor age and cell passage affects differentiation potential of murine bone marrow-derived stem cells. BMC Cell Biol. 2008;9:60. - PMC - PubMed

MeSH terms

LinkOut - more resources