. 2025 Jun 3;14(1):27.
doi: 10.1186/s40035-025-00486-5.

A genome-wide RNA interference screening reveals protectiveness of SNX5 knockdown in a Parkinson's disease cell model

Affiliations

A genome-wide RNA interference screening reveals protectiveness of SNX5 knockdown in a Parkinson's disease cell model

Matthias Höllerhage et al. Transl Neurodegener. .

Abstract

Background: Alpha-synuclein (αSyn) is a major player in the pathophysiology of synucleinopathies, which include Parkinson's disease, dementia with Lewy bodies, and multiple system atrophy. To date, there is no disease-modifying therapy available for these synucleinopathies. Furthermore, the intracellular mechanisms by which αSyn confers toxicity are not yet fully understood. Therefore, it is of utmost importance to investigate the pathophysiology of αSyn-induced toxicity in order to identify novel molecular targets for the development of disease-modifying therapies.

Methods: We performed the first genome-wide siRNA modifier screening in a human postmitotic neuronal cell model using αSyn-induced toxicity as a read-out. In a multi-step approach, we identified several genes, whose knockdown protected against αSyn-induced toxicity. The main hit was further validated by different methods, including immunofluorescence microscopy, qPCR, and Western blot. Furthermore, the main finding was confirmed in mouse primary neurons.

Results: The highest protection was achieved by knockdown of SNX5, which encodes the sorting nexin 5 (SNX5) protein, a component of the retromer complex. The protective efficacy of SNX5 knockdown was confirmed with an independent siRNA system. The protective effect of SNX5 knockdown was further confirmed in primary neurons from transgenic mice, where the knockdown of SNX5 led to amelioration of decrease in synchrony that was observed in untreated and control-siRNA-treated cells. SNX5 protein is a component of the SNX-BAR (Bin/Amphiphysin/Rvs) heterodimer, which is part of the retromer complex. Extracellular αSyn and overexpression of intracellular αSyn led to fragmentation of the trans-Golgi network, which was prevented by SNX5 knockdown that led to confinement of αSyn in early endosomes.

Conclusion: In summary, our data suggest that SNX5 plays an important role in the trafficking and toxicity of αSyn. Therefore, SNX5 appears to be a target of therapeutic intervention for synucleinopathies.

Keywords: Alpha-synuclein; Genome-wide RNAi screening; Parkinson’s disease; Retromer; SNX5; Trans-Golgi network.


Conflict of interest statement

Declarations. Ethics approval and consent to participate: Not applicable. Consent for publication: Not applicable. Competing interests: All authors have no competing interests.

Figures
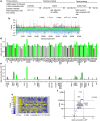
Fig. 1
Fig. 1
Genome-wide siRNA screening. a Flowchart of the screening process. Primary screening: Z-statistics (Z > 2.4 vs. library) to identify primary hits, defined as Z > 2.4 in at least 2 screening runs. Secondary screening: ANOVA analyses (vs. F-Luc as control esiRNA). Tertiary screening, final hits: multiple T-tests (compared to survival of GFP-overexpressing cells). b Z-scores of all experiments from the primary screening. Red dots: Z-scores of cells transfected with esiRNA against αSyn as positive control; green dots: Z-scores of cells transfected with esiRNA against luciferase (F-Luc) as negative control; light blue dots: Z-scores from the library; dark blue dots: Z-score > 2.4; grey dots: mock transfection. c Representative results from one screening plate. Thicker lines mark areas with controls (L: luciferase, M: mock transfection, α: αSyn transfection). d Secondary screening results: relative survival compared to the survival of controls (esiRNA against F-Luc). Green bars: increased survival (without correction for multiple testing); light green bars: hits after correction for multiple testing (Dunnett’s post-hoc test); red bars: reduced survival; light red bars: significant reduction of survival after correction for multiple testing; grey bars: no significant influence on survival. e Comparison of the survival between αSyn-overexpressing cells and GFP-expressing cells. Green bars: higher survival in αSyn-overexpressing cells with gene knockdown; light green bars: significantly higher survival after correction for multiple testing. f Volcano plot showing the relative survival of αSyn-overexpressing vs GFP-expressing cells. Lower dotted line: P-value < 0.05 in the individual t-tests; upper dotted line: P-value adjusted for multiple testing. SNX5 showed the smallest P-value of all screened genes
Fig. 2
Fig. 2
Validation of the knockdown efficacy of SNX5 siPOOL siRNAs. a Experimental timeline of the validation experiment. AV: adenovirus, DIV: days in vitro. b Quantification of SNX5 mRNA expression in control cells without αSyn overexpression and in αSyn-overexpressing cells by qPCR. Cells were transfected with siPOOL siRNA against SNX5 or a negative control siRNA, or untransfected. c Western blots for SNX5 and quantitation. The full Western blots are shown in Additional file 3. *P < 0.05, **P < 0.01 vs untransfected cells; #P < 0.05, ##P < 0.01, ###P < 0.001 vs cells transfected with a negative control siRNA
Fig. 3
Fig. 3
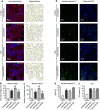
Validation of the protective efficacy of SNX5 knockdown against αSyn-induced toxicity. a Immunofluorescence images of the neuronal network with an antibody against tubulin III (red) and nuclear co-staining with DAPI (blue) of untransduced cells (no αSyn; top panel), and αSyn-overexpressing cells (αSyn) without and with siRNA transfection. Panels on the right illustrate the neuronal network identified by the ‘neurite analyzer’ plugin in Fiji. The outline of the nuclei is highlighted in yellow. b, c Quantification of the total branch length (b) and the number of quadruple points as a measure for network complexity (c). d Immunofluorescence staining for activated caspases 3/7 (green; CellEvent) and nuclear with DAPI (blue). The conditions are the same as in panel a. e Quantification of the signal of activated caspases 3/7 after normalization to the signal in untransfected AV-αSyn cells. f Quantification of LDH released into the cell culture medium as a measure for cytotoxicity at the same conditions as in a-e. *P < 0.05, **P < 0.01, ***P < 0.001, vs untransfected AV- αSyn cells; ##P < 0.01, ###P < 0.001 vs AV- αSyn cells transfected with a negative control siRNA. §P < 0.05, §§§P < 0.001 vs. untransduced cells
Fig. 4
Fig. 4
Restoration of synchrony loss in primary neurons from αSyn transgenic mice upon SNX5 knockdown. a Experimental timeline of primary neuron isolation, maturation and siPOOL application in vitro; DIV, days in vitro. b Quantification of SNX5 mRNA expression in primary neurons from the transgenic Thy1-αSyn (Line 61) mouse model. The cells were transfected with siPOOL siRNAs against SNX5 or a negative control siRNA, or untransfected. c Multiwell microelectrode array (MEA) measurement of neuronal synchrony at 18 h after application of DMSO (left side bars) or 50 µmol/L bafilomycin A1 in DMSO of the same conditions as described in panel b. The graph shows results from 1 out of 3 representative technical replicates; bars represent mean ± SEM; n.s. = not significant, *P < 0.05; Two-way ANOVA with Sidak’s post-hoc test
Fig. 5
Fig. 5
Effects of SNX5 knockdown on the expression of other retromer components. a Schematic illustration of the retromer complex. The SNX-BAR heterodimers are composed of SNX1 (blue arches) or SNX2 (black arches) in combination with SNX5 (orange arches) or SNX6 (green arches). b Representative Western blots of other retromer components VPS35, SNX1, SNX2, and SNX6 in AV-αSyn cells and no-AV cells. The cells were either untransfected or transfected with siRNA against SNX5 (SNX5 siRNA) or negative control siRNA (neg ctrl). Full Western blots are shown in Additional file 3: Fig. S6 b-e. c-f Quantification of the Western blot bands. Neither αSyn overexpression nor SNX5 knockdown (SNX5 siRNA) significantly altered the protein levels of the retromer components VPS35, SNX1, SNX2, and SNX6. Data are shown as mean ± SEM. n.s.: not significant, one-way ANOVA with Tukey’s post-hoc test
Fig. 6
Fig. 6
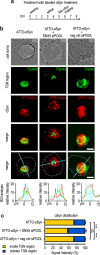
SNX5 knockdown prevents internalization and accumulation of exogenous αSyn into the trans-Golgi network. a Experimental timeline of the treatment with fluorescently labelled αSyn. DIV, days in vitro. b Immunofluorescence staining of TGN46 (green) in cells treated with ATTO-565-labelled -αSyn (red). The turquoise lines indicate the location of intensity measurement. Lower panels: The turquoise area in the fluorescence intensity profiles indicate the outer margins of the TGN region, as defined by the TGN46 staining. The red line indicates the location of αSyn, both inside and outside of the TGN. After SNX5 knockdown, αSyn was distributed outside the TGN as indicated by the red intensity signal (images in the middle), which was not the case with the negative control siRNA (right side images). Scale bar, 4 μm. c Quantification of the proportion of ATTO-αSyn inside and outside of the TGN region in the conditions shown in b. ***P < 0.001, ANOVA with Tukey’s post-hoc test. n.s. not significant
Fig. 7
Fig. 7
SNX5 knockdown prevents TGN scattering and fragmentation in LUHMES cells. a Images of normal, scattered, and fragmented TGN morphology in LUHMES cells treated with ATTO-565-labeled recombinant αSyn monomers. Below are sketches of TGN morphology. All these morphologies were observed in αSyn-treated cells, but at varying degrees. b Images of normal, scattered, and fragmented TGN morphology in LUHMES cells transduced with αSyn-overexpressing adenoviral vectors (AV). Below are sketches of TGN morphology. c Representative images of staining for TGN46 in untreated cells, ATTO-αSyn-treated cells with no transfection, ATTO-αSyn-treated cells with SNX5 siRNA transfection, and ATTO-αSyn-treated cells with negative control (neg ctrl) siRNA transfection. The arrows indicate the different states of TGN morphology as illustrated in a. White arrows, normal morphology; yellow arrows, scattered morphology; purple arrows, fragmented morphology. A version of this panel that includes red staining of αSyn is shown in Fig. S5. d Representative images of staining for TGN46 in control cells (ctrl), AV-GFP cells, AV-αSyn cells, and AV-αSyn cells transfected with SNX5 siRNA or negative control (neg ctrl) siRNA. e Percentage of cells with normal (grey), scattered (yellow), or fragmented (purple) TGN morphology in the experimental conditions of c and d. Exogenous αSyn (left) as well as adenoviral overexpressed αSyn (right) led to a higher percentage of scattered or fragmented TGNs, which was ameliorated by SNX5 knockdown. The percentage of abnormal TGN (scattered or fragmented) was subtracted from 100% resulting in values for normal TGN. These were compared using ANOVA with Tukey's post-hoc test. f Quantification of the TGN diameter of normal and scattered TGN. Both exogenous αSyn (ATTO- αSyn) and adenoviral overexpressed αSyn (AV-αSyn) led to larger TGN sizes. ***P < 0.001. ANOVA with Tukey's post-hoc test. n.s. not significant
Fig. 8
Fig. 8
Co-localization of internalized αSyn with endocytosis markers. a Representative images of LUHMES cells treated with fluorescently labeled αSyn (ATTO-αSyn, red) with control siRNA transfection (top row of images), or after knockdown of SNX5 (buttom row of images). A selected region of each image (white square) is shown in higher magnification in the right bottom corner. Scale bars: 4 µm. b Quantification of co-localization of exogenous αSyn with endocytosis markers. SNX5 knockdown led to increased co-localization between αSyn and early endosomes (Rba5a), late endosomes (Rab7, LAMP1), and lysosomes (LAMP2 A) compared to untransfected cells.Data are presented as mean ± SEM. *P < 0.05, **P < 0.01, ***P < 0.001 vs ATTO- αSyn, #P < 0.05, ##P < 0.01, ###P < 0.001 vs ATTO- αSyn + SNX5 siRNA; n.s. not significant; one-way ANOVA with Tukey's post-hoc test
Fig. 9
Fig. 9
Transportation of αSyn before and after knockdown of SNX5. a, b Schematic illustration of possible endocytic pathways and the markers of different compartments used in our study (green). After endocytosis from the extracellular space, αSyn is transported into early endosomes (yellow; Rab5a). The early endosomes then either transport αSyn back to the plasma membrane (endosome to PM) in the form of recycling endosomes (Rab11), or to the trans-Golgi network (TGN; TGN46; endosome to TGN), or they form late endosomes (Rab7, LAMP1) to either transport αSyn directly to lysosomes (LAMP2a; endosome to lysosome) or first to autophagosomes (p62, LC3B) and then to lysosomes (autophagosome to lysosome). Before SNX5 knockdown, more αSyn is transported to the TGN, while after SNX5 knockdown less αSyn is transported to the TGN, but more to the early and late endosomes

References

    1. Goedert M, Spillantini MG, Del Tredici K, Braak H. 100 years of Lewy pathology. Nat Rev Neurol. 2013;9(1):13–24. - PubMed
    1. Fanciulli A, Stankovic I, Krismer F, Seppi K, Levin J, Wenning GK. Multiple system atrophy. Int Rev Neurobiol. 2019;149:137–92. - PubMed
    1. Tofaris GK. Initiation and progression of α-synuclein pathology in Parkinson’s disease. Cell Mol Life Sci. 2022;79(4):210. - PMC - PubMed
    1. Burré J, Sharma M, Südhof TC. Cell biology and pathophysiology of α-synuclein. Cold Spring Harb Perspect Med. 2018;8(3):a024091. - PMC - PubMed
    1. Lotharius J, Falsig J, van Beek J, Payne S, Dringen R, Brundin P, et al. Progressive degeneration of human mesencephalic neuron-derived cells triggered by dopamine-dependent oxidative stress is dependent on the mixed-lineage kinase pathway. J Neurosci. 2005;25(27):6329–42. - PMC - PubMed

LinkOut - more resources