. 2025 Jun;31(6):e70449.
doi: 10.1111/cns.70449.

Differentiation Defect Into GABAergic Neurons in Cerebral Organoids From Autism Patients

Affiliations

Differentiation Defect Into GABAergic Neurons in Cerebral Organoids From Autism Patients

Sai Hali et al. CNS Neurosci Ther. 2025 Jun.

Abstract

Objectives: Autism spectrum disorder (ASD) is a neurodevelopmental condition that affects social communication and behaviors. While previous studies using animal models have substantially expanded our knowledge about ASD, the lack of an appropriate human model system that accurately recapitulates the human-specific pathophysiology of ASD hinders the precise understanding of its etiology and the development of effective therapies. This study aims to replicate pathological phenotypes in cerebral organoids derived from idiopathic ASD patients and to conduct proof-of-concept research for the development of ASD therapeutics.

Methods: We conducted an in vitro disease modeling study using cerebral organoids derived from three idiopathic ASD patients. Additionally, we performed organoid-based phenotypic drug screening to identify potential therapeutic compounds that could ameliorate the phenotypes observed in cerebral organoids derived from idiopathic ASD patients.

Results: Here we show that cerebral organoids derived from idiopathic ASD patients display malformation of the ventricular zones and impaired early neuronal differentiation. Through organoid-based phenotypic drug screening, we successfully generated cerebral organoids with normal tissue architecture in which the delayed neuronal differentiation could also be accelerated. Notably, cerebral organoids from ASD patients exhibited a reduced number of GABAergic neurons compared to healthy controls, resulting in an imbalance in the excitatory and inhibitory neuron ratio. The differentiation defects into GABAergic neurons in patient-derived cerebral organoids could be rescued by treating with either IGF1 or Gabapentin, a GABA agonist.

Conclusions: Our findings provide a framework for utilizing patient-derived cerebral organoids in the development of personalized pharmaceutical treatment for ASD.

Keywords: autism spectrum disorder; cerebral organoids; disease modeling; drug screening.


Conflict of interest statement

The authors declare no conflicts of interest.

Figures

FIGURE 1
FIGURE 1
Generation of COs from hPSCs. (A) Schematic illustration of the procedure for generating COs. The procedures and timelines for generating COs are described. (B, C, D, E) Confocal images of COs showing expression patterns of SOX2/TUJ1 (B), PAX6/FOXG1 (C), Ki67/PAX6 (D), and SYN1/MAP2 (E). (F) Confocal image showing the co‐localization of SYP and PSD95 in COs. (G, H, I) Confocal images of COs showing expression patterns of GLUT/GABA (G), GFAP/MAP2 (H), and MBP/MAP2 (I). Scale bars represent 100 μm. COs, Cerebral organoids.
FIGURE 2
FIGURE 2
Pluripotency of hiPSC lines from idiopathic ASD patients and family controls. (A) Morphology of hiPSC lines. (B) Expression of pluripotency markers in hiPSC lines. (C, D) In vitro (C) and in vivo (D) differentiation potentials of hiPSC lines into three germ layers. Scale bars represent 100 μm.
FIGURE 3
FIGURE 3
Malformation of ventricular zones in ASD organoids. (A) Representative bright field images of COcontrol and COASD at day 15. (B) Average basal membrane lengths of COcontrol and COASD at day 15 (p = 3.36 x 10−6). (C, D) Confocal images (C) and average numbers (D) of Ki67+ proliferating progenitor cells in VZ of COcontrol and COASD at day 15 (p = 3.77 x 10−3). (E, F) Confocal images (E) and average numbers (F) of TUJ1+ neurons in COcontrol and COASD at day 15 (p = 1.5 x 10−4). (G) Gene ontological analysis of differentially expressed genes between COcontrol and COASD at day 15. A Total of 15 COs Per Group Were Subjected to RNAseq Analysis. Scale bars represent 100 μm. Data are presented as mean ± SD from three independent experiments. COASD, COs from ASD hiPSC lines; COControl, COs from control hiPSC lines.
FIGURE 4
FIGURE 4
Small molecules rescue macrocephaly‐like phenotypes. (A) Illustration explaining geometric analysis measuring both apical and basal membrane lengths of the rosette, loop diameter of the rosette, total rosette area, rosette ventricle area, and rosette tissue area. (B) The effects of small‐molecule treatment were evaluated. (C) Confocal images showing expression patterns of SOX2/TUJ1 in small molecule‐treated COASD. COcontrol and COASD were used as controls. (D) Average fluorescence intensity of the TUJ1 signal in small molecule‐treated COASD. COcontrol and COASD were used as controls. Scale bars represent 100 μm. Data are presented as mean ± SD from three independent experiments. *p < 0.05, **p < 0.01, ***p < 0.001. COASD, COs from ASD hiPSC lines; COControl, COs from control hiPSC lines.
FIGURE 5
FIGURE 5
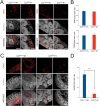
Differentiation defect into GABAergic neurons in patient‐derived COs. (A) Confocal images showing the expression pattern of TBR1 and TBR2 in COcontrol and COASD at day 45. (B) Average numbers of neurons expressing TBR1 or TBR2 in COcontrol and COASD at day 45. (C) Confocal images showing the expression pattern of GABA in COcontrol and COASD at day 45. (D) Average number of neurons expressing GABA in COcontrol and COASD at day 45 (p = 1.75x10⁻¹⁰). Scale bars represent 100 μm. Data are presented as mean ± SD from three independent experiments. COASD, COs from ASD hiPSC lines; COControl, COs from control hiPSC lines.
FIGURE 6
FIGURE 6
Drugs rescue the differentiation defect of GABAergic neurons in patient‐derived COs. (A) Confocal images showing GABA‐expressing neurons in drug‐treated COASD. COcontrol and COASD were used as controls. (B) Average number of GABA‐expressing neurons in drug‐treated COASD. COcontrol and COASD were used as controls. Scale bars represent 100 μm. Data are presented as mean ± SD from three independent experiments. **p < 0.01, ***p < 0.001. COASD, COs from ASD hiPSC lines; COControl, COs from control hiPSC lines; GBP, Gabapentin; GNZL, Ganaxolone; RTGB, Retigabine; TGB, Tiagabine hydrochloride; VGBT, Vigabatrin.

References

    1. AlSalehi S. M. and Alhifthy E. H., “Autism Spectrum Disorder. Clinical Child ,” Neurology (2020): 275–292.
    1. de la Torre‐Ubieta L., Won H., Stein J. L., and Geschwind D. H., “Advancing the Understanding of Autism Disease Mechanisms Through Genetics,” Nature Medicine 22, no. 4 (2016): 345–361. - PMC - PubMed
    1. Kaiser T. and Feng G., “Modeling Psychiatric Disorders for Developing Effective Treatments,” Nature Medicine 21, no. 9 (2015): 979–988. - PMC - PubMed
    1. Marshall J. J. and Mason J. O., “Mouse vs. Man: Organoid Models of Brain Development & Disease,” Brain Research 1724 (2019): 146427. - PubMed
    1. Nestler E. J. and Hyman S. E., “Animal Models of Neuropsychiatric Disorders,” Nature Neuroscience 13, no. 10 (2010): 1161–1169. - PMC - PubMed