

Comparison of Deep Learning Models for Objective Auditory Brainstem Response Detection: A Multicenter Validation Study
- PMID: 40457875
- PMCID: PMC12134522
- DOI: 10.1177/23312165251347773
Comparison of Deep Learning Models for Objective Auditory Brainstem Response Detection: A Multicenter Validation Study
Abstract
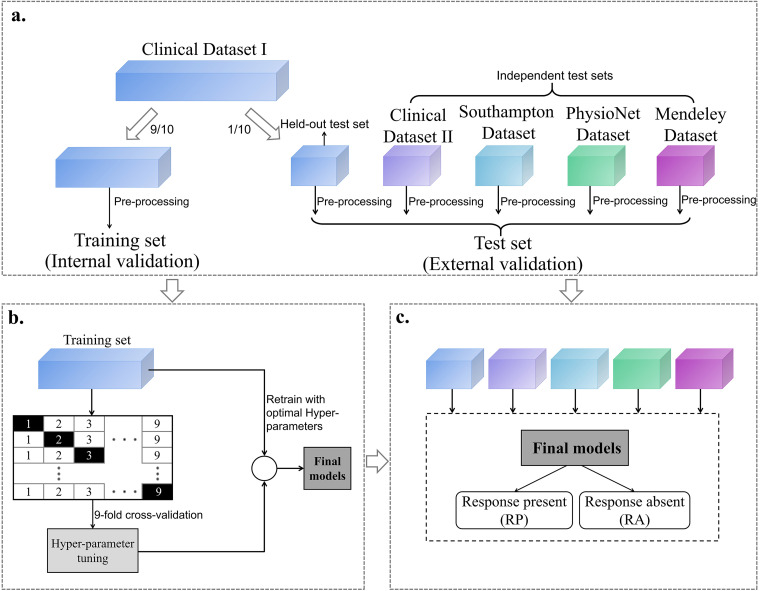
Auditory brainstem response (ABR) interpretation in clinical practice often relies on visual inspection by audiologists, which is prone to inter-practitioner variability. While deep learning (DL) algorithms have shown promise in objectifying ABR detection in controlled settings, their applicability to real-world clinical data is hindered by small datasets and insufficient heterogeneity. This study evaluates the generalizability of nine DL models for ABR detection using large, multicenter datasets. The primary dataset analyzed, Clinical Dataset I, comprises 128,123 labeled ABRs from 13,813 participants across a wide range of ages and hearing levels, and was divided into a training set (90%) and a held-out test set (10%). The models included convolutional neural networks (CNNs; AlexNet, VGG, ResNet), transformer-based architectures (Transformer, Patch Time Series Transformer [PatchTST], Differential Transformer, and Differential PatchTST), and hybrid CNN-transformer models (ResTransformer, ResPatchTST). Performance was assessed on the held-out test set and four external datasets (Clinical II, Southampton, PhysioNet, Mendeley) using accuracy and area under the receiver operating characteristic curve (AUC). ResPatchTST achieved the highest performance on the held-out test set (accuracy: 91.90%, AUC: 0.976). Transformer-based models, particularly PatchTST, showed superior generalization to external datasets, maintaining robust accuracy across diverse clinical settings. Additional experiments highlighted the critical role of dataset size and diversity in enhancing model robustness. We also observed that incorporating acquisition parameters and demographic features as auxiliary inputs yielded performance gains in cross-center generalization. These findings underscore the potential of DL models-especially transformer-based architectures-for accurate and generalizable ABR detection, and highlight the necessity of large, diverse datasets in developing clinically reliable systems.
Keywords: auditory brainstem response; deep learning; generalizability; multicenter validation; objective detection.
Conflict of interest statement
Declaration of Conflicting InterestsThe authors declared no potential conflicts of interest with respect to the research, authorship, and/or publication of this article.
Figures


Similar articles
-
Derivative-Guided Dual-Attention Mechanisms in Patch Transformer for Efficient Automated Recognition of Auditory Brainstem Response Latency.IEEE Trans Neural Syst Rehabil Eng. 2025;33:1863-1875. doi: 10.1109/TNSRE.2025.3558730. Epub 2025 May 15. IEEE Trans Neural Syst Rehabil Eng. 2025. PMID: 40198282
-
MABAL: a Novel Deep-Learning Architecture for Machine-Assisted Bone Age Labeling.J Digit Imaging. 2018 Aug;31(4):513-519. doi: 10.1007/s10278-018-0053-3. J Digit Imaging. 2018. PMID: 29404850 Free PMC article.
-
Automatic Recognition of Auditory Brainstem Response Waveforms Using a Deep Learning-Based Framework.Otolaryngol Head Neck Surg. 2024 Oct;171(4):1165-1171. doi: 10.1002/ohn.840. Epub 2024 Jun 1. Otolaryngol Head Neck Surg. 2024. PMID: 38822760
-
Breast Cancer Detection Using Convolutional Neural Networks: A Deep Learning-Based Approach.Cureus. 2025 May 3;17(5):e83421. doi: 10.7759/cureus.83421. eCollection 2025 May. Cureus. 2025. PMID: 40322605 Free PMC article. Review.
-
Advancements in Hematologic Malignancy Detection: A Comprehensive Survey of Methodologies and Emerging Trends.ScientificWorldJournal. 2025 May 18;2025:1671766. doi: 10.1155/tswj/1671766. eCollection 2025. ScientificWorldJournal. 2025. PMID: 40421320 Free PMC article. Review.
References
-
- Acır N., Özdamar Ö, Güzeliş C. (2006). Automatic classification of auditory brainstem responses using SVM-based feature selection algorithm for threshold detection. Engineering Applications of Artificial Intelligence, 19(2), 209–218. httpsss://doi.org/http://doi.org/10.1016/j.engappai.2005.08.004
-
- Alpsan D. (1991). Classification of auditory brainstem responses by human experts and backipropagation neural networks. In Paper presented at the Proceedings of the Annual International Conference of the IEEE Engineering in Medicine and Biology Society 13: 1991.
-
- Ballachanda B. B., Moushegian G., Stillman R. D. (1992). Adaptation of the auditory brainstem response: Effects of click intensity, polarity, and position. Journal of the American Academy of Audiology, 3(4), 275–282. - PubMed
Publication types
MeSH terms
LinkOut - more resources
Full Text Sources
