. 2025 May 15;9(7):bvaf090.
doi: 10.1210/jendso/bvaf090. eCollection 2025 Jul.

Inflammation Promotes Proteolytic Processing of the Prohormone Chromogranin A by Macrophages

Affiliations

Inflammation Promotes Proteolytic Processing of the Prohormone Chromogranin A by Macrophages

Melina Ioannidis et al. J Endocr Soc. .

Abstract

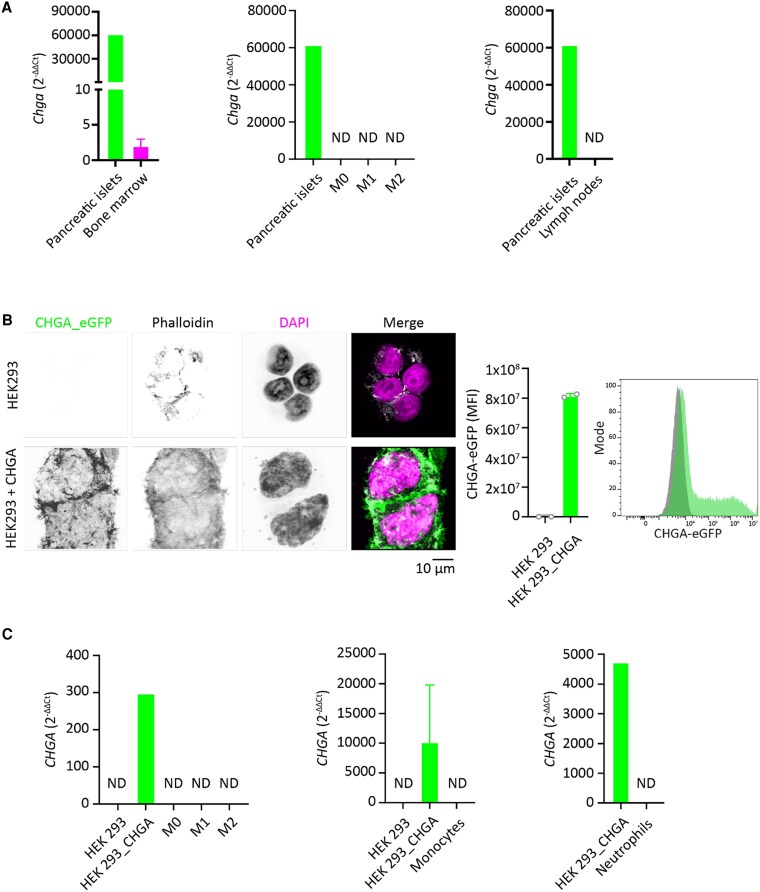
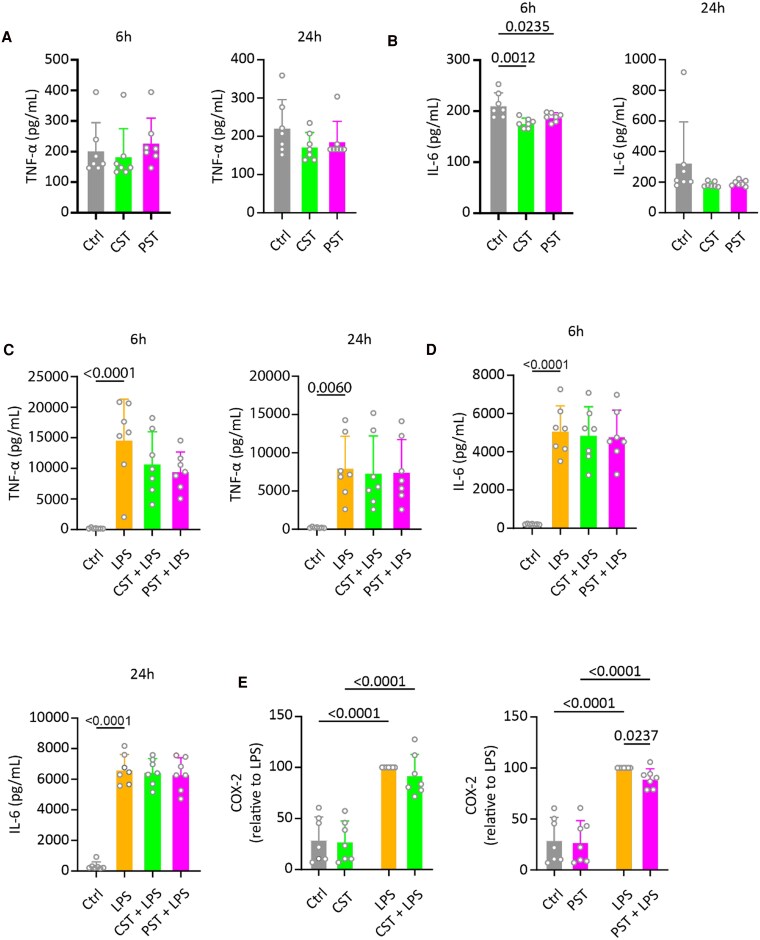
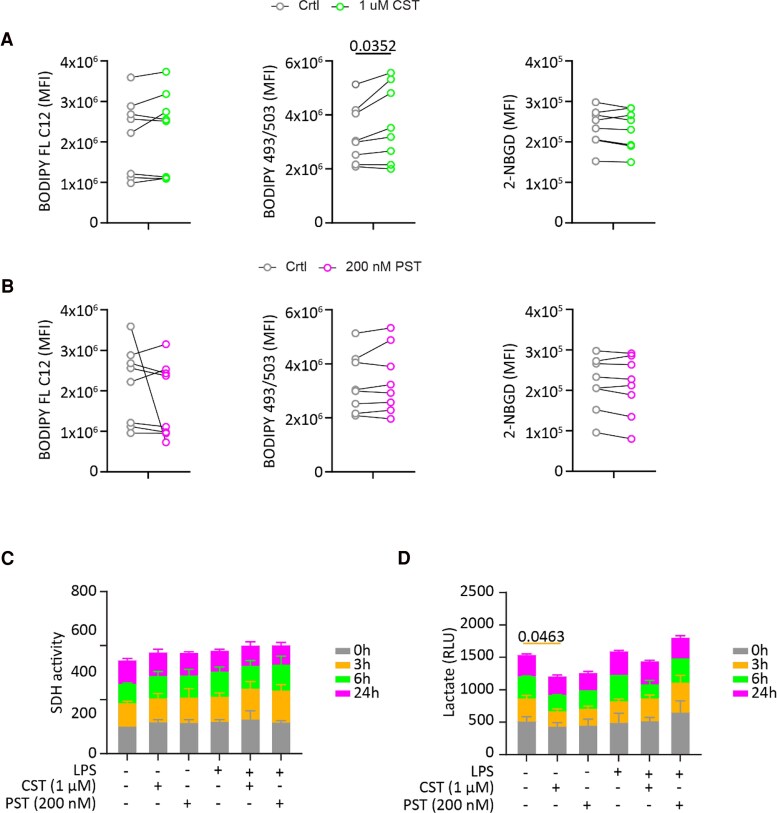
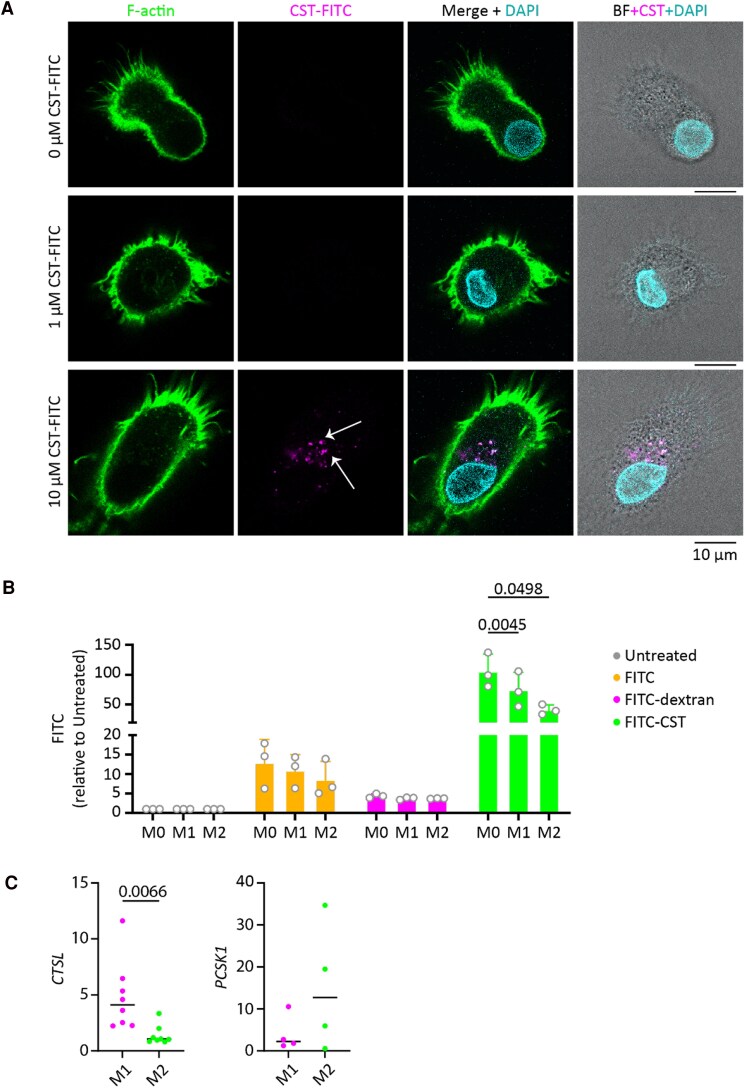
Chromogranin A (CgA), a 439-amino acid-long protein produced by neuroendocrine cells, is critical in health and disease. Through proteolytic processing, CgA is transformed into several bioactive peptides. These peptides, as well as CgA, have been implicated in various pathological conditions. Interestingly, CgA-derived peptides have opposing effects, such as catestatin (CST) and pancreastatin (PST), which have contrasting immunomodulatory properties. PST promotes a proinflammatory response, increasing the production of proinflammatory cytokines, whereas CST reduces proinflammatory and increases anti-inflammatory cytokines in mice. However, how CgA and CgA-derived peptides regulate the immune response is unknown, and most of our knowledge is based on mouse studies. Since multiple studies suggest that CgA and CgA-derived peptides influence macrophages, we aimed to investigate the interaction between CgA and human monocyte-derived macrophages. Therefore, we tested whether human macrophages produce CgA, are affected by CST and PST, and/or produce CST and PST. We found that human monocyte-derived macrophages and other immune cells do not produce CgA, and CST and PST have only minor effects on cytokine production and immune metabolism. However, proteases involved in the cleavage of CgA are differentially expressed in macrophages depending on their inflammatory phenotype, suggesting that CgA is increasingly converted into CST and PST in inflammatory conditions. As levels of CgA and its cleavage products CST and PST are associated with human diseases, it is essential to understand how they influence the immune response.

Keywords: chromogranin A; inflammation; macrophages; proteolytic processing.


Figures

Figure 1.
Figure 1.
Expression of Chga/CHGA in mouse and human immune cells. A, Chga expression in bone marrow (n = 3), bone marrow-derived naive (M0) (n = 3), proinflammatory (M1; LPS + IFN-γ), and anti-inflammatory (M2; interleukin-4 [IL-4]) (n = 4) macrophages and lymph nodes (n = 2) of wild-type C57BL/6 mice. Pancreatic islet cells were used as a positive control. B, As a positive control for human CHGA expression, HEK293 cells were transfected with a construct coding for GFP-tagged chromogranin A (CgA). Results of transfection are validated by microscopy (left) and flow cytometry (right). Each data point represents one experiment (n = 2). C, CHGA expression in naive (M0), proinflammatory (M1; LPS and IFN-γ), and anti-inflammatory (M2; IL-4) human monocyte-derived macrophages (n = 4), neutrophils (n = 3), and monocytes (n = 3). Averages shown; error bars display the SEM.
Figure 2.
Figure 2.
Catestatin (CST) and pancreastatin (PST) inhibit interleukin-6 (IL-6) production; PST also reduces COX2 production. A, Tumor necrosis factor α (TNF-α) and B, IL-6 production of human monocyte-derived macrophages measured after 6 hours’ and 24 hours’ treatment with CST (1 μM) or PST (200 nM). C, TNF-α and D, IL-6 production as in panels A and B, but now in the presence of lipopolysaccharide (LPS) (100 ng/mL). Each data point represents one donor (n = 7); error bars display the SEM. Data were analyzed with 1-way analysis of variance (ANOVA); P value is displayed in case of statistical significance (P < .05). E, COX-2 expression after treatment with CST or PST in the presence or absence of LPS. Each data point represents one donor (n = 7); error bars display the SEM. Data were analyzed with 2-way ANOVA. P value is displayed in case of statistical significance (P < .05).
Figure 3.
Figure 3.
Catestatin (CST) promotes fat storage and lowers lactate production in human macrophages. Macrophages were treated with A, CST (1 μM) and B, pancreastatin (PST) (200 nM). Fat uptake was measured using BODIPY-FL C12. Fat storage was determined using BODIPY 493/53. Glucose uptake was inferred with 2-NBGD. Data display the mean fluorescence intensity. Each connected pair of data points represents one donor; data were analyzed with paired t tests, and the value displays the P value if statistically significant (P < .05). C, The effect of PST (200 nM) and CST (1 μM) on SDH activity (complex II) in both LPS-treated (100 ng/mL) and untreated macrophages at the indicated time points. The bar graph represents the mean ± SEM for n = 3 donors, with data normalized to the untreated condition at 0 hours. D, The effect of PST (200 nM) and CST (1 μM) on intracellular lactate levels in the presence and absence of lipopolysaccharide (LPS) (100 ng/mL) at the indicated time points. Data are presented as mean ± SEM. For C and D, 2-way analysis of variance was used for statistical analysis. The P value is displayed in case of statistical significance.
Figure 4.
Figure 4.
Macrophages ingest catestatin-fluorescein isothiocyanate (CST-FITC) and differentially express proteases involved in chromogranin A (CgA) processing. FITC-labeled CST was used to determine if human macrophages ingest CgA-derived peptides. A, Confocal microscopy images of macrophages treated with 1 µM or 10 µM CST-FITC (magenta), and labeled with phalloidin (green) and DAPI (4′,6-diamidino-2-phenylindole; blue). Scale bars, 10 μm. B, Uptake of FITC, FITC-dextran, and FITC-CST in naive (M0), proinflammatory (M1; lipopolysaccharide [LPS] + interferon-γ [IFN-γ]), and anti-inflammatory (M2; interleukin-4 [IL-4]) macrophages by flow cytometry. Each data point represents one donor (n = 3). Statistical significance was assessed using a 2-way analysis of variance. C, Expression by reverse-transcription quantitative polymerase chain reaction of genes coding for PC1/3 and cathepsin L. Human monocyte-derived macrophages were stimulated with either LPS and IFN-γ (M1) or IL-4 (M2). Each data point represents one donor, a paired t test was performed, and the value displays the P value in case of statistical significance (P < .05).
Figure 5.
Figure 5.
Förster resonance energy transfer (FRET) construct to determine proteolytic processing ofchromogranin A (CgA). A, AlphaFold-predicted structure of CgA with the pancreastatin (PST) andcatestatin (CST) regions indicated in pink and green, respectively. To determine CgA processing, 4 FRET-based probes were developed to detect proteolysis cleavage of CgA at position 351 (CST-N), 373 (CST-C), 249 (PST-N), and 301 (PST-C). B, Topology of CST-N FRET–based probe. C, The AlphaFold model shows the linker in an unstructured region. Proteolysis results in loss of FRET. D, Confirmation of FRET using acceptor photobleaching. The donor (mCitrine) was excited for 10 seconds at high light intensity. Due to donor protection, the acceptor was photobleached, whereas the donor fluorescence increased. Scale bars: 6.5 μm; white squares indicate the zoomed region.
Figure 6.
Figure 6.
Inflammation promotes proteolytic processing of chromogranin A (CgA) by macrophages. Four different Förster resonance energy transfer (FRET) constructs were used to test the ability of human monocyte-derived macrophages to cleave CgA at the N-terminal and C-terminal of the pancreastatin (PST) and catestatin (CST) regions. A, FRET ratios, defined as the sensitized emission over the donor signal, show that proinflammatory macrophages (M1) have a higher efficiency of cleavage of the FRET constructs compared to nonactivated (M0) and anti-inflammatory (M2) macrophages. Each data point represents the mean of each donor (>5 cells/donor). The data are displayed as SEM; if statistically significant, the P value is indicated (P < .05). Data were analyzed using 2-way analysis of variance. B and C, FRET signal of B, CST C-terminal and C, PST C-terminal construct in M1 vs M0 macrophages. FRET shows the sensitized emission (magenta in merge), mScarlet-I shows the acceptor fluorescence (orange), mCitrine shows the donor emission (green). FRET efficiency shows the ratio of sensitized emission over the donor emission in glow lookup table. Scale bars: 5 μm.

Similar articles

References

    1. Winkler H, Fischer-Colbrie R. The chromogranins A and B: the first 25 years and future perspectives. Neuroscience. 1992;49(3):497‐528. - PMC - PubMed
    1. Montero-Hadjadje M, Vaingankar S, Elias S, Tostivint H, Mahata SK, Anouar Y. Chromogranins A and B and secretogranin II: evolutionary and functional aspects. Acta Physiologica. 2008;192(2):309‐324. - PubMed
    1. Hosaka M, Watanabe T, Sakai Y, Uchiyama Y, Takeuchi T. Identification of a chromogranin A domain that mediates binding to secretogranin III and targeting to secretory granules in pituitary cells and pancreatic β-cells. Mol Biol Cell. 2002;13(10):3388‐3399. - PMC - PubMed
    1. Liu MA, Shahabi S, Jati S, et al. Gut microbial DNA and immune checkpoint gene Vsig4/CRIg are key antagonistic players in healthy aging and age-associated development of hypertension and diabetes. Front Endocrinol (Lausanne). 2022;13:1037465. - PMC - PubMed
    1. Muntjewerff EM, Tang K, Lutter L, et al. Chromogranin A regulates gut permeability via the antagonistic actions of its proteolytic peptides. Acta Physiologica. 2021;232(2):e13655. - PMC - PubMed