. 2025 May 19:13:1447738.
doi: 10.3389/fpubh.2025.1447738. eCollection 2025.

Evaluating the impact of large-scale nucleic acid testing and home quarantine on a novel emerging infectious disease prevention and control: a dynamic modeling approach

Affiliations

Evaluating the impact of large-scale nucleic acid testing and home quarantine on a novel emerging infectious disease prevention and control: a dynamic modeling approach

Zuiyuan Guo et al. Front Public Health. .

Abstract

Introduction: Conducting large-scale viral nucleic acid testing and isolating SARS-CoV-2-infections were crucial strategies in China, which played a key role in successfully controlling multiple waves of the Omicron epidemic. To thoroughly analyze the mechanisms and value of these measures, including testing and isolation, in epidemic prevention and control, and to provide a theoretical basis for scientific epidemic prevention and precise strategies in the face of potential future outbreaks of novel respiratory infectious diseases.

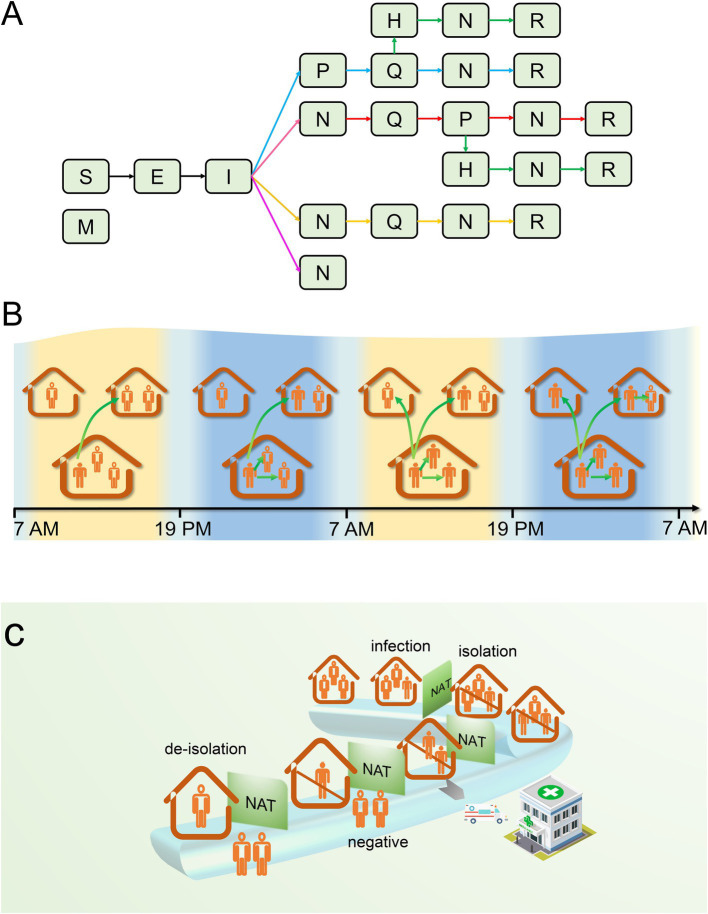
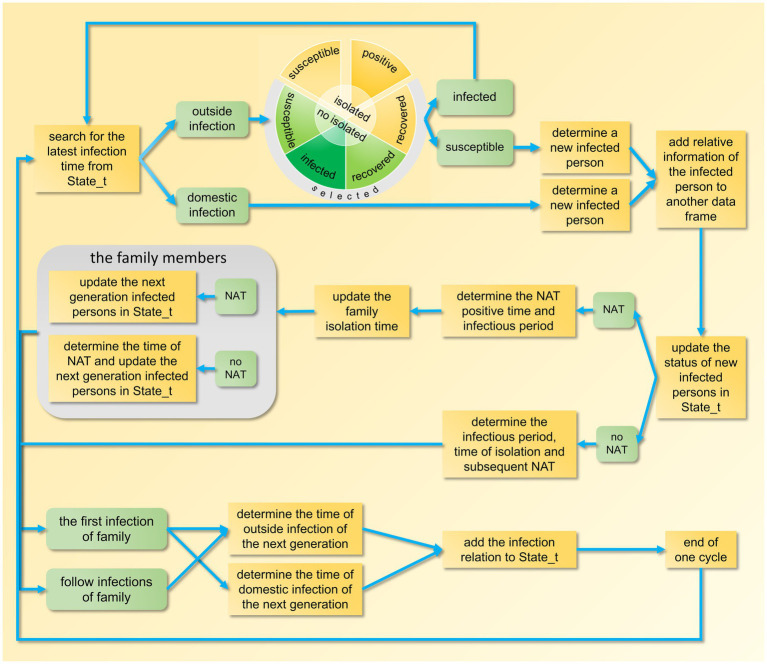
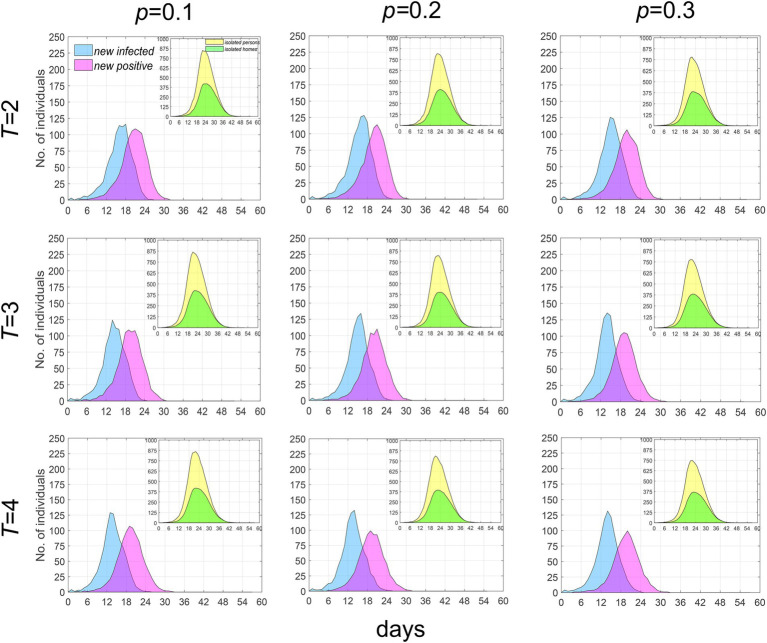
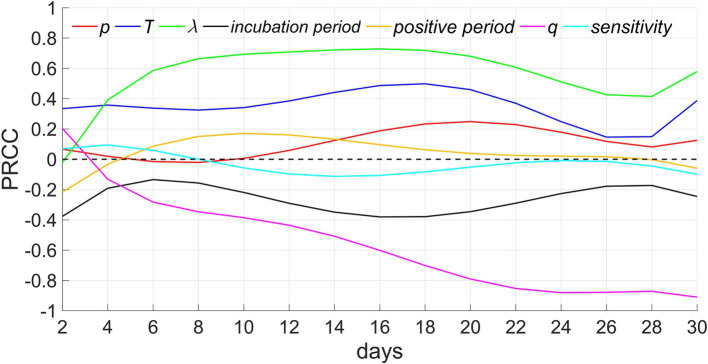
Methods: We developed an individual-based computational model of infectious disease dynamics. The model simulates regular large-scale nucleic acid testing for community residents during an epidemic. When individuals tested positive, they and their household members, as close contacts, are subjected to home isolation. During home isolation, the virus is assumed not to spread outside the household, but the potential for transmission within the household remained. Isolation measures can be lifted once the testing results turned negative. Finally, sensitivity analysis was conducted to verify the scientific validity and reliability of the model.

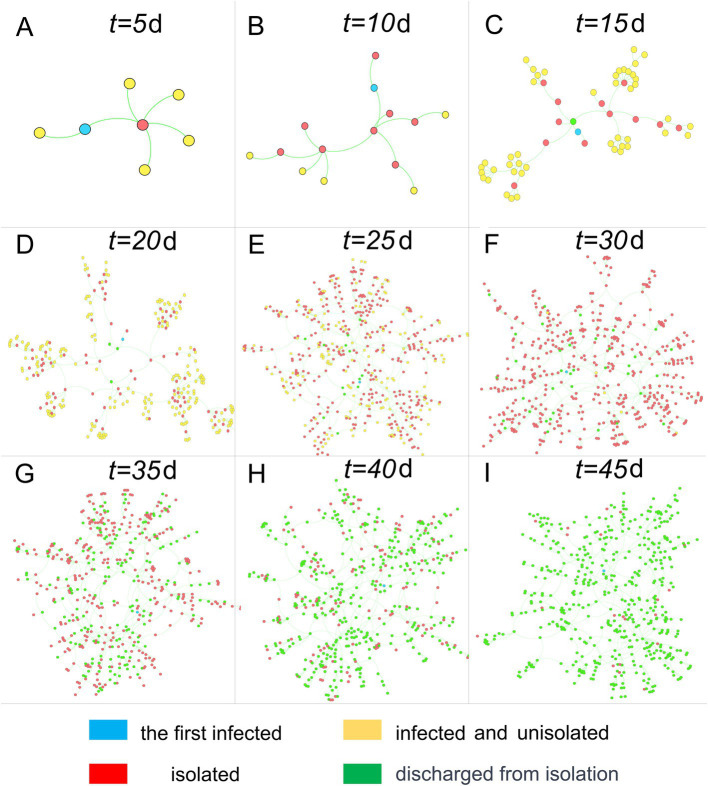
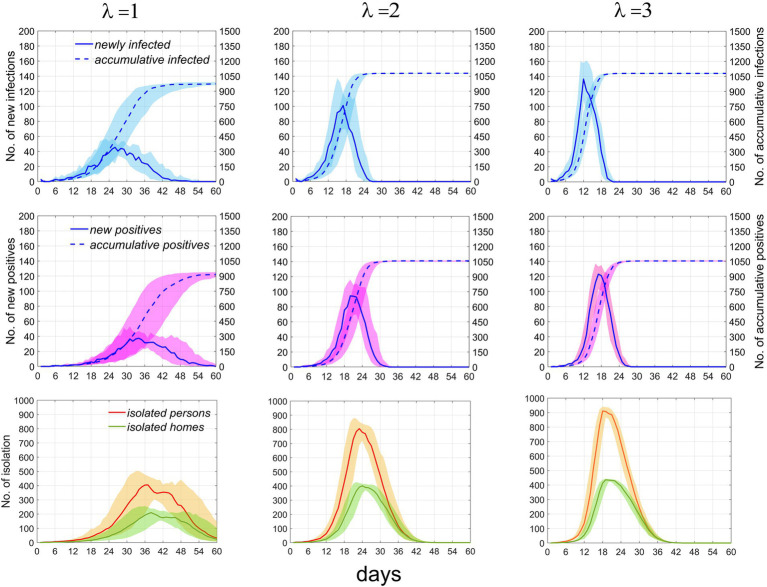
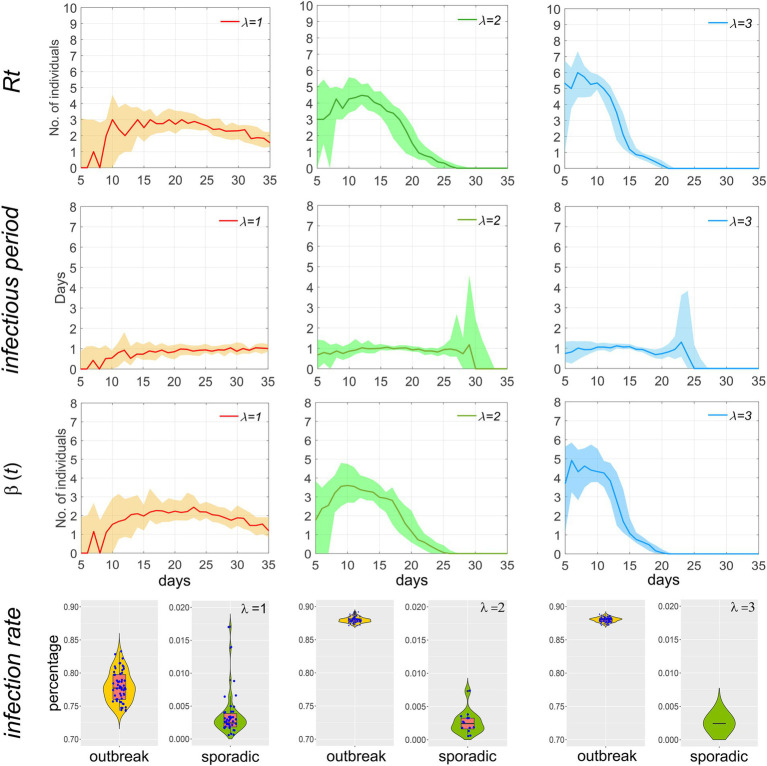
Results: The study found that the efficacy of testing and isolation in epidemic prevention is closely related to the speed of disease transmission. When the basic reproduction number (R0) is less than 3, these measures can significantly reduce the infection rate among the population and the speed of epidemic spread; otherwise, they fail to achieve the goal of controlling the epidemic.

Discussion: Reducing person-to-person contact is crucial for epidemic prevention and control. In addition to testing and isolation, comprehensive non-pharmaceutical interventions (NPIs) should also be implemented, such as increasing social distancing, restricting gatherings in public places, and promoting vaccination, to control the transmission of the epidemic.

Keywords: COVID-19; basic reproduction number; dynamic model; home quarantine; nucleic acid testing; respiratory infectious disease.


Conflict of interest statement

The authors declare that the research was conducted in the absence of any commercial or financial relationships that could be construed as a potential conflict of interest.

Figures

Figure 1
Figure 1
The transmission process of the epidemic within a household. (A) There are five possible scenarios of infection state transition that may exist for the first infector in a household. If the infector tested positive after becoming I: (1) they will be placed under home quarantine; during the quarantine period, they may be hospitalized for treatment due to worsening of their condition; after turning negative, they will be released from quarantine (green arrow); (2) during home quarantine, they are not hospitalized for treatment, and are released from quarantine after turning negative (blue arrow). If the infector’s testing is negative or they refuse testing, they may not be quarantined temporarily but might be quarantined as close contacts due to other household members testing positive. It can be manifested in the subsequent three scenarios: (3) they may test positive after isolation and are released after turning negative (red arrow) or transferred to the hospital for treatment and discharged upon recovery; (4) no positive results are detected after quarantine, and quarantine is lifted after a maximum incubation period (yellow arrow); (5) both the infector and their household members refuse to be tested or do not test positive, and the household is not quarantined (pink arrow). (B) Transmission between and within households. (C) The chronological order of infection, testing, isolation, and release of isolation in a household. S, susceptible; M, immune; E, exposed; I, infectious; P, positive; H, hospitalized; Q, quarantined; N, negative; R, recovered; NAT, nucleic acid test.
Figure 2
Figure 2
Schematic diagram of a design framework for an epidemic model. NAT, nucleic acid testing.
Figure 3
Figure 3
Home transmission networks at different time points. Nodes represent homes, and connections represent transmission relationships.
Figure 4
Figure 4
Human population transmission networks at different time points. Nodes represent individuals, and connections represent transmission relationships.
Figure 5
Figure 5
Temporal distribution of infected individuals, positive cases, and currently isolated individuals and homes under the scenario where p = 0.1 and T = 2. The first, second, and third rows represent infected individuals, positive individuals, and currently isolated individuals and households, respectively. Columns 1–3 correspond to λ = 1, 2, and 3, respectively. Numbers of newly infected individuals and positive individuals are indicated by the left vertical axis, while the cumulative numbers for both are denoted by the right vertical axis. Solid and dashed lines depict the median values. Areas of different colors indicate fluctuation ranges from 25 to 75%.
Figure 6
Figure 6
Temporal distribution of median values for newly infected individuals, positive individuals and the currently isolated individuals and homes when λ = 2. Infected individuals are denoted by blue, positive individuals by purple, while currently isolated individuals and homes are indicated by yellow and green, respectively.
Figure 7
Figure 7
Temporal distribution of Rt, infectious period, β(t), and the infection rate of the population during the outbreak of the epidemic when p = 0.1 and T = 2. Scatters within the violin plot represent the infection rate of the population during an epidemic.
Figure 8
Figure 8
Sensitivity analysis. p, T, λ, and q denote the proportion of people who refuse testing, the testing period, the extra-household adequate contact rate, and the proportion of people with innate immunity, respectively.

Similar articles

References

    1. The Comprehensive Group of the Joint Prevention and Control Mechanism of the State Council for COVID-19 . The prevention and control plan for COVID-19. (2022). Available online at: http://www.nhc.gov.cn/ (Accessed February 15, 2023).
    1. Meral Y, Elif F, Korin GÖ. COVID-19 diagnosis-a review of current methods. Biosens Bioelectron. (2021) 172:112752. doi: 10.1016/j.bios.2020.112752, PMID: - DOI - PMC - PubMed
    1. Beatriz B, Mariana MF, Raquel OV, Alexandre FC, Fernanda ST, Roberto P. Systematic review with meta-analysis of the accuracy of diagnostic tests for COVID-19. Am J Infect Control. (2021) 49:21–9. doi: 10.1016/j.ajic.2020.07.011, PMID: - DOI - PMC - PubMed
    1. Liu R, Han H, Liu F, Lv ZH, Wu KL, Liu YL, et al. . Positive rate of RT-PCR testing of SARS-CoV-2 infection in 4880 cases from one hospital in Wuhan, China, from Jan to Feb 2020. Clin Chim Acta. (2020) 505:172–5. doi: 10.1016/j.cca.2020.03.009, PMID: - DOI - PMC - PubMed
    1. Deng K, Li H, Ma X, Yu B, Yi X, Chen Y, et al. . Analysis of the positive rate of 4254 cases of COVID-19 nucleic acid tests in different aites in Wuhan, China. J Med Virol. (2021) 93:870–7. doi: 10.1002/jmv.26323, PMID: - DOI - PMC - PubMed

LinkOut - more resources