. 2025 May 19:16:1481366.
doi: 10.3389/fimmu.2025.1481366. eCollection 2025.

An immune-related signature based on molecular subtypes for predicting the prognosis and immunotherapy efficacy of hepatocellular carcinoma

Affiliations

An immune-related signature based on molecular subtypes for predicting the prognosis and immunotherapy efficacy of hepatocellular carcinoma

Xuhui Sun et al. Front Immunol. .

Abstract

Background: Immunotherapy has emerged as a pivotal therapeutic modality for a multitude of malignancies, notably hepatocellular carcinoma (HCC). This research endeavors to construct a prognostic signature based on immune-related genes between different HCC molecular subtypes, offer guidance for immunotherapy application, and promote its clinical practical application through immunohistochemistry.

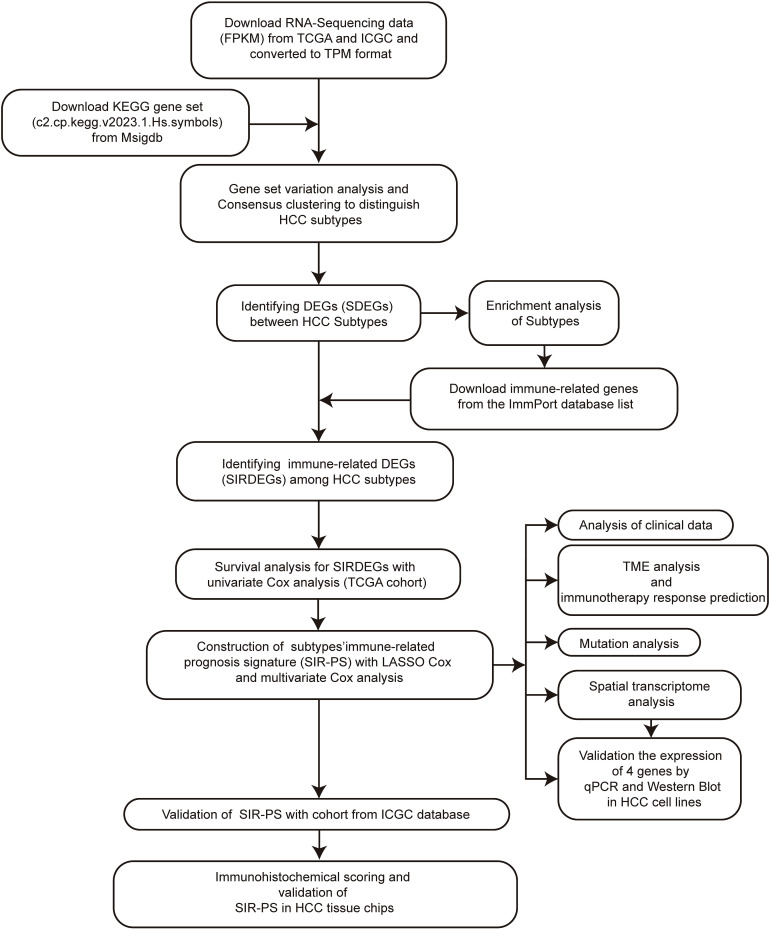
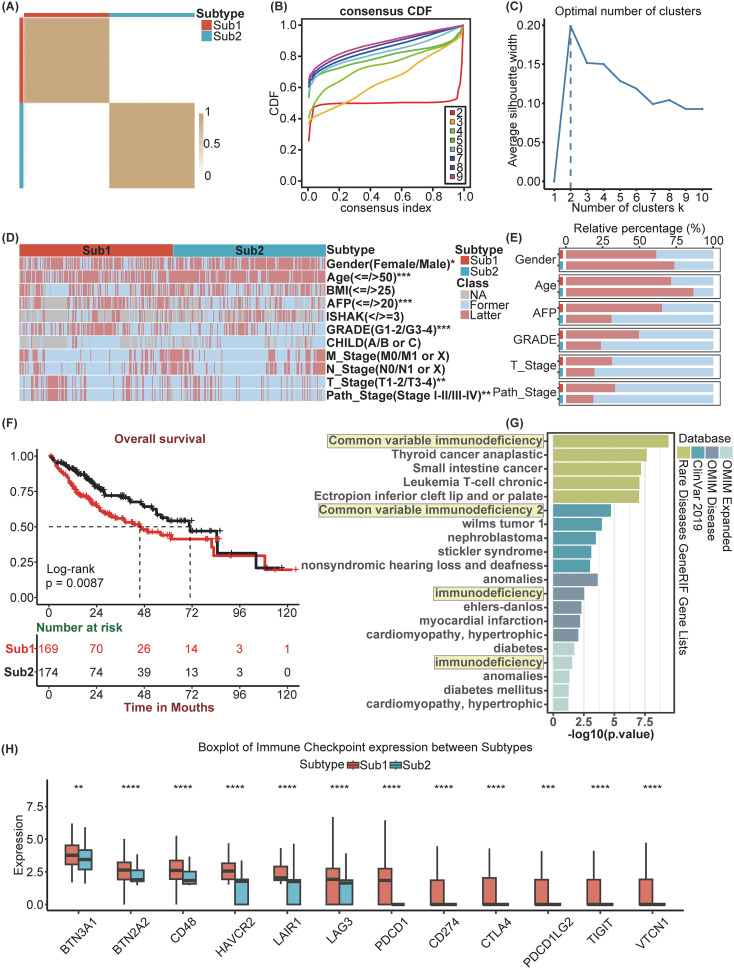
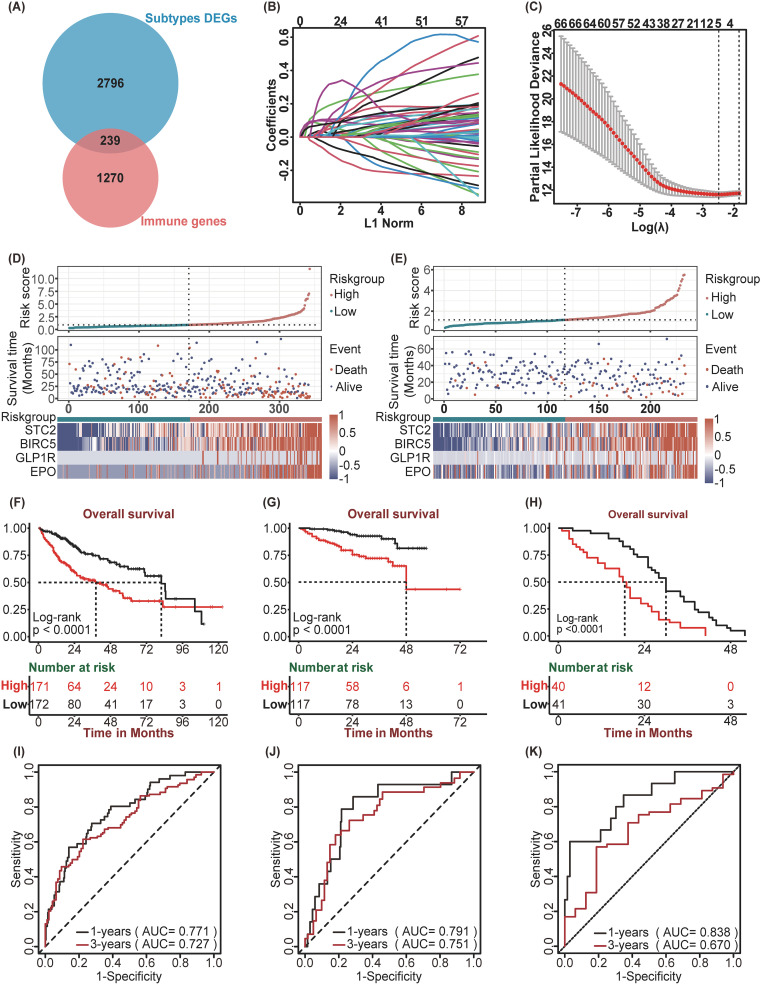
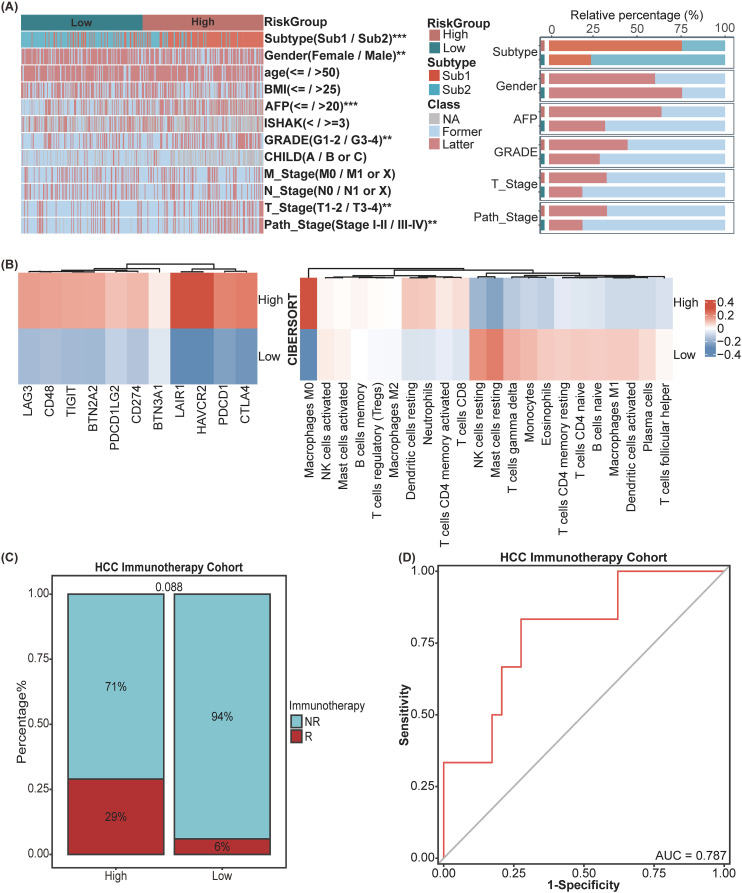
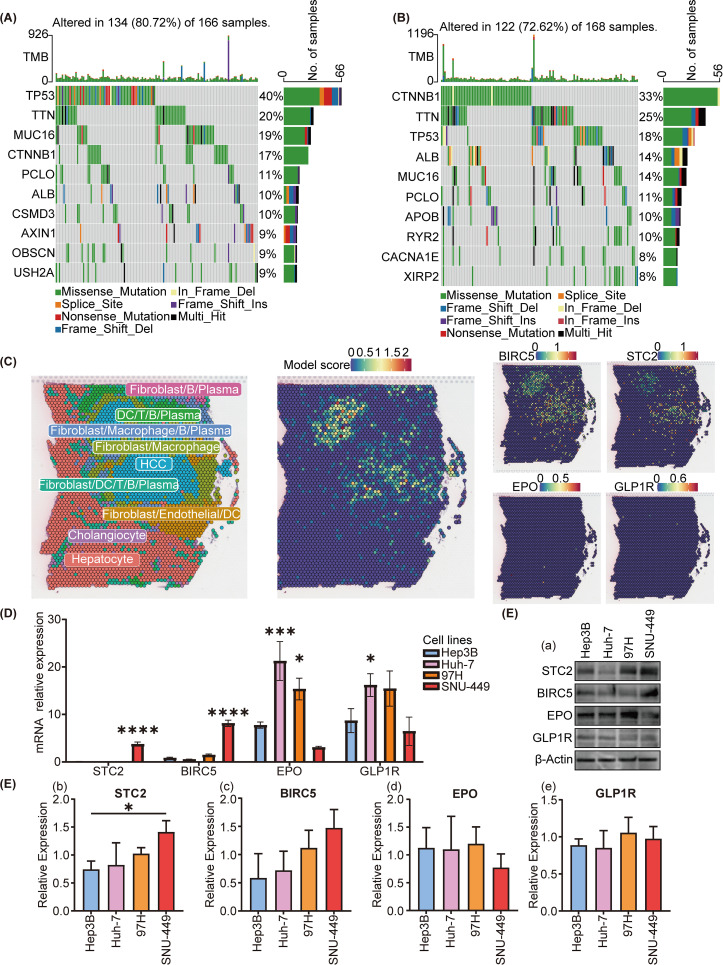
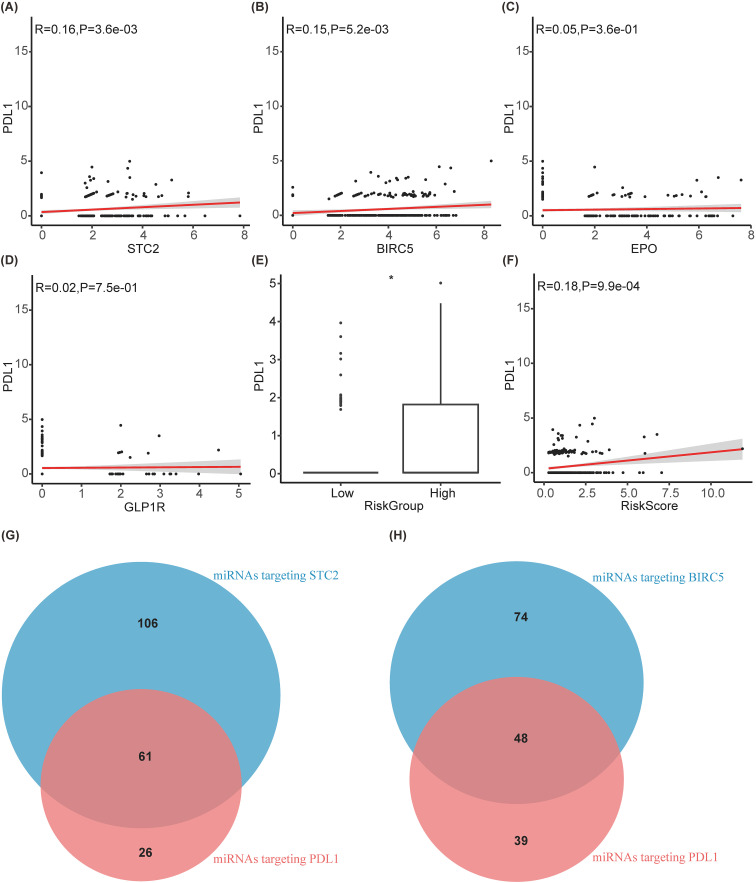
Methods: Distinguishing HCC subtypes through Gene set variation analysis and Consensus clustering analysis using the Kyoto Encyclopedia of Genes and Genome (KEGG) pathway. In the TCGA-LIHC cohort, univariate, Lasso, and multivariate Cox regression analyses were applied to construct a novel immune relevant prognostic signature. The Subtype-specific and Immune-Related Prognostic Signatures (SIR-PS) were validated in three prognostic cohorts, one immunotherapy cohort, different HCC cell lines and tissue chips. Further possible mechanism on immunotherapy was explored by miRNA-mRNA interactions and signaling pathway.

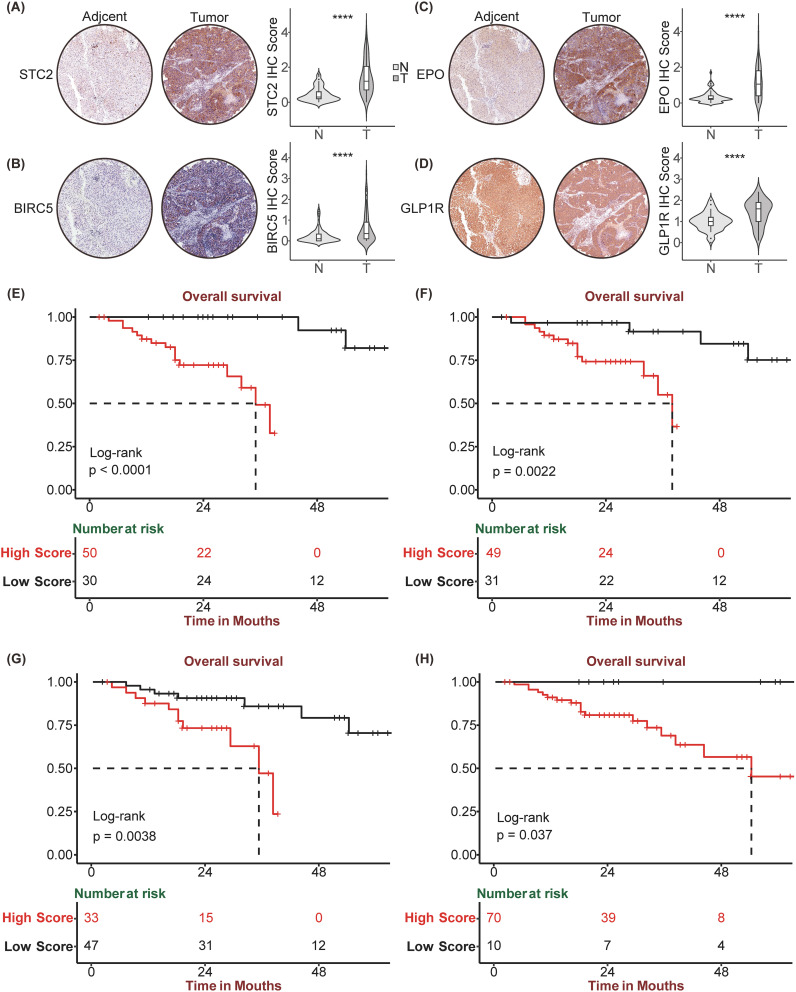
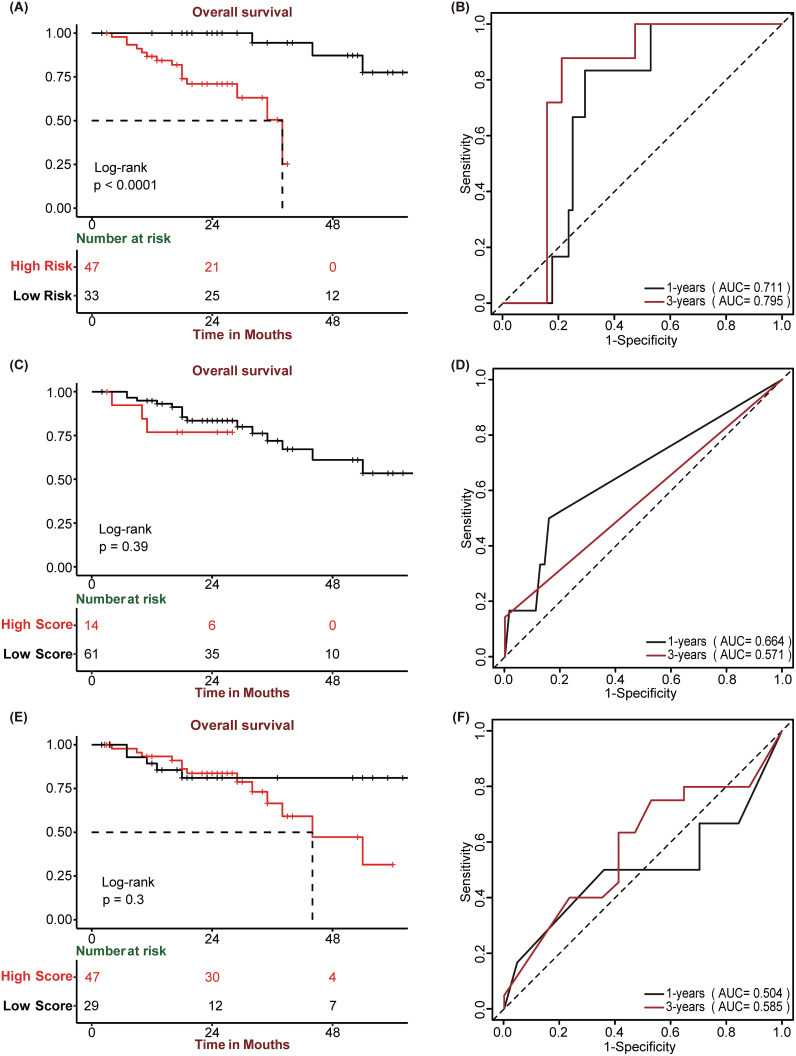
Results: This prognostic model, which was based on four critical immune-related genes, STC2, BIRC5, EPO and GLP1R, was demonstrated excellent performance in both prognosis and immune response prediction of HCC. Clinical pathological signature, tumor microenvironment and mutation analysis also proved the effective prediction of this model. Spatial transcriptome analysis shows that STC2 and BIRC5 are mainly enriched in liver cancer cells and their mRNA and protein expression levels were greater in higher malignant HCC cell lines than in the lower ones. Further validation on HCC tissue chips of this model also showed good correlation with cancer prognosis. The risk score of each patient demonstrated that the SIR-PS exhibited excellent 1 and 3-year survival prediction performance.

Conclusions: Our analysis demonstrates that the SIR-PS model serves as a robust prognostic and predictive tool for both the survival outcomes and the response to immunotherapy in hepatocellular carcinoma patients, which may shed light on promoting the individualized immunotherapy against hepatocellular carcinoma.

Keywords: biomarker; hepatocellular carcinoma; immune-related genes; immunohistochemistry; immunotherapy; prognosis.


Conflict of interest statement

The authors declare that the research was conducted in the absence of any commercial or financial relationships that could be construed as a potential conflict of interest.

Figures

Figure 1
Figure 1
Flow diagram of the analysis procedure: data collection, preprocessing, analysis and validation.
Figure 2
Figure 2
Identification and differential analysis of HCC Subtypes based on KEGG pathways. (A) Heatmap of sample clustering at consensus k=2. (B) Consensus clustering CDF for k= 2 to 9. (C) The Average Silhouette width Plot. (D) Heatmap of and (E) Stacked bar chart of multiple clinicopathological features between Subtypes. (F) Kaplan-Meier survival plots between Subtypes for Overall Survival (0S). (G) Enrichment analysis of diseases associated with Sub1 enrichment genes. (H) Immune Checkpoint genes’ expression between Subtypes. *p<0.05, **p<0.01, ***p<0.001, ****p<0.0001.
Figure 3
Figure 3
Construction and Validation of SIR-PS. (A) Venn plot showed 239 immune-related DEGs among subtypes. (B) LASSO coefficient profiles of 67 prognostic genes of HCC. (C) 10-fold cross validated lasso regression identified five prognostic genes with minimal λ. (D, E) Riskscore distribution, survival status, and expression of four SIR-PS signature genes of patients in the Low-risk and High-risk group of TCGA Cohort and ICGC Cohort, respectively. (F–H) Kaplan-Meier survival plots of High-risk and Low-risk group for Overall Survival in the TCGA Cohort, the ICGC Cohort and the GSE54236 Cohort. (I–K) Time-dependent ROC curves of SIR-PS for Overall Survival in the TCGA Cohort, the ICGC Cohort and the GSE54236 Cohort.
Figure 4
Figure 4
Exploration of clinical significance and tumor microenvironment of SIR-PS in the TCGA Cohort. (A) Heatmap and Stacked bar chart of multiple clinicopathological features between High-risk and Low-risk group of SIR-PS. (B) Heatmap of Immune Checkpoint expression and CIBERSORT result between High-risk and Low-risk group of SIR-PS. (C) Stacked bar chart of immunotherapy response between High-risk and Low-risk group of SIR-PS in our HCC Immunotherapy Cohort. (D) Diagnostic ROC plot of SIR-PS predicting response to immunotherapy. **p<0.01, ***p<0.001.
Figure 5
Figure 5
Mutational and spatial transcriptome analysis of SIR-PS risk groups and cell experiment of different cell lines. (A, B) Oncoplot analysis of the high-risk and low-risk group, respectively. (C) Spatial expression pattern of SIR-PS (including BIRC5, STC2, EPO and GLP1R). (D) qPCR and (E) Western Blotting result of Hep3B, Huh7, 97H and SNU-449 (compare with Hep3B cell lines). *p<0.05, ***p<0.001, ****p<0.0001.
Figure 6
Figure 6
Immunohistochemistry staining and corresponding Kaplan Meier analysis of STC2, BIRC5, EPO, GLP1R. Tumor and paired Normal tissue IHC staining of HCC tissue chip by STC2 (A), BIRC5 (B), EPO (C), GLP1R (D). Kaplan-Meier curve between high and low expression of STC2 (E), BIRC5 (F), EPO (G), GLP1R (H) in HCC tissue chip Cohort, respectively. ****p<0.0001.
Figure 7
Figure 7
Prognostic performance of SIR-PS, GPC3, and CK19. (A, C, E) Kaplan-Meier survival plots of SIR-PS risk group, CK19 and GPC3 expression group for Overall Survival in the HCC tissue chip Cohort. (B, D, F) Time-dependent ROC curves of SIR-PS, CK19 and GPC3 for Overall Survival in the HCC tissue chip Cohort.
Figure 8
Figure 8
Exploration of the mechanism by which prognostic models affect immunotherapy. (A–D) Correlation diagram between PDL1 and STC2, BIRC5, EPO, GLP1R, respectively. (E) Boxplot between PDL1 and riskgroup. (F) Correlation diagram between PDL1 and riskscore. (G, H) Venn diagram of miRNAs targeting PDL1 with targeting STC2 and BIRC5, respectively.

Similar articles

References

    1. Sung H, Ferlay J, Siegel RL, Laversanne M, Soerjomataram I, Jemal A, et al. . Global cancer statistics 2020: GLOBOCAN estimates of incidence and mortality worldwide for 36 cancers in 185 countries. CA: A Cancer J Clinicians. (2021) 71:209–49. doi: 10.3322/caac.21660 - DOI - PubMed
    1. Forner A, Reig M, Bruix J. Hepatocellular carcinoma. Lancet. (2018) 391:1301–14. doi: 10.1016/S0140-6736(18)30010-2 - DOI - PubMed
    1. Llovet JM, De Baere T, Kulik L, Haber PK, Greten TF, Meyer T, et al. . Locoregional therapies in the era of molecular and immune treatments for hepatocellular carcinoma. Nat Rev Gastroenterology Hepatology. (2021) 18:293–313. doi: 10.1038/s41575-020-00395-0 - DOI - PubMed
    1. Piñero F, Dirchwolf M, Pessôa MG. Biomarkers in hepatocellular carcinoma: diagnosis, prognosis and treatment response assessment. Cells. (2020) 9:1370–0. doi: 10.3390/cells9061370 - DOI - PMC - PubMed
    1. Miura S, Mitsuhashi N, Shimizu H, Kimura F, Yoshidome H, Otsuka M, et al. . Fibroblast growth factor 19 expression correlates with tumor progression and poorer prognosis of hepatocellular carcinoma. BMC Cancer. (2012) 12:0–0. doi: 10.1186/1471-2407-12-56 - DOI - PMC - PubMed

MeSH terms