

Distinct gut microbiota and metabolomic profiles in HBV-related liver cirrhosis: insights into disease progression
- PMID: 40458519
- PMCID: PMC12127420
- DOI: 10.3389/fcimb.2025.1560564
Distinct gut microbiota and metabolomic profiles in HBV-related liver cirrhosis: insights into disease progression
Abstract
Background: Hepatitis B virus (HBV)-related liver cirrhosis (HBV-LC) is a significant global health issue, affecting gut microbiota (GM) composition and metabolic processes. This study aimed to explore the associations between intestinal microbiota, metabolic profiles, and disease progression in patients with HBV-LC.
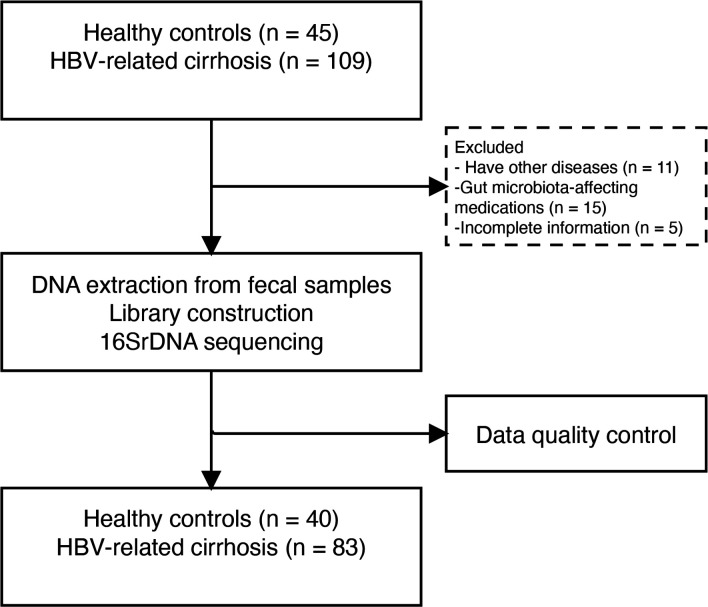
Methods: Fecal samples were collected prospectively from 40 healthy controls (HC) and 83 HBV-LC patients between December 2022 and August 2023. Gut microbiota alterations at various stages of liver function were analyzed using 16S rRNA gene sequencing. Untargeted metabolomics was employed to identify potential biomarkers and metabolic pathways associated with early cirrhosis. Additionally, correlations between bacterial genera, inflammatory markers, and metabolites were investigated.
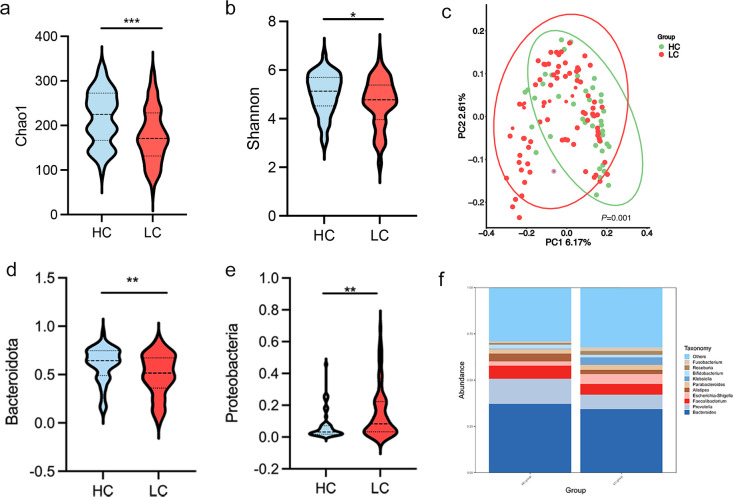
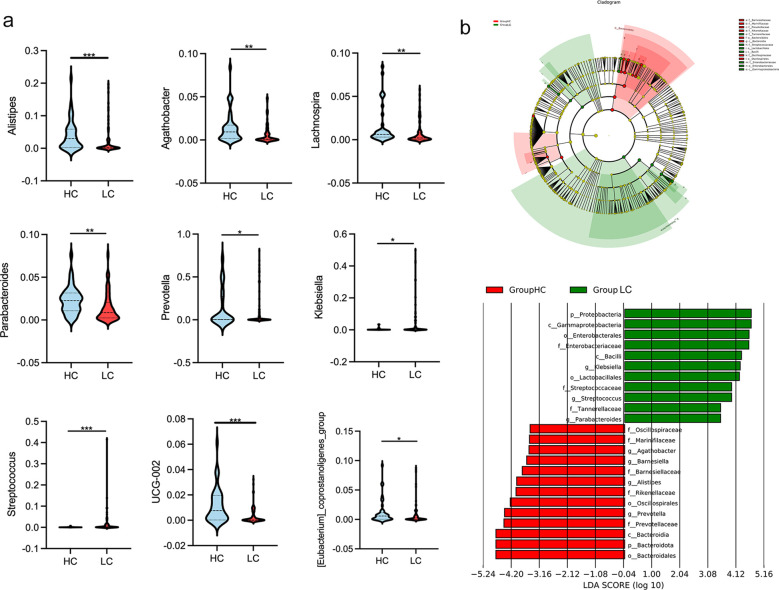
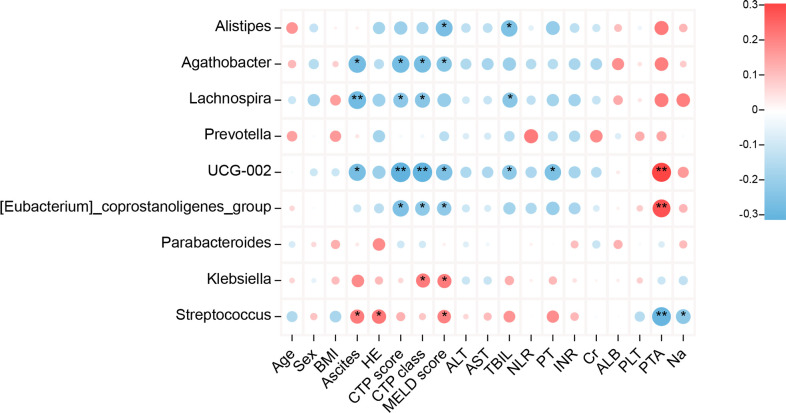
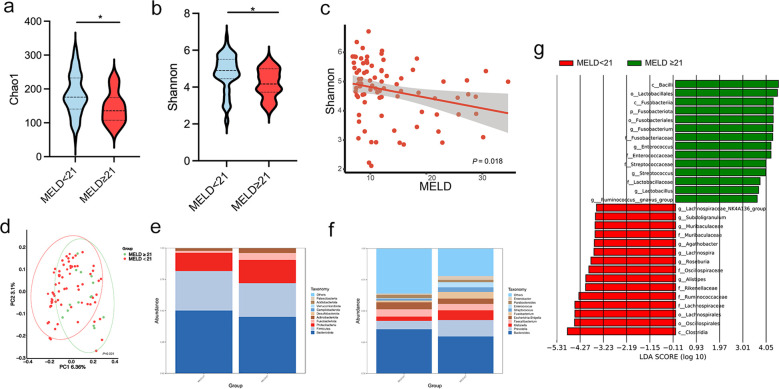
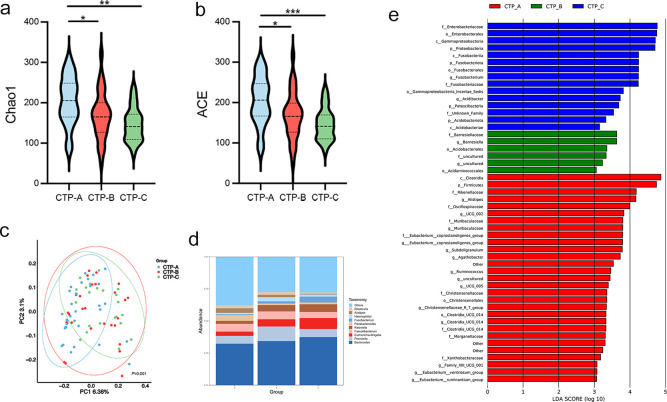
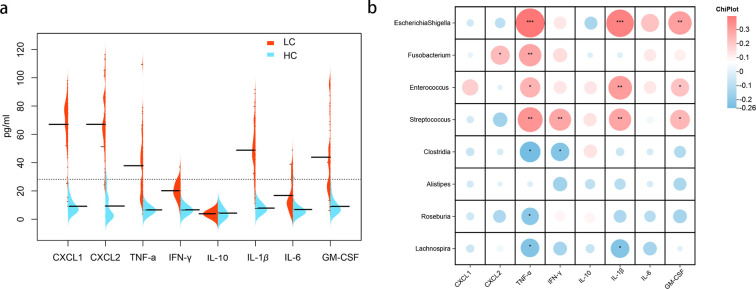
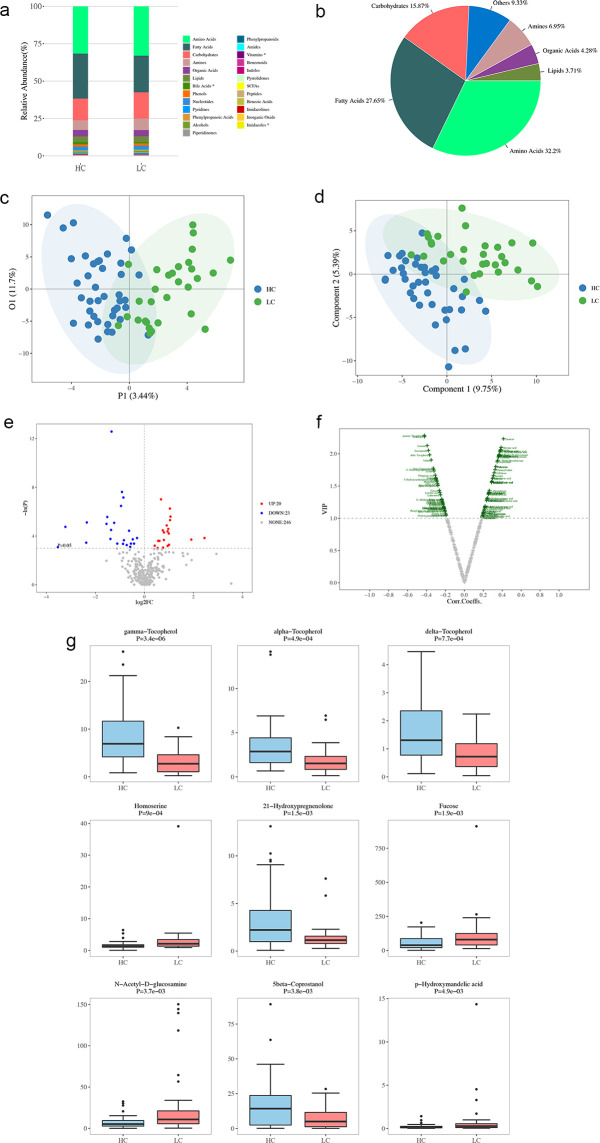
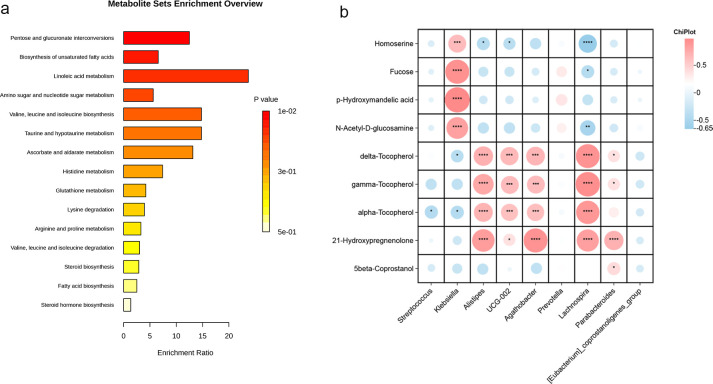
Results: HBV-LC patients demonstrated a significant reduction in bacterial diversity and relative abundance compared to the HC group. Genera such as Alistipes and Lachnospira were notably depleted, while Fusobacterium and Enterococcus were enriched in patients with Model for End-Stage Liver Disease (MELD) scores ≥ 21 or Child-Turcotte-Pugh C grade. Correlation analyses revealed strong associations between intestinal flora, clinical indicators of disease severity, and inflammatory factors. Metabolic analysis showed decreased levels of tocopherol and 21-hydroxypregnenolone, which were strongly linked to the reduced abundance of Alistipes and Lachnospira. Biosynthesis of unsaturated fatty acids and linoleic acid metabolism emerged as critical enrichment pathways.
Conclusions: HBV-LC patients displayed significant alterations in gut microbiota and fecal metabolites, which correlated closely with disease severity and inflammatory status. These findings provide new insights into cirrhosis pathogenesis and suggest potential biomarkers for early diagnosis and disease monitoring.
Keywords: 16S rRNA sequencing; cirrhosis; gut microbiota; hepatitis B virus; metabolomics.
Copyright © 2025 Shi, Sun, Feng and Wang.
Conflict of interest statement
The authors declare that the research was conducted in the absence of any commercial or financial relationships that could be construed as a potential conflict of interest. The reviewer YF declared a shared affiliation with the author(s) to the handling editor at the time of review.
Figures
Similar articles
-
Alterations in gut microbiome and metabolomics in chronic hepatitis B infection-associated liver disease and their impact on peripheral immune response.Gut Microbes. 2023 Jan-Dec;15(1):2155018. doi: 10.1080/19490976.2022.2155018. Gut Microbes. 2023. PMID: 36519342 Free PMC article.
-
Gut microbiota as prognosis markers for patients with HBV-related acute-on-chronic liver failure.Gut Microbes. 2021 Jan-Dec;13(1):1-15. doi: 10.1080/19490976.2021.1921925. Gut Microbes. 2021. PMID: 34006193 Free PMC article.
-
Gut microbiota dysbiosis in patients with hepatitis B virus-induced chronic liver disease covering chronic hepatitis, liver cirrhosis and hepatocellular carcinoma.J Viral Hepat. 2020 Feb;27(2):143-155. doi: 10.1111/jvh.13216. Epub 2019 Oct 29. J Viral Hepat. 2020. PMID: 31600845
-
Machine learning algorithms reveal gut microbiota signatures associated with chronic hepatitis B-related hepatic fibrosis.World J Gastroenterol. 2025 Apr 28;31(16):105985. doi: 10.3748/wjg.v31.i16.105985. World J Gastroenterol. 2025. PMID: 40308807 Free PMC article.
-
Uncovering potential biomarkers and metabolic pathways in systemic lupus erythematosus and lupus nephritis through integrated microbiome and metabolome analysis.BMC Microbiol. 2025 May 7;25(1):275. doi: 10.1186/s12866-025-03995-5. BMC Microbiol. 2025. PMID: 40329182 Free PMC article.
References
MeSH terms
Substances
LinkOut - more resources
Full Text Sources
Medical