

Corneal Biomechanics as a Causal Factor in Myopia and Astigmatism: Evidence from Mendelian Randomization
- PMID: 40458666
- PMCID: PMC12127654
- DOI: 10.1016/j.xops.2025.100738
Corneal Biomechanics as a Causal Factor in Myopia and Astigmatism: Evidence from Mendelian Randomization
Abstract
Purpose: The causal relationship between refractive errors and corneal biomechanical properties remains uncertain. This study aimed to clarify this relationship using Mendelian randomization (MR), offering new insights into the prevention and treatment of refractive errors.
Design: A bidirectional, 2-sample MR analysis.
Participants: Corneal biomechanical data were obtained from 97 653 European participants in the UK Biobank, whereas refractive error data were sourced from the UK Biobank and FinnGen consortia.
Methods: The exposures in this study were identified as corneal biomechanical parameters, specifically corneal hysteresis (CH) and the corneal resistance factor (CRF). The outcomes were defined as refractive errors, including myopia, hyperopia, and astigmatism, along with refractive power, encompassing both spherical and cylindrical power. A meta-analysis was performed to combine the MR estimates from both UK Biobank and FinnGen consortia, with heterogeneity assessed using the Q test and I2 statistics. Additionally, a reverse MR analysis was conducted to examine the potential causal effect of the refractive status on corneal biomechanics.
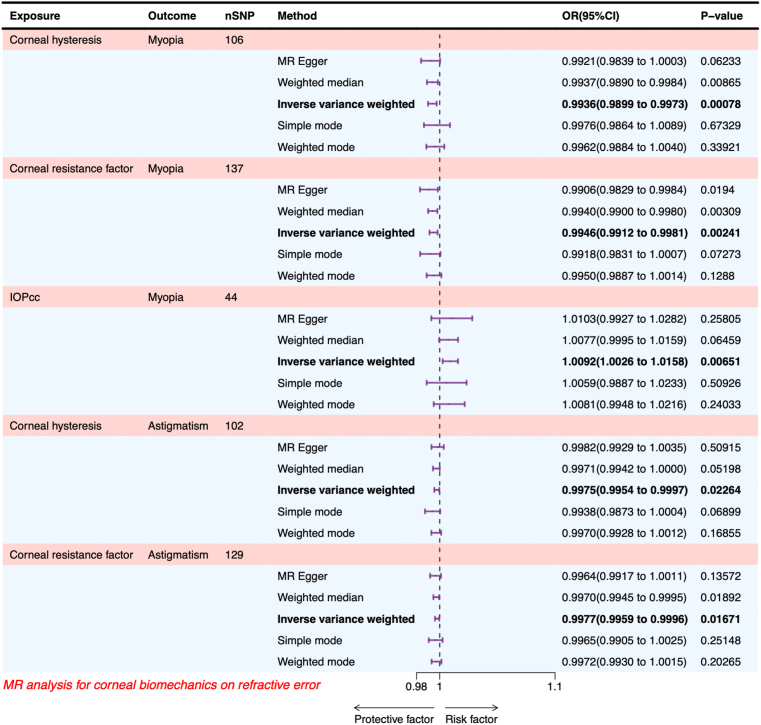
Main outcome measures: Corneal hysteresis and CRF as causal factors in myopia and astigmatism.
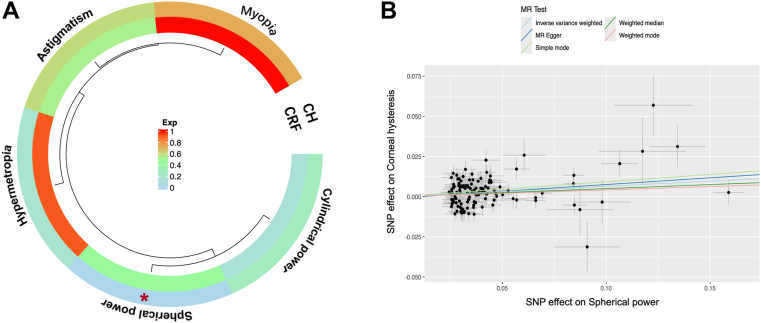
Results: Data from UK Biobank revealed that CH and CRF were protective against the development of myopia (CH: odds ratio (OR) = 0.9936, P = 7.79 × 10⁻⁴; CRF: OR = 0.9946, P = 2.41 × 10⁻³) and astigmatism (CH: OR = 0.9975, P = 0.02; CRF: OR = 0.9977, P = 0.017). Conversely, increased corneal-compensated intraocular pressure was a risk factor for myopia development (OR = 1.0091, P = 2.07 × 10- 2). The meta-analysis, which combined data from both sources, supported a causal relationship between CH and CRF and the development of myopia, although no significant causal link was found for hyperopia. Reverse MR analysis demonstrated a causal effect of spherical power on CH (OR = 1.0664, P = 4.32 × 10- 5).
Conclusions: Corneal biomechanical parameters, particularly CH and CRF, may serve as early biomarkers for predicting myopia. This protective role supports their use in clinical screening to enhance early intervention strategies. Corneal-compensated intraocular pressure is a risk factor for myopia and represents a novel therapeutic target. Future research should clarify the underlying mechanisms and assess biomechanical interventions, potentially transforming refractive error management and reducing visual impairment.
Financial disclosures: The author(s) have no proprietary or commercial interest in any materials discussed in this article.
Keywords: Astigmatism; Corneal biomechanics; Hyperopia; Mendelian randomization; Myopia.
© 2025 Published by Elsevier Inc. on behalf of the American Academy of Ophthalmologyé.
Figures


Similar articles
-
Causal Links Between Corneal Biomechanics and Myopia: Evidence from Bidirectional Mendelian Randomization in the UK Biobank.Bioengineering (Basel). 2025 Apr 13;12(4):412. doi: 10.3390/bioengineering12040412. Bioengineering (Basel). 2025. PMID: 40281772 Free PMC article.
-
Bidirectional Causal Relationships between Corneal Biomechanics and Glaucoma or Intraocular Pressure.Ophthalmol Sci. 2025 Feb 18;5(4):100742. doi: 10.1016/j.xops.2025.100742. eCollection 2025 Jul-Aug. Ophthalmol Sci. 2025. PMID: 40212935 Free PMC article.
-
The impact of age, gender, and ocular parameters on corneal biomechanics in Chinese refractive candidates.PLoS One. 2025 Jun 4;20(6):e0325419. doi: 10.1371/journal.pone.0325419. eCollection 2025. PLoS One. 2025. PMID: 40465777 Free PMC article.
-
Comparison of corneal biomechanical changes after refractive surgery by noncontact tonometry: small-incision lenticule extraction versus flap-based refractive surgery - a systematic review.Acta Ophthalmol. 2019 Mar;97(2):127-136. doi: 10.1111/aos.13906. Epub 2018 Sep 10. Acta Ophthalmol. 2019. PMID: 30203530
-
Comparison of Corneal Biomechanics Between Low and High Myopic Eyes-A Meta-analysis.Am J Ophthalmol. 2019 Nov;207:419-425. doi: 10.1016/j.ajo.2019.07.007. Epub 2019 Jul 30. Am J Ophthalmol. 2019. PMID: 31374186
References
-
- Naidoo K.S., Fricke T.R., Frick K.D., et al. Potential lost productivity resulting from the global burden of myopia: systematic review, meta-analysis, and modeling. Ophthalmology. 2019;126:338–346. - PubMed
-
- Holden B.A., Fricke T.R., Wilson D.A., et al. Global prevalence of myopia and high myopia and temporal trends from 2000 through 2050. Ophthalmology. 2016;123:1036–1042. - PubMed
LinkOut - more resources
Full Text Sources
