. 2025 May 19:16:1565951.
doi: 10.3389/fmicb.2025.1565951. eCollection 2025.

Impact of Lactiplantibacillus plantarum on the fermentation quality, nutritional enhancement, and microbial dynamics of whole plant soybean silage

Affiliations

Impact of Lactiplantibacillus plantarum on the fermentation quality, nutritional enhancement, and microbial dynamics of whole plant soybean silage

He Meng et al. Front Microbiol. .

Abstract

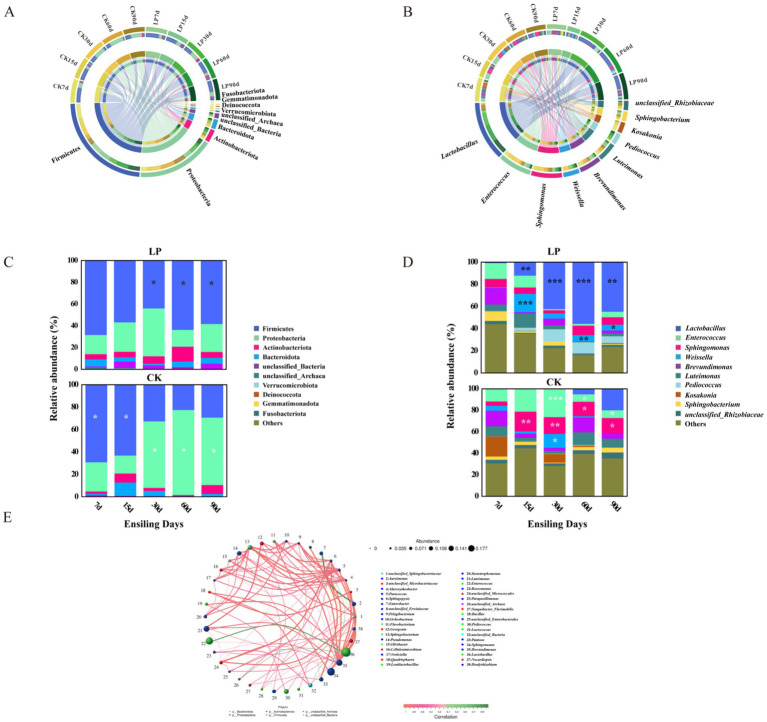
Soybean (Glycine max (L.) Merr.) is an important leguminous crop with rich nutrients and wide uses, yet soybean straw is often treated as waste in many areas without sufficient regard for its nutritional value. For the sustainable utilization of biomass resources, this study assessed the fermentation quality, microbial communities, and metabolites of whole plant soybean (WPS) silage with and without Lactiplantibacillus plantarum (LP) over different fermentation periods of 7, 15, 30, 60, and 90 days. With LP, there was a significant increase in dry matter (DM), crude protein (CP), and water-soluble carbohydrate (WSC) content of silage (p < 0.01) and a significant decrease in pH (p < 0.01). Incorporating LP into WPS silage significantly elevated lactic acid (LA) concentration, thereby improving fermentation quality. 16S rRNA gene sequencing revealed that LP inoculation significantly altered bacterial diversity and composition, notably increasing the relative abundance of Lactobacillus and promoting beneficial shifts in the microbial community during silage fermentation. Notably, LP treatment significantly promoted lysine biosynthesis, a key essential amino acid pathway, thereby contributing to the nutritional enhancement of the silage. Results showed that adding LP to WPS at ensiling can improve silage microbial community structure optimize metabolic processes, produce superior metabolites, and enhance the silage's fermentation quality and nutritional value, after 60 days of fermentation. In summary, WPS silage with LP addition could serve as a promising strategy for preserving high-protein forage silage.

Keywords: Lactiplantibacillus plantarum; bacterial community; metabolites; silage; soybean.


Conflict of interest statement

YX is employed by Beidahuang Group Heilongjiang Tangyuan Farm Co., Ltd., Jiamusi, China. The remaining authors declare that the research was conducted in the absence of any commercial or financial relationships that could be construed as a potential conflict of interest.

Figures

Figure 1
Figure 1
Comprehensive analysis of bacterial communities in WPS silage during ensiling. (A) The variations in bacterial community alpha-diversities (Shannon index, Simpson and ACE); (B) Principal coordinate analysis (PCoA) of the bacterial communities in WPS silage at the different ensiling days; (C) Petals diagram of WPS silage: Individual petals corresponded distinct groups, with the central figure indicating the shared ASVs across all conditions, and the numbers within each petal denoting group-specific ASVs (CK, control with no inoculations; LP, silages inoculated with Lactiplantibacillus plantarum; 7d, 7 days of ensiling; 15d, 15 days of ensiling; 30d, 30 days of ensiling; 60d, 60 days of ensiling; 90d, 90 days of ensiling; *p < 0.05; **p < 0.01; ns, no significant effect).
Figure 2
Figure 2
Bacterial community diversities and compositions in WPS silage during ensiling. (A) Circos map of bacterial communities at the phylum level during ensiling; (B) Circos map of bacterial communities at the genus level during ensiling; (C) Stacked bar charts showing relative abundance of bacterial community at phylum level. Differences in relative abundance were analyzed using a two-sided Student’s t-test (*p < 0.05; **p < 0.01; ***p < 0.001). White asterisks represented a lower relative abundance of this phylum in LP treatments compared to the CK group, while dark asterisks indicated a higher relative abundance in CK treatments relative to the CK group. (D) Stacked bar charts showing relative abundance of bacterial community at genus level. Differences in relative abundance were analyzed using a two-sided Student’s t-test (*p < 0.05; **p < 0.01; ***p < 0.001). White asterisks represented a lower relative abundance of this genus in LP treatments compared to the CK group, while dark asterisks indicated a higher relative abundance in CK treatments relative to the CK group. (E) Microbial network diagram at the genus level based on Spearman rank correlation analysis. Each circle in the diagram denoted a genus, with its size corresponding to the genus’s relative abundance. Distinct phylums were indicated by various colors. Lines connecting the circles signified statistically significant correlations (p < 0.05) between bacterial genus, with red indicating positive and green negative correlations. The line thickness reflected the strength of the correlation coefficient.
Figure 3
Figure 3
Linear Discriminant Analysis Effect Size (LEfSe) of microbial differences in WPS silage during ensiling. (A) Cladogram differences at various phylogenic levels; (B) LEfSe analysis with linear discriminant analysis (LDA) score. Discriminative features were identified using LDA score threshold of 4.0, with Kruskal-Wallis and Wilcoxon test significance at p < 0.05.
Figure 4
Figure 4
Metabolites in WPS silage during ensiling. (A) Pie chart distribution of all metabolites in WPS; (B) Time series expression analysis of different ensiling days in CK groups by the Short Time-series Expression Miner algorithm; (C) Time series expression analysis of different ensiling days in WPS ensiling with Lactobacillus plantarum by the Short Time-series Expression Miner algorithm. The lower left corner number represented the number of metabolites with the trend, profiles with color indicated statistically significant differences in trends (p < 0.05); (D) Score plots of PLS-DA. X and Y axes indicated the 1st and 2nd components; (E) Heatmap of the top 25 differential accumulated metabolites of CK group or LP group at the different ensiling days.
Figure 5
Figure 5
(A) Volcano plot analysis of differential metabolites in the CK and LP at the different ensiling days. Points on the volcano plot represented differentially accumulated metabolites (DAMs) with a log2 fold change (log2FC) greater than 1 between the two groups, indicating at least a twofold increase or decrease (p < 0.05); (B) Dot plot analysis of the KEGG pathway enrichment for significantly different metabolites accumulation in CK vs. LP at the different ensiling days (p < 0.05). The x-axis and y-axis, respectively, represented the different groups and the enrichment pathway; (C) KEGG metabolic network analysis of the pathways in the silage. Parts I, II, III represented the Cyanoamino acid metabolism, Glycine, Serine, and Threonine metabolism, and Lysine biosynthesis, respectively. The differentially accumulated metabolites (DAMs) were shown in green. The color block represented the fold changes (LP/CK) after log2 conversion, with upregulation in red and downregulation in blue.
Figure 6
Figure 6
Correlation analysis of fermentative indicators, bacteria and metabolites. (A) Canonical correlation analysis (CCA) of bacterial and metabolites in WPS silage. The red vector arrows represented the top 10 bacteria with relative abundance at the genus level, and the blue points represented metabolites; (B) The Mantel test correlation plot between bacteria, metabolites and key fermentation quality indicators based on Pearson’s correlation coefficients, with the red and blue squares indicating positive and negative correlation, respectively. The left two points symbolized the matrices for bacteria and metabolites. A thicker line indicated a stronger correlation by a higher Mantel’s r value. The green Line indicated significance with a Mantel’s p value between >0.01 and <0.05, while red denoted high statistical significance (*p < 0.05, **p < 0.01, ***p < 0.001) with a Mantel’s p value of <0.01; (C,D) Variation partitioning analysis (VPA) to determine the effects of addition of Lactiplantibacillus plantarum, ensiling days, fermentation characteristics, and interactions between these parameters on the structure of the bacterial communities and metabolites composition. Circles without overlap showed the percentage of variation explained by each factor alone. The overlap region of two or three circles displayed the explanation of variation between two or three of these factors.

References

    1. Ahmadi F., Lee Y. H., Lee W. H., Oh Y.-K., Park K., Kwak W. S. (2019). Long-term anaerobic conservation of fruit and vegetable discards without or with moisture adjustment after aerobic preservation with sodium metabisulfite. Waste Manag. 87, 258–267. doi: 10.1016/j.wasman.2019.02.010, PMID: - DOI - PubMed
    1. AOAC (1990). Official methods of analysis of the association of official analytical chemists. Arlington, VA: AOAC.
    1. Bai J., Ding Z., Ke W., Xu D., Wang M., Huang W., et al. . (2021). Different lactic acid bacteria and their combinations regulated the fermentation process of ensiled alfalfa: ensiling characteristics, dynamics of bacterial community and their functional shifts. Microb. Biotechnol. 14, 1171–1182. doi: 10.1111/1751-7915.13785, PMID: - DOI - PMC - PubMed
    1. Broderick G. A., Kang J. H. (1980). Automated simultaneous determination of ammonia and total amino acids in ruminal fluid and in vitro Media1. J. Dairy Sci. 63, 64–75. doi: 10.3168/jds.S0022-0302(80)82888-8, PMID: - DOI - PubMed
    1. Callahan B. J., McMurdie P. J., Rosen M. J., Han A. W., Johnson A. J. A., Holmes S. P. (2016). DADA2: high-resolution sample inference from illumina amplicon data. Nat. Methods 13, 581–583. doi: 10.1038/nmeth.3869, PMID: - DOI - PMC - PubMed

LinkOut - more resources