. 2025 Jan-Dec;19(1):e70021.
doi: 10.1049/syb2.70021.

Exploring Key Genes of Glutathione Metabolism in Systemic Lupus Erythematosus Based on Mendelian Randomisation, Single-Cell RNA Sequencing and Multiple Machine Learning Approaches

Affiliations

Exploring Key Genes of Glutathione Metabolism in Systemic Lupus Erythematosus Based on Mendelian Randomisation, Single-Cell RNA Sequencing and Multiple Machine Learning Approaches

Kejiang Wang et al. IET Syst Biol. 2025 Jan-Dec.

Abstract

Systemic lupus erythematosus (SLE) is a complex autoimmune disease characterised by immune dysregulation leading to inflammation and organ damage. Despite the rising global incidence of SLE, its aetiology remains unclear. We applied Mendelian randomisation (MR), multi-omics integration, machine learning (ML), and SHAP to identify key metabolites and genes associated with SLE, revealing the crucial role of the glutathione pathway. MR analysis was performed on 1400 serum metabolites, revealing significant enrichment in the glutathione metabolic pathway. Single-cell RNA sequencing (scRNA-seq) data classified monocytes into Metabolism_high and Metabolism_low groups based on glutathione metabolism scores. Differentially expressed genes were analysed using GSEA, metabolic pathway activity assessment, transcription factor prediction, cellular communication analysis, and Pseudotime analysis. LASSO regression identified hub genes and machine learning models (CatBoost, XGBoost, NGBoost) were developed. The SHAP method was used to interpret these models. Expression of key genes was validated across multiple datasets. MR analysis confirmed that metabolites were enriched in the glutathione pathway, identifying nine hub genes. Machine learning models achieved AUCs of 0.85, 0.80, and 0.83 in the validation set. SHAP analysis highlighted LAP3 as the top contributing gene across all models. scRNA-seq data showed that LAP3 plays a significant role in the immune microenvironment of SLE. Validation across multiple datasets (training, validation, and GSE112087) revealed elevated LAP3 expression in PBMCs of SLE patients, with AUCs of 0.935, 0.795, and 0.817, respectively, suggesting strong diagnostic potential. Glutathione metabolism is closely associated with SLE development and LAP3 may play a key role in its progression. Both glutathione metabolism and LAP3 could serve as potential targets for SLE diagnosis and treatment.

Keywords: SHAP, multi‐omic; glutathione metabolism; machine learning; mendelian randomisation; single‐cell RNA sequencing; systemic lupus erythematosus (SLE).


Conflict of interest statement

The authors declare no conflicts of interest.

Figures

FIGURE 1
FIGURE 1
Flowchart of study design. GSEA, Gene Set Enrichment Analysis; LASSO, least absolute shrinkage and selection operator; PPI, protein–protein interaction.
FIGURE 2
FIGURE 2
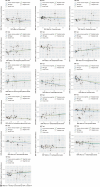
Significant causal relationships exist between 16 metabolites and SLE. Scatter plot: The x‐axis represents the impact of SNPs on exposure and the y‐axis represents the impact of SNPs on outcomes. Lines in different colours represent various MR methods, with slopes greater than zero indicating that exposure is a risk factor for outcomes. SLE, systemic lupus erythematosus; SNPs, single nucleotide polymorphisms; MR, Mendelian randomisation.
FIGURE 3
FIGURE 3
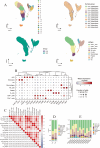
scRNA‐seq data set annotation. (A) The uniform manifold approximation and projection (UMAP) plots of cell clusters in SLE, 18 clusters (top left), sample origin (top right), group of origin (bottom left), annotated cell subgroups (bottom right). Each point represents a cell, with different colours indicating different cell clusters, patients, and origins. (B) Maker gene expression in different cell cluster. (C) Heatmap of intercellular correlations (D) Proportion of peripheral blood immune cells in SLE and HCs groups. (E) Proportion of peripheral blood immune cells of different samples. HCs, healthy control group; Mmetabolism_high, monocytes with high glutathione metabolism; metabolism_low, monocytes with low glutathione metabolism; SLE, systemic lupus erythematosus.
FIGURE 4
FIGURE 4
Gene set enrichment analysis (GSEA), pathway activity assessment, transcription factor activity prediction and cellular communication. (A) Differences in glutathione metabolism levels between SLE and HCs groups. (B) Differences in glutathione metabolism scores in different cell cluster. (C) GSEA analysis of differential genes. (D) Metabolic pathway activity assessment of metabolism_high and metabolism_low in the SLE group. (E) Prediction of transcription factor activity for Metabolism_high and Metabolism_low in the SLE group. (F)‐(I) Cellular communication of Metabolism_high and Metabolism_low in the SLE group, (F) shows the complex intercellular communication relationship, (G) shows the intensity of intercellular communication, (H–I) shows the ligand receptor where the intercellular interactions occur.
FIGURE 5
FIGURE 5
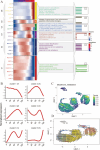
Cell trajectory inference, functional enrichment and dynamic expression of key genes in monocytes. The trajectory analysis of Fig. (A) shows the dynamic expression of glutathione key genes in SLE group monocytes and reveals the functional enrichment of monocyte subpopulations at different time nodes. Fig. (B) Expression trend of glutathione metabolism key genes in 6 cluster monocytes with developmental time nodes. Fig. (C) Density plot showing the distribution of glutathione metabolism scores in monocytes. Fig. (D) VECTOR algorithm to infer the starting point of cell development.
FIGURE 6
FIGURE 6
Identification of hub genes by LASSO regression and machine learning modelling of hub genes. (A) Path diagram of LASSO coefficients of hub genes in the training set. (B) Cross‐validation curve of LASSO regression. (C) PPI network of hub genes. (D) Immune infiltration analysis of hub genes. (E–F) AUC curves of the three machine learning methods in the training and validation sets. AUC, area under the curve; LASSO, least absolute contraction and selection operator; PPI, protein‐protein interaction network.
FIGURE 7
FIGURE 7
The SHAP method explains Catboost, NGboost and XGboost. (A)‐(C) Summary Plots, Beeswarm Plots, and Heatmap Plots of Catboost. (D)‐(F) Summary Plots, Beeswarm Plots, and Heatmap Plots of NGboost. (G)‐(I) Summary Plots, Beeswarm Plots, and Heatmap Plots of XGboost. LAP3 was the top contributing gene in the Catboost, NGboost and XGboost models.
FIGURE 8
FIGURE 8
LAP3 plays a crucial role in the immune microenvironment of SLE. (A) Co‐expression analysis of LAP3 with genes encoding key enzymes involved in glutathione metabolism. (B) Density plot demonstrating the central expression of LAP3 in monocytes. (C) Differences in transcription factor activities between LAP3+Mono and LAP3‐Mono. (D) GSEA enrichment analysis of differentially expressed genes in LAP3+Mono and LAP3‐Mono. (E) Prediction of metabolic pathway activities in LAP3+Mono and LAP3‐Mono. (F)‐(H) Results of cellular communication analysis of LAP3+Mono and LAP3‐Mono in the SLE group, (F) illustrates the strength of intercellular communication, (G–H) show the ligand‐receptor interactions between cells.
FIGURE 9
FIGURE 9
Expression of LAP3 in the training set, validation set, and GSE112087. Fig. (A–C), LAP3 expression levels in all three datasets of training set, validation set, and GSE112087 were significantly higher than that of healthy control (The Wilcoxon test was used to evaluate the values of the two groups). Figure (D–F), AUC values of LAP3 in all three datasets were greater than 0.75.

References

    1. Tsokos G. C., “Systemic Lupus Erythematosus,” New England Journal of Medicine 365, no. 22 (2011): 2110–2121, 10.1056/nejmra1100359. - DOI - PubMed
    1. Fava A. and Petri M., “Systemic Lupus Erythematosus: Diagnosis and Clinical Management,” Journal of Autoimmunity 96 (2019): 1–13, 10.1016/j.jaut.2018.11.001. - DOI - PMC - PubMed
    1. Arbuckle M. R., McClain M. T., Rubertone M. V., et al., “Development of Autoantibodies before the Clinical Onset of Systemic Lupus Erythematosus,” New England Journal of Medicine 349, no. 16 (2003): 1526–1533, 10.1056/nejmoa021933. - DOI - PubMed
    1. Didier K., Bolko L., Giusti D., et al., “Autoantibodies Associated With Connective Tissue Diseases: What Meaning for Clinicians?,” Frontiers in Immunology 9 (2018): 541, 10.3389/fimmu.2018.00541. - DOI - PMC - PubMed
    1. Gehin C., Fowler S. J., and Trivedi D. K., “Chewing the Fat: How Lipidomics Is Changing Our Understanding of Human Health and Disease in 2022,” Annual Science Advance 4, no. 4 (2023): 104–131, 10.1002/ansa.202300009. - DOI - PMC - PubMed

MeSH terms