. 2025 May 27;139(11):559-575.
doi: 10.1042/CS20255324. Online ahead of print.

Apolipoprotein-L1 G1 variant contributes to hydrocephalus but not to atherosclerosis in apolipoprotein-E knock-out mice

Affiliations

Apolipoprotein-L1 G1 variant contributes to hydrocephalus but not to atherosclerosis in apolipoprotein-E knock-out mice

Teruhiko Yoshida et al. Clin Sci (Lond). .

Abstract

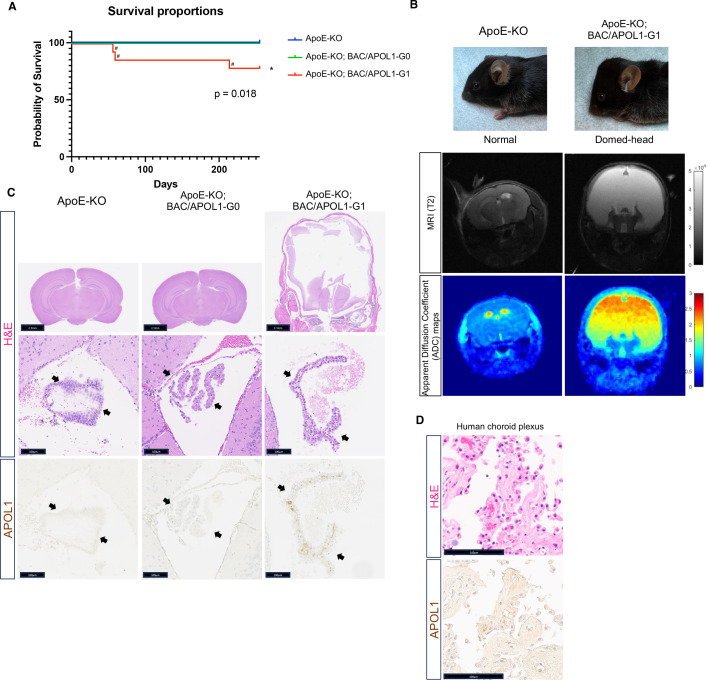
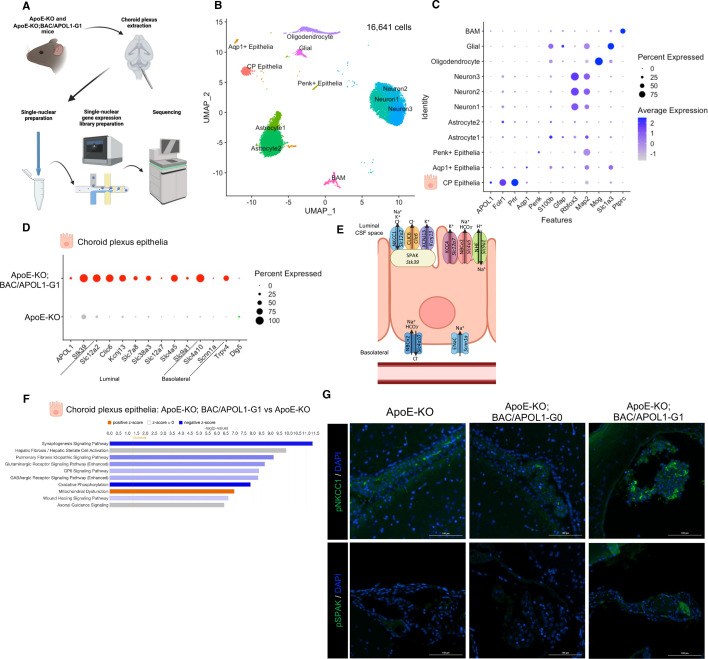
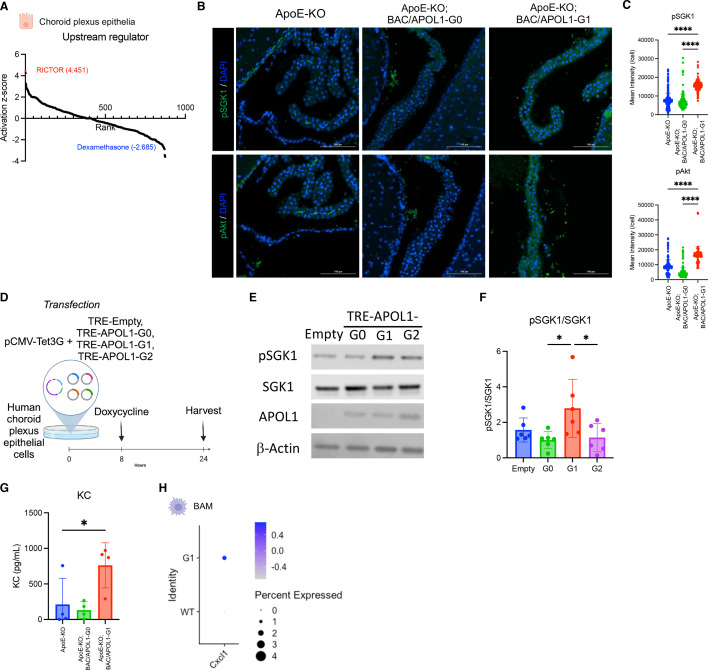
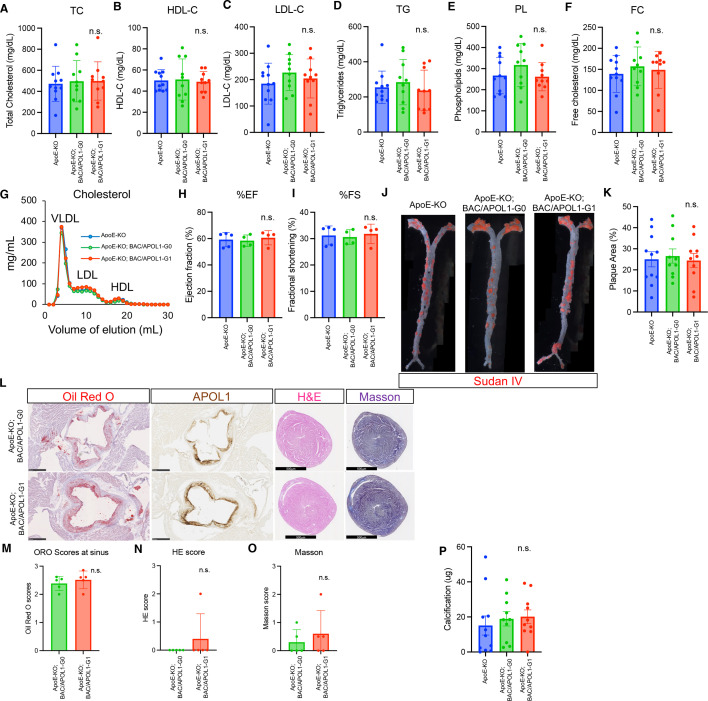
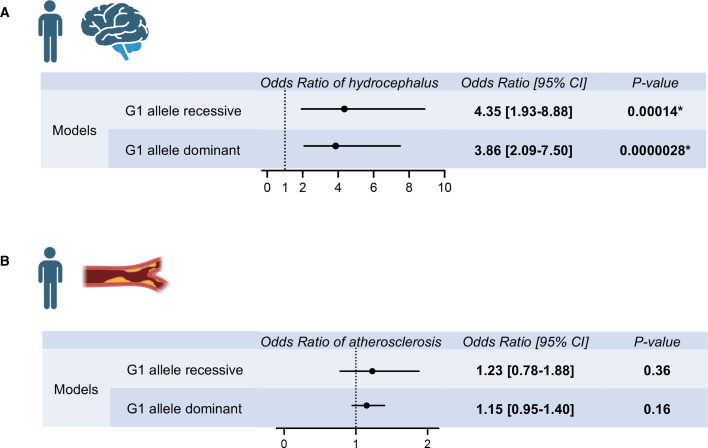
In USA, six million individuals with Sub-Saharan ancestry carry two APOL1 high-risk variants, which increase the risk for kidney diseases. Whether APOL1 high-risk variants increase other diseases under dyslipidemia remains unclear and requires further investigation.We characterized a mouse model to investigate the role of APOL1 in dyslipidemia and cardiovascular diseases. Transgenic mice carrying APOL1 (G0 and G1 variants)on bacterial artificial chromosomes (BAC/APOL1 mice) were crossed with the ApoE knock-out (ApoE-KO) dyslipidemia and atherosclerosis mouse model. The compound transgenic mice were evaluated for the impact of APOL1 on systemic phenotypes. ApoE-KO mice carrying APOL1-G0 and APOL1-G1 did not show differences in the extent of atherosclerotic lesions or aortic calcification, as evaluated by Sudan IV staining and radiographic examination, respectively. However, ~20% of ApoE-KO; BAC/APOL1-G1 mice developed hydrocephalus and required euthanasia. The hydrocephalus was communicating and likely was due to excess cerebrospinal fluid produced by the choroid plexus, where epithelial cells expressed APOL1. Single-nuclear RNA-seq of choroid plexus identified solute transporter upregulation and mTORC2 pathway activation in APOL1-G1-expressing epithelial cells. Further, in the All of Us cohort, we found higher hydrocephalus prevalence among individuals with the APOL1-G1 variant in both recessive and dominant models, supporting the mouse findings. While APOL1-G1 expression in ApoE-KO mice did not worsen cardiovascular disease phenotypes, we uncovered hydrocephalus as a novel APOL1 risk allele-mediated phenotype. These findings extend the spectrum of APOL1-associated pathologies.

Keywords: APOL1; apolipoproteins; atherosclerosis; hydrocephalus; transcriptomics.


Figures

Figure 1:
Figure 1:. APOL1-G1 variant contributes to hydrocephalus.
(A) Kaplan–Meier survival curve [ApoE-KO (n = 23), ApoE-KO; BAC/APOL1-G0 (n = 12), ApoE-KO; BAC/APOL1-G1 (n = 14)] showed early death of ApoE-KO; BAC/APOL1-G1 mice (log rank: P=0.018). #mark indicates mice requiring euthanasia due to hydrocephalus development. (B) Characteristic domed-head appearance and magnetic resonance imaging (MRI) T2 weighted images show hydrocephalus in ApoE-KO; BAC/APOL1-G1 mice. (C) Representative images of hematoxylin & eosin staining and APOL1 immunohistochemistry, showing APOL1 expression in the choroid plexus epithelium in ApoE-KO; BAC/APOL1 mice. (D) Representative images of hematoxylin & eosin staining and APOL1 immunohistochemistry, showing APOL1 expression in human choroid plexus epithelium. KO, knock-out; Scale bars are included in figures. Arrowheads point to choroid plexus epithelium.
Figure 2:
Figure 2:. Single-nucleus RNA-seq analysis of choroid plexus showed up-regulation of transporters in choroid plexus epithelial cells.
(A) Schematic of single-nucleus RNA-seq experiments using mouse choroid plexus tissue. (B) UMAP plot of single-nuclear RNA-seq data, showing 16,441 cells, distributed among 11 distinct cell clusters. (C) Dot plot shows marker genes characteristic of each of 11 clusters. (D) Dot plot shows the up-regulated expression of solute transporters in choroid plexus epithelium from ApoE-KO; BAC/APOL1-G1 mice, compared with APOE-KO mice. (E) Schematic of representative up-regulated genes in ApoE-KO; BAC/APOL1-G1 mice shows localization in choroid plexus epithelial cells. (F) Pathway analysis of differentially expressed genes in choroid plexus epithelium, comparing ApoE-KO; BAC/APOL1-G1 mice with APOE-KO mice. With regard to ApoE-KO; BAC/APOL1-G1 mice, orange denotes activated pathways, blue denotes deactivated pathways, and gray denotes unavailable pathway activation score. (G) Immunofluorescent images detected phospho-NKCC1 (Na-K-Cl co-transporter) and phospho-SPAK (STE20/SPS1-related proline/alanine-rich kinase), showing higher expression in ApoE-KO; BAC/APOL1-G1 mouse choroid plexus. CP, choroid plexus; BAM, border-associated macrophages.
Figure 3:
Figure 3:. The mTORC2 pathway was up-regulated in choroid plexus epithelium of APOL1-G1 mice.
(A) Waterfall plot shows the results of upstream analysis from differentialy-expressed genes in choroid plexus epithelium, comparing ApoE-KO; BAC/APOL1-G1 mice with APOE-KO mice. RICTOR, a component of mTORC2, was predicted to be the most activated upstream regulator of choroid plexus epithelial cells. (B) Immunofluorescent staining showed increased abundance of phospho-SGK1 (top row) and phospho-Akt (bottom row) in ApoE-KO; BAC/APOL1-G1 mouse choroid plexus. (C) Measurements of phospho-SGK1 and phospho-Akt immunofluorescence are shown. Images in Figure 3B were analyzed with cellular levels (one-way ANOVA). (D) Schematic shows the flow of human choroid plexus epithelial cells experiments. (E) Representative immunoblotting images against phospho-SGK1, SGK1, APOL1, and β-actin showed up-regulated phosphorylation of SGK1, immediate downstream of mTORC2, in TRE-APOL1-G1 transfected human choroid plexus epithelial cells. (F) Quantitative results of immunoblotting (n = 4 each) showed increased phospho-SGK1/SGK1 in TRE-APOL1-G1 cells, indicating mTORC2 activation. (G) Keratinocyte-derive cytokine (KC) levels in CSF were higher in ApoE-KO; BAC/APOL1-G1 mice compared with other genotypes. (H) Dot plot shows higher Cxcl1 cytokine expression in border-associated macrophages in ApoE-KO; BAC/APOL1-G1 mice compared with APOE-KO mice. Analysis by one-way ANOVA. *P<0.05; ****P<0.0001.
Figure 4:
Figure 4:. APOL1-G1 expression did not worsen cardiovascular phenotypes in ApoE-KO mice.
(A-F) Lipid measurements of total cholesterol (TC), high-density lipoprotein cholesterol (HDL-C), low-density lipoprotein cholesterol (LDL-C), triglycerides (TG), phospholipid (PL) and free cholesterol (FC). (G) Fast protein liquid chromatograph (FPLC) results of cholesterol in the very-low-density lipoprotein (VLDL), LDL, and HDL fractions. (H, I) Ejection fraction and fractional shortening measurements obtained from mouse echocardiography are shown for each mouse genotype. (J) Sudan IV images of whole dissected aorta are shown for each mouse genotype. (K) Quantitative results of aortic plaque area stained by Sudan IV are shown for each mouse genotype. (L) Representative pathology images of oil red O, APOL1 IHC of aorta sinus, and hematoxylin and eosin and Masson staining of cardiac ventricles. Scale bars are 500 μm. (M) Quantitative scores of oil red O staining of the aortic sinus. (N, O) Quantitative scores of H&E and Masson staining of cardiac ventricles showed no differences between groups. (P) Quantitative results of aortic calcification measurements showed no differences among groups.
Figure 5:
Figure 5:. Hydrocephalus and atherosclerosis risks by APOL1-G1 variant in the All of Us population cohort.
(A) Multivariate logistic regression analysis results for hydrocephalus odds ratios by APOL1-G1 recessive and dominant models, adjusted for age, sex, and eGFR were shown. APOL1-G1 variant was associated with an increased risk of hydrocephalus. (B) Multivariate logistic regression analysis results for atherosclerosis odds ratios by APOL1-G1 recessive and dominant models, adjusted for age, sex, and eGFR were shown. APOL1-G1 variant was not associated with an increased risk of atherosclerosis.

Update of

Similar articles

References

    1. Genovese, G. , Friedman, D.J. , Ross, M.D. , Lecordier, L. , Uzureau, P. , Freedman, B.I. et al. (2010) Association of trypanolytic ApoL1 variants with kidney disease in African Americans. Science 329, 841–845 10.1126/science.1193032 - DOI - PMC - PubMed
    1. Tzur, S. , Rosset, S. , Shemer, R. , Yudkovsky, G. , Selig, S. , Tarekegn, A. et al. (2010) Missense mutations in the APOL1 gene are highly associated with end stage kidney disease risk previously attributed to the MYH9 gene. Hum. Genet. 128, 345–350 10.1007/s00439-010-0861-0 - DOI - PMC - PubMed
    1. Daneshpajouhnejad, P. , Kopp, J.B. , Winkler, C.A. and Rosenberg, A.Z . (2022) The evolving story of apolipoprotein L1 nephropathy: the end of the beginning. Nat. Rev. Nephrol. 18, 307–320 10.1038/s41581-022-00538-3 - DOI - PMC - PubMed
    1. Reidy, K.J. , Hjorten, R. and Parekh, R.S . (2018) Genetic risk of APOL1 and kidney disease in children and young adults of African ancestry. Curr. Opin. Pediatr. 30, 252–259 10.1097/MOP.0000000000000603 - DOI - PMC - PubMed
    1. Mena-Gutierrez, A.M. , Reeves-Daniel, A.M. , Jay, C.L. and Freedman, B.I . (2020) Practical considerations for APOL1 genotyping in the living kidney donor evaluation. Transplantation 104, 27–32 10.1097/TP.0000000000002933 - DOI - PMC - PubMed