

Blood Pressure Responses During Exercise Were Associated With Average Home Blood Pressure and Home Blood Pressure Variability: The Electronic Framingham Heart Study
- PMID: 40459124
- PMCID: PMC12229214
- DOI: 10.1161/JAHA.124.039457
Blood Pressure Responses During Exercise Were Associated With Average Home Blood Pressure and Home Blood Pressure Variability: The Electronic Framingham Heart Study
Abstract
Background: Abnormal exercise blood pressure (BP) responses are associated with hypertension and cardiovascular disease, but their relationship with home BP over a mid- to long-term time span is unknown.
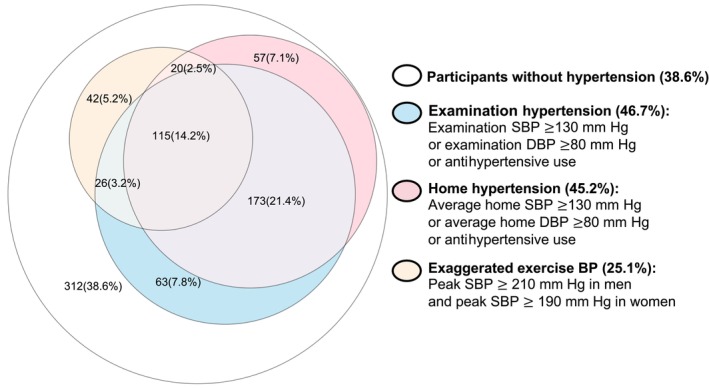
Methods: At an FHS (Framingham Heart Study) research examination (2016-2019), participants underwent maximum incremental ramp cycle ergometry cardiopulmonary exercise testing with BP measured every 2 minutes. At the same exam, English-speaking participants enrolled in the electronic FHS with an iPhone were provided with a digital BP cuff to measure home BP weekly for 1 year. Linear regression models examined associations of exercise BP with average home systolic BP (SBP), home-based hypertension, and week-to-week average real variability of home SBP, over 1-year follow-up. Participants with <3 weeks of BP return were excluded.
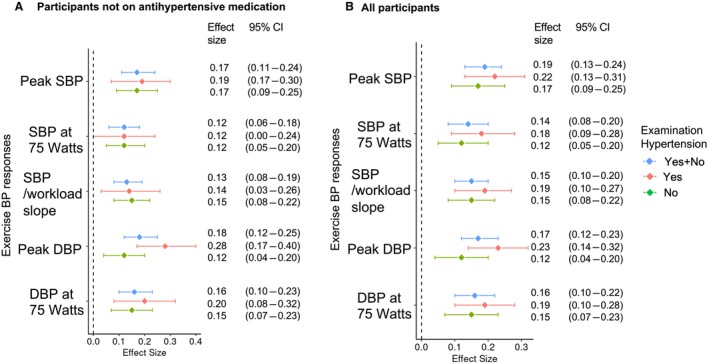
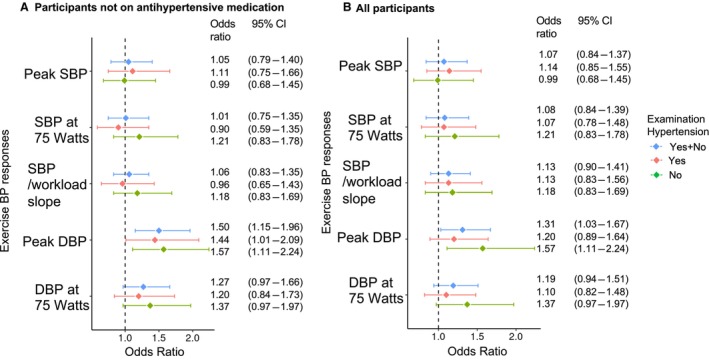
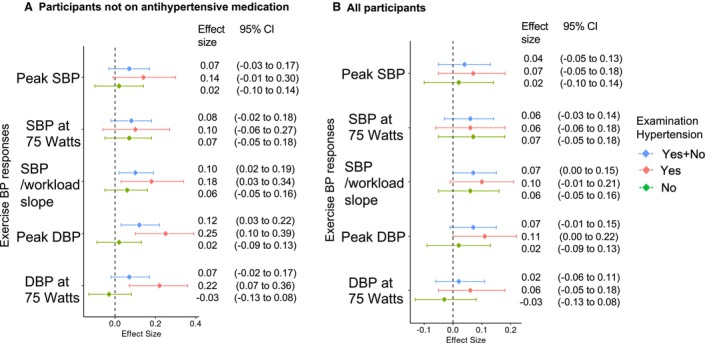
Results: Among 808 participants (mean age, 53 years; 58% women; 92% White individuals; 47% hypertension), higher exercise BP responses (peak SBP, SBP at 75 W, SBP/workload slope, peak diastolic BP, and diastolic BP at 75 W) were associated with higher average home SBP. Higher peak diastolic BP was associated with a greater risk for home hypertension. Additionally, higher SBP/workload slope and peak diastolic BP were associated with elevated average real variability of home SBP only in participants without antihypertensive use.
Conclusions: Higher exercise BP responses were associated with higher average home-based BP, greater home-based hypertension risk, and increased home-based BP variability over a mid- to long-term time span. However, these associations may vary by antihypertensive medication use. Exercise BP may play an important role in hypertension prevention and treatment.
Keywords: blood pressure; exercise; hypertension; mobile health.
Conflict of interest statement
None.
Figures
Similar articles
-
Plasma Proteomics of Exercise Blood Pressure and Incident Hypertension.JAMA Cardiol. 2024 Aug 1;9(8):713-722. doi: 10.1001/jamacardio.2024.1397. JAMA Cardiol. 2024. PMID: 38865108 Free PMC article.
-
Blood pressure response to graded bicycle exercise in males and females across the age and fitness spectrum.Eur J Prev Cardiol. 2025 Jan 6;32(1):43-51. doi: 10.1093/eurjpc/zwae262. Eur J Prev Cardiol. 2025. PMID: 39116385
-
Intensive Home Blood Pressure Lowering in Patients With Advanced CKD.Am J Kidney Dis. 2025 Mar;85(3):320-328. doi: 10.1053/j.ajkd.2024.08.010. Epub 2024 Oct 18. Am J Kidney Dis. 2025. PMID: 39427725 Clinical Trial.
-
Altered dietary salt intake for preventing diabetic kidney disease and its progression.Cochrane Database Syst Rev. 2023 Jan 16;1(1):CD006763. doi: 10.1002/14651858.CD006763.pub3. Cochrane Database Syst Rev. 2023. PMID: 36645291 Free PMC article.
-
Higher blood pressure targets for hypertension in older adults.Cochrane Database Syst Rev. 2024 Dec 17;12(12):CD011575. doi: 10.1002/14651858.CD011575.pub3. Cochrane Database Syst Rev. 2024. PMID: 39688187
References
-
- Shimbo D, Artinian NT, Basile JN, Krakoff LR, Margolis KL, Rakotz MK, Wozniak G; American Heart A , the American Medical A . Self‐measured blood pressure monitoring at home: a joint policy statement from the American Heart Association and American Medical Association. Circulation. 2020;142:e42–e63. doi: 10.1161/CIR.0000000000000803 - DOI - PubMed
-
- Whelton PK, Carey RM, Aronow WS, Casey DE Jr, Collins KJ, Dennison Himmelfarb C, DePalma SM, Gidding S, Jamerson KA, Jones DW, et al. ACC/AHA/AAPA/ABC/ACPM/AGS/APhA/ASH/ASPC/NMA/PCNA guideline for the prevention, detection, evaluation, and management of high blood pressure in adults: a report of the American College of Cardiology/American Heart Association task force on clinical practice guidelines. Hypertension. 2017;71:e13–e115. doi: 10.1161/HYP.0000000000000065 - DOI - PubMed
-
- Lloyd‐Jones DM, Hong Y, Labarthe D, Mozaffarian D, Appel LJ, Van Horn L, Greenlund K, Daniels S, Nichol G, Tomaselli GF, et al. Defining and setting national goals for cardiovascular health promotion and disease reduction: the American Heart Association's strategic impact goal through 2020 and beyond. Circulation. 2010;121:586–613. doi: 10.1161/CIRCULATIONAHA.109.192703 - DOI - PubMed
MeSH terms
LinkOut - more resources
Full Text Sources
Medical
