. 2025 Jul 22;10(7):e0046425.
doi: 10.1128/msystems.00464-25. Epub 2025 Jun 3.

Functional diversification of the MADS-box gene family in fine-tuning the dimorphic transition of Talaromyces marneffei

Affiliations

Functional diversification of the MADS-box gene family in fine-tuning the dimorphic transition of Talaromyces marneffei

Xueyan Hu et al. mSystems. .

Abstract

The dynamic transition between yeast and hypha is a crucial adaptive mechanism for many human pathogenic fungi, including Talaromyces marneffei, a thermodimorphic fungus responsible for causing fatal talaromycosis. In the current study, we elucidated the roles of the MADS-box family in fine-tuning the dimorphic transition in T. marneffei through functional diversification of members. Utilizing adaptive laboratory evolution, we identified an enrichment of MADS-box genes in mutants deficient in yeast-to-mycelium transition. Further phylogenetic analyses revealed a significant expansion of the MADS-box gene family within T. marneffei. Functional genetic manipulations revealed that overexpression of mads9, as opposed to its paralog mads10, effectively delayed the hypha-to-yeast transition. Through integrating RNA sequencing and chromatin immunoprecipitation sequencing, we demonstrated that mads9 and the previously characterized madsA (mads7) modulated the rate of hypha-to-yeast conversion by orchestrating metabolic pathways and membrane dynamics, respectively, with mutual regulation via shared target genes. Our findings illuminated the distinct functional roles of the MADS-box family in regulating dimorphic transitions in T. marneffei, offering new insights into fungal adaptability.

Importance: The dimorphic transition between yeast and hyphal forms in Talaromyces marneffei is a critical adaptive mechanism that underpins its pathogenicity, particularly in response to environmental cues such as temperature. In this study, we elucidated the role of the MADS-box transcription factor family and discovered that its members collaboratively regulate dimorphic transitions by assuming distinct roles in the morphogenesis, enhancing the understanding of the thermal adaptation of T. marneffei and the functional roles of the MADS-box gene family outside the plant.

Keywords: ChIP-seq; MADS-box; RNA-seq; Talaromyces marneffei; dimorphism transition; fungal adaptation.


Conflict of interest statement

The authors declare no conflict of interest.

Figures

Fig 1
Fig 1
Adaptive laboratory evolution inducing dimorphic transition defective strains of T. marneffei PM1. (A) Schematic workflow for isolating three different morphological cell types: mycelium, yeast, and conidia. Mycelium was filtered out using four layers of Miracloth, followed by centrifugation to separate yeast cells from conidia. (B) Flowchart of the experimental evolution inducing dimorphic transition defective strains of T. marneffei. Cells from the Sabouraud dextrose broth (SDB) liquid medium were collected, and yeast cells were isolated using the method depicted in (A) before being inoculated onto Sabouraud dextrose agar (SDA) plates to confirm their growth morphology. If substantial mycelium was present, cultures were maintained at the original temperature in SDB; if the predominant form was yeast, the incubation temperature was lowered by 1°C, continuing in SDB. This selection process was repeated until the culture temperature was reduced to 25°C.
Fig 2
Fig 2
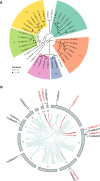
Phylogenetic analysis and synteny of the MADS-box family in T. marneffei. (A) Phylogenetic tree of the MADS-box gene family in the Talaromyces genus. The type of point (solid or hollow) represents the support rate. (B) Synteny analysis of the MADS-box gene family in T. marneffei. The outer layer represents the genomic sequences of wild-type strain PM1, with the locations of all MADS-box transcription factors annotated. The inner layer indicates the syntenic regions of the PM1 genome, with red highlighting the syntenic regions containing MADS-box transcription factors.
Fig 3
Fig 3
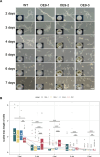
Overexpression of mads9 promoted morphogenesis of yeast cells in T. marneffei. (A) Microscopic images were acquired under 20× objective lens with phase contrast effect. Bar = 20 µm. Time-course phenotypes of colonies grown on SDA plates under 37°C were shown as insets. Bar = 1 mm. (B) Comparison of cell length during static culture at 37°C. Comparisons among different groups were performed using Wilcoxon rank-sum tests. Box plots represent median values and upper quartile (Q3) and lower quartile (Q1). Diamond dots represent mean values. ***, P < 0.001; **, P < 0.01; *, P < 0.05.
Fig 4
Fig 4
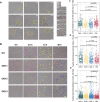
Overexpression of mads9 delayed the M-to-Y transition in T. marneffei. (A) Time-course microscopic analysis of the morphological changes in the wild-type cells grown in SDB transferred from 25°C to 37°C. Bar in the left panel is 50 µm. The highlighted region of interest in the left panel was magnified artificially and shown in the right panel. Bar = 25 µm. (B) Microscopic analysis of the morphological changes in the wild-type and the OE-mads9 cells grown in SDB transferred from 25°C to 37°C at indicated time points. Purple arrowheads indicated the swelling cell tips. Note that the ratio of swelling tips to the total cell ends visible in the wild-type was bigger than those in the OE-mads9 strains. Yellow arrowheads pointed toward the bumpy cell surfaces with newly formed protrusions. Blue dotted lines labeled the longer cell remained in the OE-mads9 strains. Bar = 50 µm. (C) The rate of expansion at the hyphal tip at 3.5 hpt of OE-mads9 and wild-type PM1. The rate of expansion at the hyphal tip describes the speed at which the leading edge of a fungal hypha grows and extends, reflecting the dynamic processes of cell wall synthesis and extension during fungal growth. The upper and lower boundaries of the box represent the upper quartile (Q3) and lower quartile (Q1) of the data. The line in the middle of the box represents the median. Whiskers represent the minimum and maximum non-outlier values extending from the box to the data (interquartile range = Q3 − Q1). (D) Hyphal branching proximity index at 12 hpt of OE-mads9 and wild-type PM1. The hyphal branching proximity index measures the closeness of branching points along the fungal hyphae, shedding light on the spatial arrangement and growth patterns. (E) Hyphal branching distance index at 48 hpt of OE-mads9 and wild-type PM1. The hyphal branching distance index quantifies the average distance between branching points on fungal hyphae, offering insights into growth dynamics and network expansiveness.
Fig 5
Fig 5
Differential gene expression analysis of MADS-box mutant strains in T. marneffei. (A) RNA-seq gene expression clustering of mutant and wild-type strains. The color code of the heatmap represents the z-scored gene expression level. The correlation of gene expression patterns and levels between biologically repeated samples was consistent. (B) Differential gene expression analysis of madsA and mads9 mutant strains. The Venn diagram displayed the count of unique and common differentially expressed genes (DEGs) between mutant strains and PM1 under two conditions. (C) Enrichment results of differentially expressed genes in the mycelial and yeast phase. The size of the point represents the count of DEGs, and the gradual color change from red to blue represents the adjusted P-value change from low to high.
Fig 6
Fig 6
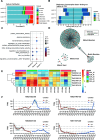
Gene regulatory network of the MADS-box family. (A) Genome-wide binding patterns of MADS-box transcription factors. The ChIP-seq peaks are divided into several categories: promoter, first exon, other exons, first intron, other introns, 5´ untranslated region (5´ UTR), 3´ untranslated region (3´ UTR), downstream intergenic (within 300 bp of the 3´ UTR), and distal intergenic (>300 bp of the 3´ UTR) regions. (B) Distribution of MADS-box transcription factor binding sites relative to transcription start sites. (C) Functional enrichment of target genes of MADS-box transcription factors. The size of the point represents the count of target genes, and the gradual color change from red to blue represents the adjusted P-value change from low to high. (D) Downstream regulatory network of MADS-box transcription factors. Each point represents a gene, with colors indicating the group to which the gene belongs: MADS-box transcription factors, other transcription factors, or additional genes. The lines illustrate the regulatory relationships between gene pairs. (E) Heatmap of six genes was found to be co-regulated by mads9 and madsA, with the z-score normalized expression levels indicated by the color bar (red indicating a relatively higher expression level and blue indicating a lower expression level). (F) Expression levels of four co-regulated genes by mads9 and madsA during dynamic dimorphic transition. Red represents the transformation from the mycelial phase to the yeast phase (M to Y), and blue represents the transformation from the yeast phase to the hyphal phase (Y to M). The dots represent the normalized mean expression of three biological replicates at the same time, and the shading represents the standard error range. The horizontal axis is time points. TPM, transcripts per million.

Similar articles

References

    1. Boyce KJ, Andrianopoulos A. 2015. Fungal dimorphism: the switch from hyphae to yeast is a specialized morphogenetic adaptation allowing colonization of a host. FEMS Microbiol Rev 39:797–811. doi: 10.1093/femsre/fuv035 - DOI - PubMed
    1. Xiao W, Zhang J, Huang J, Xin C, Li MJ, Song Z. 2022. Response and regulatory mechanisms of heat resistance in pathogenic fungi. Appl Microbiol Biotechnol 106:5415–5431. doi: 10.1007/s00253-022-12119-2 - DOI - PMC - PubMed
    1. Seidel D, Wurster S, Jenks JD, Sati H, Gangneux J-P, Egger M, Alastruey-Izquierdo A, Ford NP, Chowdhary A, Sprute R, Cornely O, Thompson GR 3rd, Hoenigl M, Kontoyiannis DP. 2024. Impact of climate change and natural disasters on fungal infections. Lancet Microbe 5:e594–e605. doi: 10.1016/S2666-5247(24)00039-9 - DOI - PubMed
    1. Greenspan SE, Roznik EA, Edwards L, Duffy R, Berger L, Bower DS, Pike DA, Schwarzkopf L, Alford RA. 2023. Constant-temperature predictions underestimate growth of a fungal amphibian pathogen under individual host thermal profiles. J Therm Biol 111:103394. doi: 10.1016/j.jtherbio.2022.103394 - DOI - PubMed
    1. Nierman WC, Fedorova-Abrams ND, Andrianopoulos A. 2015. Genome sequence of the AIDS-associated pathogen Penicillium marneffei (ATCC18224) and its near taxonomic relative Talaromyces stipitatus (ATCC10500). Genome Announc 3:e01559-14. doi: 10.1128/genomeA.01559-14 - DOI - PMC - PubMed

MeSH terms

Supplementary concepts

LinkOut - more resources