

A Comprehensive Drift-Adaptive Framework for Sustaining Model Performance in COVID-19 Detection From Dynamic Cough Audio Data: Model Development and Validation
- PMID: 40459919
- PMCID: PMC12174887
- DOI: 10.2196/66919
A Comprehensive Drift-Adaptive Framework for Sustaining Model Performance in COVID-19 Detection From Dynamic Cough Audio Data: Model Development and Validation
Abstract
Background: The COVID-19 pandemic has highlighted the need for robust and adaptable diagnostic tools capable of detecting the disease from diverse and continuously evolving data sources. Machine learning models, particularly convolutional neural networks, are promising in this regard. However, the dynamic nature of real-world data can lead to model drift, where the model's performance degrades over time, as the underlying data distribution changes due to evolving disease characteristics, demographic shifts, and variations in recording conditions. Addressing this challenge is crucial to maintaining the accuracy and reliability of these models in ongoing diagnostic applications.
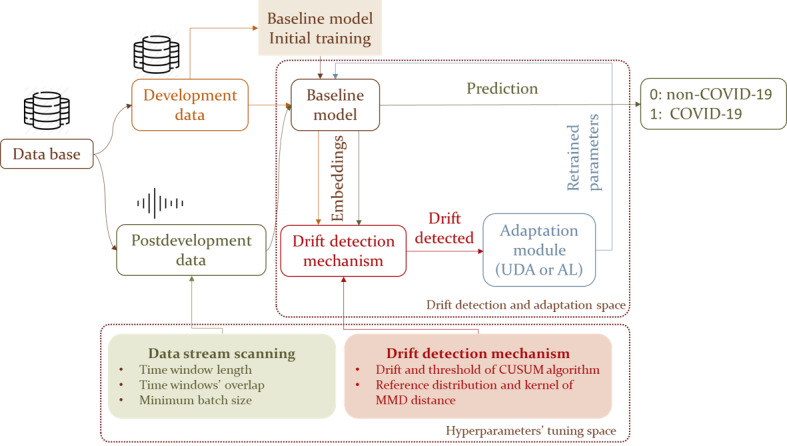
Objective: This study aims to develop a comprehensive framework that not only monitors model drift over time but also uses adaptation mechanisms to mitigate performance fluctuations in COVID-19 detection models trained on dynamic cough audio data.
Methods: Two crowdsourced COVID-19 audio datasets, namely COVID-19 Sounds and Coswara, were used for development and evaluation purposes. Each dataset was divided into 2 distinct periods, namely the development period and postdevelopment period. A baseline convolutional neural network model was initially trained and evaluated using data (ie, coughs from COVID-19 Sounds and shallow coughs from Coswara dataset) from the development period. To detect changes in data distributions and the model's performance between these periods, the maximum mean discrepancy distance was used. Upon detecting significant drift, a retraining procedure was triggered to update the baseline model. The study explored 2 model adaptation approaches, unsupervised domain adaptation and active learning, both of which were comparatively assessed.
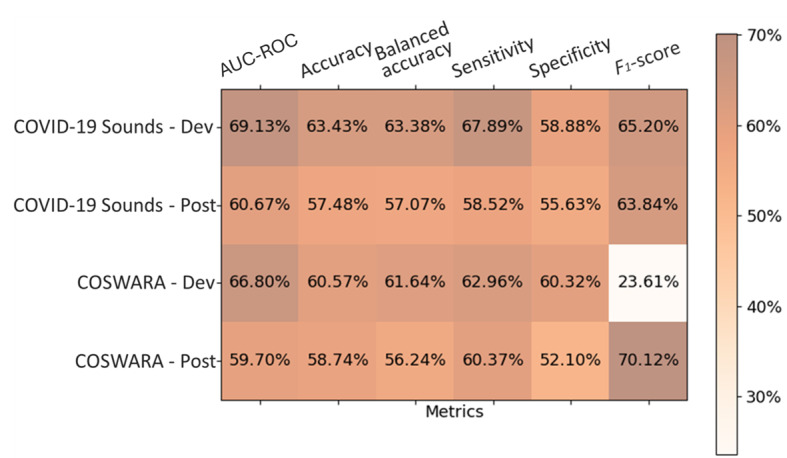
Results: The baseline model achieved an area under the receiver operating characteristic curve of 69.13% and a balanced accuracy of 63.38% on the development test set of the COVID-19 Sounds dataset, while for the Coswara dataset, the corresponding values were 66.8% and 61.64%. A decline in performance was observed when the model was evaluated on data from the postdevelopment period, indicating the presence of model drift. The application of the unsupervised domain adaptation approach led to performance improvement in terms of balanced accuracy by up to 22% and 24% for the COVID-19 Sounds and Coswara datasets, respectively. The active learning approach yielded even greater improvement, corresponding to a balanced accuracy increase of up to 30% and 60% for the 2 datasets, respectively.
Conclusions: The proposed framework successfully addresses the challenge of model drift in COVID-19 detection by enabling continuous adaptation to evolving data distributions. This approach ensures sustained model performance over time, contributing to the development of robust and adaptable diagnostic tools for COVID-19 and potentially other infectious diseases.
Keywords: COVID-19 detection; active learning; data distribution shift; machine learning; maximum mean discrepancy; model degradation; unsupervised domain adaptation.
©Theofanis Ganitidis, Maria Athanasiou, Konstantinos Mitsis, Konstantia Zarkogianni, Konstantina S Nikita. Originally published in the Journal of Medical Internet Research (https://www.jmir.org), 03.06.2025.
Conflict of interest statement
Conflicts of Interest: None declared.
Figures


References
-
- Lee S, Kim S, Yoon DS, Park JS, Woo H, Lee D, Cho SY, Park C, Yoo YK, Lee KB, Lee JH. Sample-to-answer platform for the clinical evaluation of COVID-19 using a deep learning-assisted smartphone-based assay. Nat Commun. 2023 Apr 24;14(1):2361. doi: 10.1038/s41467-023-38104-5. https://doi.org/10.1038/s41467-023-38104-5 10.1038/s41467-023-38104-5 - DOI - PMC - PubMed
-
- Levy J, Álvarez D, Del Campo F, Behar JA. Deep learning for obstructive sleep apnea diagnosis based on single channel oximetry. Nat Commun. 2023 Aug 12;14(1):4881. doi: 10.1038/s41467-023-40604-3. https://doi.org/10.1038/s41467-023-40604-3 10.1038/s41467-023-40604-3 - DOI - PMC - PubMed
-
- Al-Absi HR, Pai A, Naeem U, Mohamed FK, Arya S, Sbeit RA, Bashir M, El Shafei MM, El Hajj N, Alam T. DiaNet v2 deep learning based method for diabetes diagnosis using retinal images. Sci Rep. 2024 Jan 18;14(1):1595. doi: 10.1038/s41598-023-49677-y. https://doi.org/10.1038/s41598-023-49677-y 10.1038/s41598-023-49677-y - DOI - PMC - PubMed
-
- Sampath K, Rajagopal S, Chintanpalli A. A comparative analysis of CNN-based deep learning architectures for early diagnosis of bone cancer using CT images. Sci Rep. 2024 Jan 25;14(1):2144. doi: 10.1038/s41598-024-52719-8. https://doi.org/10.1038/s41598-024-52719-8 10.1038/s41598-024-52719-8 - DOI - PMC - PubMed
-
- Athanasiou M, Sfrintzeri K, Zarkogianni K, Thanopoulou AC, Nikita KS. An explainable XGBoost–based approach towards assessing the risk of cardiovascular disease in patients with type 2 diabetes mellitus. Proceedings of the IEEE 20th International Conference on Bioinformatics and Bioengineering; BIBE 2020; October 26-28, 2020; Cincinnati, OH. 2020. - DOI
Publication types
MeSH terms
LinkOut - more resources
Full Text Sources
Medical
