. 2025 Jun 17;19(23):21538-21555.
doi: 10.1021/acsnano.5c03590. Epub 2025 Jun 3.

Rational Design of Safer Inorganic Nanoparticles via Mechanistic Modeling-Informed Machine Learning

Affiliations

Rational Design of Safer Inorganic Nanoparticles via Mechanistic Modeling-Informed Machine Learning

Joseph Cave et al. ACS Nano. .

Abstract

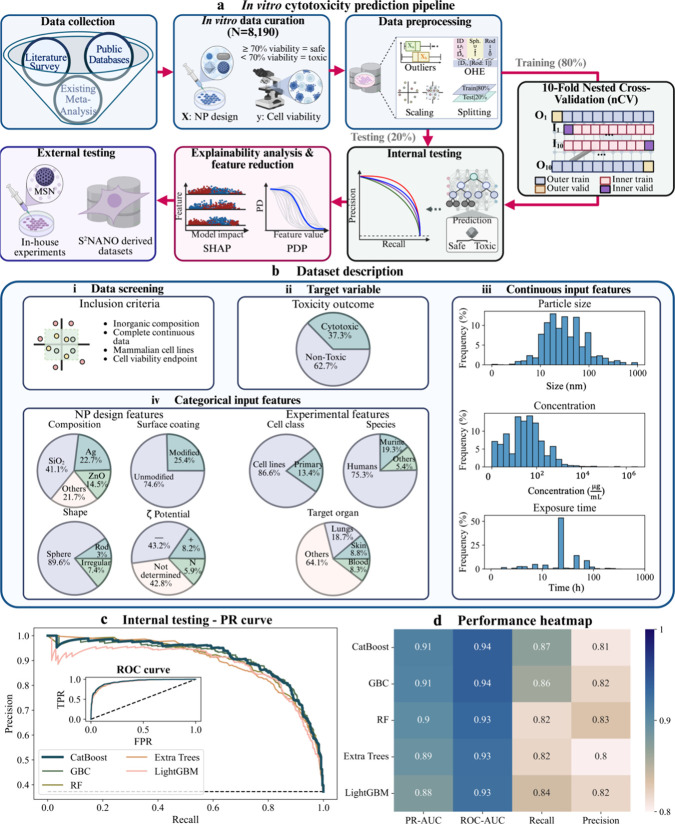
The safety of inorganic nanoparticles (NPs) remains a critical challenge for their clinical translation. To address this, we developed a machine learning (ML) framework that predicts NP toxicity both in vitro and in vivo, leveraging physicochemical properties and experimental conditions. A curated in vitro cytotoxicity dataset was used to train and validate binary classification models, with top-performing models undergoing explainability analysis to identify key determinants of toxicity and establish structure-toxicity relationships. External testing with diverse inorganic NPs validated the predictive accuracy of the framework for in vitro settings. To enable organ-specific toxicity predictions in vivo, we integrated a physiologically based pharmacokinetic (PBPK) model into the ML pipeline to quantify NP exposure across organs. Retraining the ML models with PBPK-derived exposure metrics yielded robust predictions of organ-specific nanotoxicity, further validating the framework. This PBPK-informed ML approach can thus serve as a potential alternative approach to streamline NP safety assessment, enabling the rational design of safer NPs and expediting their clinical translation.

Keywords: PBPK; artificial intelligence; cytotoxicity; machine learning; mathematical modeling; nanoparticle; nanotoxicity.


Figures

1
1
In vitro nanotoxicity prediction pipeline, dataset characterization, and machine learning (ML) model testing. (a) The workflow for in vitro cytotoxicity predictions begins with data collection, resulting in a curated dataset of 8190 samples. Data preprocessing includes harmonization of physicochemical descriptors, toxicity classification, scaling, and one-hot encoding for ML model training and testing. The dataset is split into 80% training and 20% test subsets, with a nested cross-validation (nCV) framework applied to the training set. Internal testing is performed on the reserved test subset. Explainability analyses are employed to identify key toxicity drivers. External testing is performed by using in-house experimental data based on mesoporous silica nanoparticles (MSNs) and additional curated data from the S2NANO repository. (b) Dataset description and feature distributions. (i) Data inclusion criteria focus on studies reporting complete descriptors for inorganic NPs, including physicochemical properties, experimental conditions, and cell viability as a toxicity end point. (ii) Distribution of the target variable shows that 37.3% of samples were classified as cytotoxic, while 62.7% were nontoxic. (iii) Continuous input features include particle size, administered concentration, and exposure time, showcasing the wide variability in experimental conditions. (iv) Categorical input features include NP composition, surface coatings, ζ-potential, shape, cell class (primary or cell lines), and target organ. (c) Internal testing results. Precision-recall (PR) curves demonstrate the performance of top ML models, including CatBoost, gradient boosting classifier (GBC), random forest (RF), extra trees, and LightGBM. The inset receiver operating characteristic (ROC) curve shows true positive rates (TPR) versus false positive rates (FPR). Dashed black line in PR curve plot denotes the baseline precision for random guessing, while in the ROC curve plot it represents random classifier performance (FPR = TPR). (d) Heatmap summarizing key testing metrics (PR-AUC, ROC-AUC, recall, and precision) for the best-performing models, highlighting the strong predictive capabilities of boosting and tree-based algorithms.
2
2
Explainability analysis, feature reduction, and internal testing of the reduced-feature models. (a) SHapley Additive exPlanations (SHAP) analysis for CatBoost, visualized as a beeswarm plot. Each point represents an individual prediction, highlighting the direction and magnitude of each feature’s contribution to NP toxicity classification. Higher SHAP values indicate greater importance, with features like concentration, composition, and particle size emerging as the most influential determinants of toxicity. (b) SHAP consensus rankings across the top-performing models (CatBoost, GBC, RF, extra trees, LightGBM). The heatmap highlights high inter-model agreement, with concentration, composition, and particle size consistently ranked as the top three predictors. (c) Iterative feature reduction results for CatBoost, visualizing changes in PR-AUC (i), ROC-AUC (ii), recall (iii), and precision (iv) as features are added in descending order of SHAP importance. The dashed black line denotes the point of performance saturation, beyond which adding additional features provides minimal improvement in predictive performance. (d) Internal testing of top-performing models using the reduced-feature set, evaluated through PR curves and ROC curves. The PR curves demonstrate strong predictive power with minimal loss compared to full-feature models, while the inset highlights ROC curves for these models. Dashed black line in PR curve plot denotes the baseline precision for random guessing, while in ROC curve plot, it represents random classifier performance (FPR = TPR). (e) Performance heatmap summarizing internal testing metrics (PR-AUC, ROC-AUC, recall, precision) for top-performing models with reduced features.
3
3
Feature-specific explainability analysis to inform NP safety-by-design strategies. (a–c) Partial dependence plots (PDPs) depict the marginal effects of continuous featuresNP concentration (a), exposure time (b), and particle size (c)on predicted toxicity probabilities, holding all other features constant. Black dots represent data points, solid blue lines indicate model fits, and red dashed lines denote 95% confidence intervals. Empirical functions are provided to describe the observed trends. (d–f) SHAP summary plots illustrate the contribution of categorical featuresζ-potential (d), NP composition (e), and surface coating (f)to toxicity predictions. Positive SHAP values indicate an increased probability of cytotoxicity, whereas negative values suggest reduced toxicity.
4
4
In vitro cytotoxicity data generation and external testing of ML model generalizability. (a) Overview of test data sources, comprising in-house cytotoxicity experiments (N = 63) and additional external testing data from the rigorously curated S2NANO repository (N = 454), resulting in a combined external dataset (N = 517) for testing. (b) Experimental workflow for in-house cytotoxicity studies: (i) MSN synthesis using sol–gel fabrication and subsequent functionalization with lipid or polyethylenimine (PEI) coatings; (ii) characterization of MSNs by hydrodynamic size and ζ-potential measurements; (iii) cell viability assays performed on human cell lines (REH, 42D, MR49F) using ATP-based luminescence readings following NP exposure; (iv) hemolysis assays involving red blood cell (RBC) isolation and NP exposure, with phosphate buffer saline (PBS, negative control) and distilled water (DI water, positive control) validating assay accuracy. (c) Dataset description: (i) distribution of categorical input features, including NP composition, surface coating, ζ-potential, species, and target organ; (ii) continuous feature distributions for particle size, concentration, and exposure time. (d) External testing results presented as PR and ROC curves for the top-performing models (CatBoost, gradient boosting classifier (GBC), random forest (RF), extra trees, LightGBM) and the ensemble model. The dashed black line in the PR curve plot denotes the baseline precision for random guessing, while in the ROC curve plot, it represents random classifier performance (FPR = TPR). (e) Performance heatmap summarizing metrics, including PR-AUC, ROC-AUC, recall, and precision, highlighting the robust external testing and generalizability of the ensemble model, which achieved high recall and overall strong predictive performance.
5
5
PBPK-ML framework for predicting in vivo nanotoxicity. (a) Overview of the PBPK-ML model integration pipeline. Data curation involved selecting 390 samples based on inclusion criteria, including NP composition, murine/rodent models, and time-series biodistribution data. Time-averaged NP concentrations derived from the PBPK model were incorporated into retrained ML models previously optimized for in vitro predictions. (b) Schematic of the minimal PBPK model, illustrating NP biodistribution across organs (plasma, spleen, liver, kidneys, lungs, and others) and clearance via feces and urine following intravenous (IV), subcutaneous (SC), oral (PO), or intraperitoneal (IP) administration. (c) In vivo dataset description: (i) toxicity outcomes, showing a majority (83.8%) with no observed toxicity; (ii) categorical input features, including NP composition, surface coating, ζ-potential, species, and target organs; (iii) Continuous input features, such as particle size, concentration, and exposure time. (d) Representative PBPK model concentration kinetics fits for gold nanorods (AuNR) with various surface coatings, showing excellent agreement with experimental data (Pearson correlation coefficients > 0.98). (e) Internal testing results for PBPK-ML models using PR and ROC curves, highlighting the performance of the top algorithms. Dashed black line in PR curve plot denotes the baseline precision for random guessing, while in ROC curve plot, it represents random classifier performance (FPR = TPR). (f) Performance heatmap showing key metrics (PR-AUC, ROC-AUC, recall, and precision) for individual models and the ensemble model. The ensemble model achieved the highest accuracy, with PR-AUC = 0.93 and recall = 1.00, demonstrating the robustness of the PBPK-ML framework for organ-specific nanotoxicity predictions.

Update of

Similar articles

References

    1. Luther D. C., Huang R., Jeon T., Zhang X., Lee Y. W., Nagaraj H., Rotello V. M.. Delivery of drugs, proteins, and nucleic acids using inorganic nanoparticles. Adv. Drug Deliv Rev. 2020;156:188–213. doi: 10.1016/j.addr.2020.06.020. - DOI - PMC - PubMed
    1. Mitchell M. J., Billingsley M. M., Haley R. M., Wechsler M. E., Peppas N. A., Langer R.. Engineering precision nanoparticles for drug delivery. Nat. Rev. Drug Discovery. 2021;20(2):101–124. doi: 10.1038/s41573-020-0090-8. - DOI - PMC - PubMed
    1. Dong E., Huo Q., Zhang J., Han H., Cai T., Liu D.. Advancements in nanoscale delivery systems: optimizing intermolecular interactions for superior drug encapsulation and precision release. Drug Delivery and Translational Research. 2025;15(1):7–25. doi: 10.1007/s13346-024-01579-w. - DOI - PubMed
    1. da Cruz Schneid A., Albuquerque L. J. C., Mondo G. B., Ceolin M., Picco A. S., Cardoso M. B.. Colloidal stability and degradability of silica nanoparticles in biological fluids: a review. J. Sol-Gel Sci. Technol. 2022;102(1):41–62. doi: 10.1007/s10971-021-05695-8. - DOI
    1. Sanna V., Sechi M.. Therapeutic Potential of Targeted Nanoparticles and Perspective on Nanotherapies. ACS Med. Chem. Lett. 2020;11(6):1069–1073. doi: 10.1021/acsmedchemlett.0c00075. - DOI - PMC - PubMed

Substances

LinkOut - more resources