. 2025 Jun 17;6(6):102141.
doi: 10.1016/j.xcrm.2025.102141. Epub 2025 Jun 3.

Fc-optimized anti-CTLA-4 antibodies increase tumor-associated high endothelial venules and sensitize refractory tumors to PD-1 blockade

Affiliations

Fc-optimized anti-CTLA-4 antibodies increase tumor-associated high endothelial venules and sensitize refractory tumors to PD-1 blockade

Lucas Blanchard et al. Cell Rep Med. .

Abstract

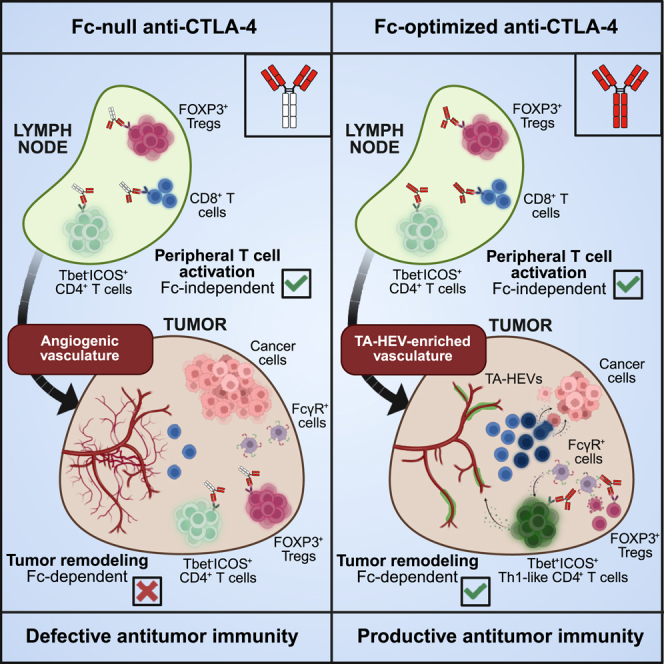
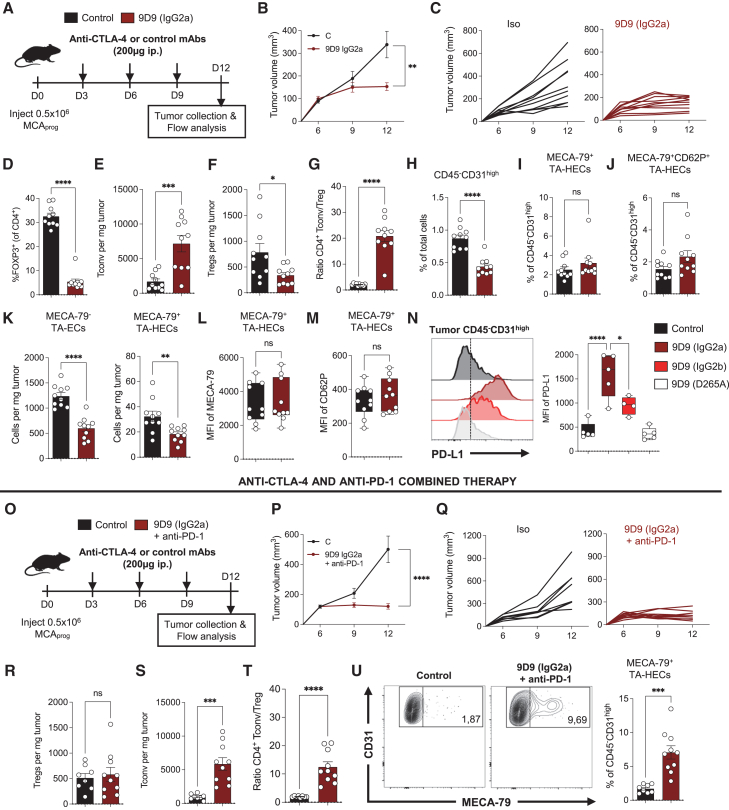
The lack of T cells in tumors is a major hurdle to successful immune checkpoint therapy (ICT). Therefore, therapeutic strategies promoting T cell recruitment into tumors are warranted to improve the treatment efficacy. Here, we report that Fc-optimized anti-cytotoxic T lymphocyte antigen 4 (CTLA-4) antibodies are potent remodelers of tumor vasculature that increase tumor-associated high endothelial venules (TA-HEVs), specialized blood vessels supporting lymphocyte entry into tumors. Mechanistically, this effect is dependent on the Fc domain of anti-CTLA-4 antibodies and CD4+ T cells and involves interferon gamma (IFNγ). Unexpectedly, we find that the human anti-CTLA-4 antibody ipilimumab fails to increase TA-HEVs in a humanized mouse model. However, increasing its Fc effector function rescues the modulation of TA-HEVs, promotes CD4+ and CD8+ T cell infiltration into tumors, and sensitizes recalcitrant tumors to programmed cell death protein 1 (PD-1) blockade. Our findings suggest that Fc-optimized anti-CTLA-4 antibodies could be used to reprogram tumor vasculature in poorly immunogenic cold tumors and improve the efficacy of ICT.

Keywords: CTLA-4; Fc receptors; antibody engineering; cancer immunotherapy; high endothelial venule; ipilimumab; lymphocyte trafficking; tumor blood vessels; tumor microenvironment; tumor-infiltrating lymphocytes.


Conflict of interest statement

Declaration of interests J.V.R. is an inventor on a patent (WO2019125846A1) describing the GAALIE variant and its use for therapeutic monoclonal antibodies.

Figures

None
Graphical abstract
Figure 1
Figure 1
Anti-CTLA-4 antibodies remodel tumor vasculature and increase TA-HEVs through Fc-dependent mechanisms (A) Treatment schedule. i.p., intraperitoneal; IF, immunofluorescence; control, isotype control antibodies. (B) Mean tumor growth (n = 9 mice per group; data pooled from two independent experiments). (C) Gating strategy for CD45CD31high endothelial cells and MECA-79+ TA-HECs. (D and E) Frequencies of CD45CD31high endothelial cells and TA-HECs. Each symbol represents an individual mouse (n = 9, two independent experiments). (F and G) Mean fluorescence intensity (MFI) of MECA-79 and CD62P in TA-HECs, quantified by flow cytometry. Each symbol represents an individual mouse (n = 9, two independent experiments). (H and I) Immunofluorescence of MCAprog tumor (day 12) following treatment with 9D9 mouse anti-CTLA-4 antibody. Selected markers are presented. Scale bars: 100 μm. (J) Schematics of the two distinct 9D9 anti-CTLA-4 antibodies used in the study. (K and L) Mean tumor growth and tumor weights in individual mice (n = 15 mice per group; data pooled from three independent experiments). (M–O) Frequencies of CD45CD31high endothelial cells, TA-HECs, and MECA-79+CD62P+ TA-HECs. Each symbol represents an individual mouse (n = 15, three independent experiments). Representative dot plots of TA-HECs are shown (N). (P and Q) MFI of MECA-79 and CD62P in TA-HECs, quantified by flow cytometry. Each symbol represents an individual mouse (n = 15, three independent experiments). (R) Numbers of tumor-infiltrating CD4+ and CD8+ T cells. Each symbol represents an individual mouse (n = 15, three independent experiments). Data are shown as mean ± SEM. All p values were determined by one-way ANOVA with Tukey’s multiple comparison test, except for (B) and (K) for which p values were determined by two-way ANOVA with Dunnett’s multiple comparison test. See also Figures S1 and S2.
Figure 2
Figure 2
Tbet+ICOS+ Th1-like CD4+ T cells correlate with TA-HEVs during anti-CTLA-4 therapy (A–C) Frequency of FOXP3+ Tregs and numbers of FOXP3 Tconv and FOXP3+ Tregs in tumors following indicated treatments. Representative dot plots of FOXP3+ Tregs are shown (A). Each symbol represents an individual mouse (n = 15, three independent experiments). (D) Ratio of Tconv to Treg cell numbers in tumors following indicated treatments. Each symbol represents an individual mouse (n = 15, three independent experiments). (E) Mean fluorescence intensity (MFI) of selected markers in Tregs, quantified by flow cytometry. Each symbol represents an individual mouse (FOXP3, Tbet, PD-1, and ICOS, n = 15, three independent experiments; CTLA-4 and CD39, n = 7–8, two independent experiments). (F) Frequency of CTLA-4+CD25+ Tregs in tumors following indicated treatments. Representative dot plots are shown. Each symbol represents an individual mouse (n = 7–8, two independent experiments). (G) MFI of selected markers in Tconv, quantified by flow cytometry. Each symbol represents an individual mouse (n = 15, three independent experiments). (H and I) Frequency and number of Tbet+ICOS+ Th1-like CD4+ T cells in tumors following indicated treatments. Representative dot plots are shown (H). Each symbol represents an individual mouse (n = 15, three independent experiments). (J) Frequency of Ki67high cells in Tbet+ICOS+ Th1-like CD4+ T cells in tumors following indicated treatments. Each symbol represents an individual mouse (n = 15, three independent experiments). (K and L) Correlation analysis between the number of tumor-infiltrating Tbet+ICOS+ Th1-like CD4+ T cells and the frequencies of CD45CD31high endothelial cells or MECA-79+ TA-HECs. Each symbol represents an individual mouse, and simple linear regression lines are shown in red (data pooled from six independent experiments; n = 30 mice treated with 9D9 or 9H10 anti-CTLA-4 antibodies). p values and Pearson’s r were determined by Pearson correlation test. (M) Histograms showing expression of PD-1 in TbetICOS (DN), TbetICOS+ (SP), and Tbet+ICOS+ (DP) FOXP3 Tconv from MCAprog tumors (day 12) following treatment with 9D9 anti-CTLA-4 antibody, quantified by flow cytometry. MFI of PD-1 is quantified in indicated subsets. Each symbol represents an individual mouse (n = 15, three independent experiments). (N) Frequency of IFNγ+ cells in CD44+PD-1+ CD4+ T cells stimulated ex vivo, following indicated treatments. Each symbol represents an individual mouse (n = 9, two independent experiments). Data are shown as mean ± SEM. All p values were determined by one-way ANOVA with Tukey’s multiple comparison test except for graphs in (E)–(G) and (N) for which p values were determined by unpaired two-tailed Student’s t test. See also Figures S3–S5.
Figure 3
Figure 3
CD4+ T cells are important for the increase of TA-HEVs during anti-CTLA-4 therapy (A) Treatment schedule. i.p., intraperitoneal; control, isotype control antibodies. (B and C) Frequencies of CD45CD31high endothelial cells and MECA-79+ TA-HECs. Each symbol represents an individual mouse (n = 8–9, two independent experiments). (D and E) Number of tumor-infiltrating CD8+ T cells and frequency of Ki67high cells in tumor-infiltrating CD8+ T cells. Each symbol represents an individual mouse (n = 8–9, two independent experiments). (F and G) Frequency of PD-1high cells in tumor-infiltrating CD44+ CD8+ T cells following indicated treatments, and mean fluorescence intensity (MFI) of PD-1 in the same subset, quantified by flow cytometry. Representative dot plots are shown (F). Each symbol represents an individual mouse (n = 8–9, two independent experiments). (H and I) Frequency and number of GzmB+ cells in tumor-infiltrating CD44+PD-1+ CD8+ T cells. Representative dot plots are shown (H). Each symbol represents an individual mouse (n = 8–9, two independent experiments). (J) Treatment schedule. i.p., intraperitoneal; control, isotype control antibodies. (K–Q) Frequencies of CD45CD31high endothelial cells, TA-HECs, MECA-79+CD62P+ TA-HECs, number of TA-HECs, and MFI of MECA-79 and CD62P in TA-HECs, following indicated treatments, quantified by flow cytometry. Each symbol represents an individual mouse (n = 10, two independent experiments). (R and S) Numbers of tumor-infiltrating CD4+ and CD8+ T cells, and frequency of Ki67high cells in tumor-infiltrating CD8+ T cells. Each symbol represents an individual mouse (n = 10, two independent experiments). Data are shown as mean ± SEM. All p values were determined by one-way ANOVA with Tukey’s multiple comparison test except for graphs in (K)–(S) for which p values were determined by unpaired two-tailed Student’s t test. See also Figures S6 and S7.
Figure 4
Figure 4
Fc-enhanced mouse anti-CTLA-4 antibodies prune TA-HEVs in the absence of concurrent PD-1 blockade (A) Treatment schedule. i.p., intraperitoneal; control, isotype control antibodies. (B and C) Mean and individual tumor growth. Data were obtained from two independent experiments (n = 10 mice per group). (D–G) Frequency of FOXP3+ Tregs in tumor, numbers of tumor-infiltrating FOXP3+ Tregs and FOXP3 Tconv, and ratio of Tconv to Treg cell numbers in tumors following indicated treatments. Each symbol represents an individual mouse (n = 10, two independent experiments). (H–M) Frequencies of CD45CD31high endothelial cells, TA-HECs, MECA-79+CD62P+ TA-HECs, numbers of TA-ECs and TA-HECs, and mean fluorescence intensity (MFI) of MECA-79 and CD62P in TA-HECs, following indicated treatments, quantified by flow cytometry. Each symbol represents an individual mouse (n = 10, two independent experiments). (N) Histograms showing expression of PD-L1 in CD45CD31high tumor endothelial cells following indicated treatments, quantified by flow cytometry. MFI of PD-L1 is quantified. Each symbol represents an individual mouse (n = 4–5). (O) Treatment schedule. i.p., intraperitoneal; control, isotype control antibodies. (P and Q) Mean and individual tumor growth. Data were obtained from two independent experiments (control, n = 8 mice; 9D9-IgG2a + anti-PD-1, n = 10 mice). (R–T) Numbers of tumor-infiltrating FOXP3+ Tregs and FOXP3 Tconv, and ratio of Tconv to Tregs cell numbers in tumors following indicated treatments. Each symbol represents an individual mouse (n = 8–10, two independent experiments). (U) Frequency of TA-HECs. Representative dot plots of TA-HECs are shown. Each symbol represents an individual mouse (n = 8–10, two independent experiments). Data are shown as mean ± SEM. All p values were determined by unpaired two-tailed Student’s t test except for graph in (N) for which p values were determined by one-way ANOVA with Tukey’s multiple comparison test, and for (B) and (P) for which p values were determined by two-way ANOVA. See also Figures S8–S10.
Figure 5
Figure 5
The human anti-CTLA-4 antibody ipilimumab requires increased Fc effector function to modulate TA-HEVs in humanized mice (A) Treatment schedule. i.p., intraperitoneal; control, isotype control antibodies. (B) Tumor weights in individual mice. Each symbol represents an individual mouse (n = 9, two independent experiments). (C and D) Frequencies of FOXP3+ Tregs in tumor-draining lymph nodes (TDLNs) and tumors following indicated treatments. Each symbol represents an individual mouse (n = 9, two independent experiments). (E) Frequency of TA-HECs. Each symbol represents an individual mouse (n = 9, two independent experiments). (F) Table presenting the binding profiles to human FcγRs of the various IgGs used in the study. Relative binding affinities were defined based on affinity constants previously assessed by surface plasmon resonance or other binding assays., (G) Treatment schedule. i.p., intraperitoneal; control, isotype control antibodies. (H) Tumor weights in individual mice. Each symbol represents an individual mouse (n = 15–16, three independent experiments). (I and J) Frequencies of FOXP3+ Tregs in TDLNs and tumors following indicated treatments. Each symbol represents an individual mouse (n = 8–11, two independent experiments). (K) Frequency of TA-HECs. Representative dot plots of TA-HECs are shown. Each symbol represents an individual mouse (n = 13–15, three independent experiments). Data are shown as mean ± SEM. All p values were determined by one-way ANOVA with Tukey’s multiple comparison test. See also Figure S11.
Figure 6
Figure 6
Fc-optimized ipilimumab combined with anti-PD-1 increases TA-HEVs and melanoma tumor control in humanized mice (A) Treatment schedule. i.p., intraperitoneal; control, isotype control antibodies. (B–D) Mean tumor growth, Kaplan-Meier survival curves, and individual tumor growth. Data were obtained from two independent experiments (control, n = 12 mice; anti-PD-1, n = 10 mice; ipilimumab-GAALIE, n = 12 mice; ipilimumab-GAALIE + anti-PD-1, n = 12 mice). (E) Treatment schedule. i.p., intraperitoneal; IF, immunofluorescence; control, isotype control antibodies. (F–H) Immunofluorescence of B16F10 tumor (day 15) following treatment with ipilimumab-GAALIE + anti-PD-1 antibodies. Selected markers are presented. Inset in (G) and (H) show higher magnifications of boxed areas. Scale bars: 500 μm (F), 50 μm (G left, H left, and H right), 20 μm (G right). (I and J) Frequencies of TA-HECs and MECA-79+CD62P+ TA-HECs. Each symbol represents an individual mouse (n = 9–10, two independent experiments). (K and L) Frequency and numbers of Tbet+ICOS+ Th1-like CD4+ T cells in tumors. Representative dot plots are shown (K). Each symbol represents an individual mouse (n = 9–10, two independent experiments). (M) Number of tumor-infiltrating CD8+ T cells. Each symbol represents an individual mouse (n = 9–10, two independent experiments). Data are shown as mean ± SEM. All p values were determined by unpaired two-tailed Student’s t test except for (B) for which p values were determined by two-way ANOVA with Dunnett’s multiple comparison test, and for graph in (C) for which p values were determined by log rank test.

References

    1. Ribas A., Wolchok J.D. Cancer immunotherapy using checkpoint blockade. Science. 2018;359:1350–1355. doi: 10.1126/SCIENCE.AAR4060. - DOI - PMC - PubMed
    1. Sharma P., Siddiqui B.A., Anandhan S., Yadav S.S., Subudhi S.K., Gao J., Goswami S., Allison J.P. The Next Decade of Immune Checkpoint Therapy. Cancer Discov. 2021;11:838–857. doi: 10.1158/2159-8290.CD-20-1680. - DOI - PubMed
    1. Gajewski T.F. The Next Hurdle in Cancer Immunotherapy: Overcoming the Non-T-Cell-Inflamed Tumor Microenvironment. Semin. Oncol. 2015;42:663–671. doi: 10.1053/J.SEMINONCOL.2015.05.011. - DOI - PMC - PubMed
    1. Galon J., Bruni D. Approaches to treat immune hot, altered and cold tumours with combination immunotherapies. Nat. Rev. Drug Discov. 2019:197–218. doi: 10.1038/s41573-018-0007-y. - DOI - PubMed
    1. Tumeh P.C., Harview C.L., Yearley J.H., Shintaku I.P., Taylor E.J.M., Robert L., Chmielowski B., Spasic M., Henry G., Ciobanu V., et al. PD-1 blockade induces responses by inhibiting adaptive immune resistance. Nature. 2014;515:568–571. doi: 10.1038/NATURE13954. - DOI - PMC - PubMed

MeSH terms