. 2025 Sep 8;74(10):1624-1637.
doi: 10.1136/gutjnl-2024-334634.

Toxic microbiome and progression of chronic kidney disease: insights from a longitudinal CKD-Microbiome Study

Affiliations

Toxic microbiome and progression of chronic kidney disease: insights from a longitudinal CKD-Microbiome Study

Manolo Laiola et al. Gut. .

Abstract

Background: The gut microbiota has been linked to non-communicable diseases, including chronic kidney disease (CKD). However, the relationships between gut microbiome composition changes, uraemic toxins (UTs) accumulation, and diet on CKD severity and progression remain underexplored.

Objective: To characterise relationships between gut microbiome composition and functionality, UTs diet, and CKD severity and progression, as well as assess microbial contributions to UTs accumulation through mice faecal microbiota transplantation (FMT).

Design: This study profiled the gut microbiome of 240 non-dialysis patients with CKD (CKD-REIN cohort) using shotgun metagenomics, with follow-up in 103 patients after 3 years, with comparisons with healthy volunteers from the Milieu Intérieur cohort. A multiomics approach identifies features associated with CKD severity (and progression), with validation in an independent Belgian cohort. Experimental models used FMT to test CKD gut microbiome effects on UTs and kidney fibrosis. Changes in gut microbiome over time were evaluated, and the impact of diet on these changes was assessed.

Results: Compared with matched healthy controls, patients with CKD exhibited gut microbiota alteration, with enrichment of UT precursor-producing species. Patients with severe CKD exhibited higher UT levels and greater enrichment of UT (precursor)-producing species in the microbiota than patients with moderate CKD. Over time, UT (precursor)-producing species increased, and a plant-based low protein diet appeared to mitigate these changes. FMT from patients with CKD to antibiotic-treated CKD model mice increased serum UT levels and exacerbated kidney fibrosis.

Conclusions: This study highlights the role of the microbiome and UTs in CKD, suggesting a potential therapeutic target to slow disease progression.

Keywords: EPIDEMIOLOGY; MICROBIOME.


Conflict of interest statement

Competing interests: CKD-REIN is supported by a public-private partnership with funding from 10 pharmaceutical companies as listed below. The authors declare that the research was conducted in the absence of any commercial or financial relationships that could be construed as a potential conflict of interest. LK has received grants from Fresenius Kabi, Nestlé, Lallemand, AstraZeneca and consultancy or speaker fees or travel support from Astrazeneca, Lilly, Baxter, Bayer, and Fresenus Kabi. ZM received honoraria for lectures, educational events from AstraZeneca, GSK, Boehringer.

Figures
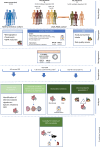
Figure 1
Figure 1. Overview of the study design, input data sets and analysis methods This study involved 240 non-dialysis-dependent patients with chronic kidney disease (CKD) from the Chronic Kidney Disease–Renal Epidemiology and Information Network (CKD-REIN) cohort, who underwent comprehensive bioclinical phenotyping. This detailed phenotyping provided clinical data, uraemic toxin (UTs) profiles, dietary information, and gut microbiome composition and functionality, assessed through shotgun metagenomics analyses. For 103 of these patients, the same data were collected 3 years later (T1). First, we compared the gut microbiomes of patients with CKD at baseline (T0) with healthy controls (HCs, from the Milieu Intérieur cohort) to identify a CKD-specific gut microbiome signature and species associated with CKD. Second, we analysed differences in the gut microbiome between patients with moderate and severe CKD, categorised by an estimated glomerular filtration rate (eGFR) <30 mL/min/1.73 m² (N=130) and ≥30 mL/min/1.73 m² (N=110). Multiomics integrative analyses were performed to identify biomarkers linked to disease severity and CKD progression. Third, we examined microbiome changes over time by comparing data from T0 and T1, assessing the impact of diet on gut microbiome composition. Finally, we conducted an experimental study to explore the causal relationships between gut microbiota, uraemic toxin production and kidney function deterioration in CKD. We performed faecal microbiota transplantation (FMT) using stool samples from patients with CKD (n=10) and healthy volunteers (HVs) (n=10) into antibiotic-treated CKD mouse models. CMPF, 3-carboxy-4-methyl-5-propyl-2-furanpropanoic acid; MSP, metagenomic species pangenome; TMAO, trimethylamine-N-oxide.
Figure 2
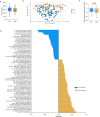
Figure 2. Alterations of gut bacterial species in patients with chronic kidney disease (CKD) compared with healthy controls (HCs) include enrichment of uraemic toxin (UT)-producing species. Box plot (line, median; box, IQR) showing (A) the richness of metagenomic species pangenomes (MSPs) between HCs and patients with CKD matched for age, sex, body mass index (BMI), diabetes, and proton pump inhibitor (PPI) and metformin use. Comparisons were performed with the two-sided Wilcoxon rank-sum test. (B) Principal coordinate analysis (PCoA) of the relative abundance of MSPs. The spatial density distribution of samples in each group is indicated with an ellipse. The x-axis and y-axis labels indicate the variance in microbial composition explained by the first two principal coordinates. (C) Box plot of the Gut Microbiome Health Index (GMHI). Comparisons were performed with the two-sided Wilcoxon rank-sum test. (D) Blot length shows effect sizes (Cliff’s delta) for significantly different bacterial species between HCs and patients with CKD. Corrections were made for multiple comparisons with the Benjamini–Hochberg method (False discovery rate (FDR)Wilcoxon<0.05 and |LogFC|>2) (see online supplemental table 2 for exact p values). Stars indicate species that carry genes encoding key enzymes involved in the main UT synthesis pathways (see online supplemental table 3 for details). Species enriched in HCs (n=78) are shown in blue, and those enriched in patients with CKD (n=78) are shown in gold.
Figure 3
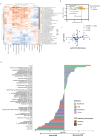
Figure 3. Microbiome signature associated with severity of chronic kidney disease (CKD). (A) Heatmap showing correlations between the abundances of metagenomic species pangenomes (MSPs) that differed between patients with severe and moderate CKD and the levels of serum uraemic toxins (UTs) and precursors. Stars indicate species whose genes encode key enzymes involved in the main UT synthesis pathways. White circles, p<0.01; black circles, p<0.05. CD refers to Cliff’s delta, species more abundant in moderate (in blue) and severe (in red) associated with UTs. Rho richness refers to the richness of identified species in patients with CKD. (B) Separation of serum UTs and precursors between patients with severe and moderate CKD according to principal coordinate analysis (PCoA). (C) For the gut microbial and plasma metabolome features common to both CKD-Microbiome and Ghent cohorts, a Spearman correlation analysis was conducted between the LogFC effect size for moderate versus severe CKD comparison in each study after recalculating LogFC in the Ghent population. (D) Data Integration Analysis for Biomarker discovery using Latent cOmponents (DIABLO) variable loading plot displaying vectors that contributed the most to the difference between severe and moderate CKD patient groups on the basis of microbiome, bioclinical, UTs and diet data, reported as a bar plot. Stars indicate species whose genes encode key enzymes involved in the main UTs synthesis pathways. CMPF, 3-carboxy-4-methyl-5-propyl-2-furanpropanoic acid; TMAO, trimethylamine-N-oxide.
Figure 4
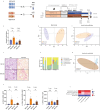
Figure 4. Impact of faecal microbiota transplantation (FMT) of stool from patients with CKD or healthy volunteers (HVs) on kidney function in mice. (A) Chronogram of the experiment. (B) Bar plots show the percentage of fibrosis of the kidney interstitial according to Sirius Red staining at 2 weeks and 6 weeks. (C) Representative images of Sirius Red staining (scale bar=50 μm) at 2 weeks. (D) Principal coordinates analysis (PCoA) according to Bray–Curtis dissimilarities among samples at 2 weeks, performed on the basis of species abundances. The samples are colour-coded and shape-coded by group. The spatial density distribution of samples in each group is indicated separately with an ellipse. The x-axis and y-axis labels indicate the microbial compositional variance explained by the first two principal components. (E) Taxonomic overview at the family level per sample at 2 weeks. Bar plots display the relative abundance of the taxa. PcoA of the relative abundance of plasmatic uraemic toxins (UT) and precursors. The spatial density distribution of samples in each group is indicated separately with an ellipse. The x-axis and y-axis labels indicate the metabolic compositional variance explained by the first two principal coordinates (F) at 2 weeks and (G) at 6 weeks. (H) Concentration of microbiota-derived UTs in the serum at 2 weeks and 6 weeks (n=5–8). The data are presented as the means±SEMs. *p<0.05 and **p<0.01 represents a significant difference between groups. One-way Student’s t-test was performed. (i) Heatmap of Spearman rank correlations between the abundance of the most differentially abundant species between FMT-CKD and FMT-HVs mice and kidney parameters and UTs at 2 weeks (*p < 0.05; Spearman correlation). FMT, faecal microbiota transplantation.
Figure 5
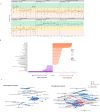
Figure 5. Differences in CKD-related omics data between fast and slow progressors. (A) Boxplots (line, median; box, IQR) represent the distribution of areas under the receiver operating characteristic curve (AUROCs) derived from different machine learning (ML) algorithms on the basis of different omics sets to classify progressors (n=68) versus non-progressors (NP) (n=172). EARTH, enhanced adaptive regression through hashing; GBM, gradient boosting machine; GLMBOOST, generalised linear model boosting; GLMNET, generalised linear model via penalised maximum likelihood; PAM, partitioning around medoids; PLS, partial least squares; RF, random forest. (B) Absolute values of Cliff’s delta (CD) values of microbiome, bioclinical, diet and uraemic toxins (UTs) features linked to CKD progression identified as significantly different between fast and slow progressors (pWilcoxon<0.05 and and CD > 0.1). Stars indicate species harbouring genes encoding key enzymes involved in the main UTs synthesis pathways. (C) Networks of correlations for significantly different features between fast and slow progressors, comprising metagenomic species pangenomes (MSPs) (green), bioclinical characteristics (blue), UTs (black) and diet (yellow). The red and blue edges indicate significant negative and positive correlations, respectively. Line thickness represents the magnitude of the correlation coefficient; only correlations with a coefficient magnitude above 0.4 are shown. CKD, chronic kidney disease.
Figure 6
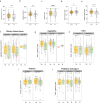
Figure 6. Gut microbiome modification in patients with CKD over 3 years is associated with estimated glomerular filtration rate (eGFR) decline and influenced by changes in diet. Box plot (line, median; box, IQR) showing (A) eGFR; (B) metagenomic species pangenomes (MSPs) richness; (C) the Gut Microbiome Health Index (Dysbiosis Index); (D) toxic species ratio; and (E) Dietary Variety Score (DVS) at inclusion (yellow, n=103) and 3 years later (white, n=103), (F) eGFR depending on the variation in DVS. Toxic species ratio depending on the vegetables (G), fiber (H), protein (I) and probiotics and yoghurt (J) dietary modifications during the follow-up. Comparisons performed with the two-sided Wilcoxon rank-sum test. *p<0.05; **p<0.01; ***p<0.001; ****p< 0.0001.

References

    1. Kidney disease: improving global outcomes (KDIGO) ckd work group KDIGO 2024 clinical practice guideline for the evaluation and management of chronic kidney disease. Kidney Int. 2024;105:S117–314. doi: 10.1016/j.kint.2023.10.018. - DOI - PubMed
    1. Bikbov B, Purcell CA, Levey AS. Global, regional, and national burden of chronic kidney disease, 1990-2017: a systematic analysis for the Global Burden of Disease Study 2017. Lancet. 2020;395:709–33. doi: 10.1016/S0140-6736(20)30045-3. - DOI - PMC - PubMed
    1. Writing group for the ckd prognosis consortium et al. Estimated glomerular filtration rate, albuminuria, and adverse outcomes: an individual-participant data meta-analysis. JAMA. 2020;330:1266–77. - PMC - PubMed
    1. Nigam SK, Bush KT. Uraemic syndrome of chronic kidney disease: altered remote sensing and signalling. Nat Rev Nephrol. 2019;15:301–16. doi: 10.1038/s41581-019-0111-1. - DOI - PMC - PubMed
    1. Curaj A, Vanholder R, Loscalzo J, et al. Cardiovascular Consequences of Uremic Metabolites: an Overview of the Involved Signaling Pathways. Circ Res. 2024;134:592–613. doi: 10.1161/CIRCRESAHA.123.324001. - DOI - PubMed

LinkOut - more resources