Global, Regional, and National Trends in Maternal Mortality Ratio Across 37 High Income Countries From 1990 to 2021, With Projections up to 2050: A Comprehensive Analysis From the WHO Mortality Database
- PMID: 40461138
- PMCID: PMC12133601
- DOI: 10.3346/jkms.2025.40.e85
Global, Regional, and National Trends in Maternal Mortality Ratio Across 37 High Income Countries From 1990 to 2021, With Projections up to 2050: A Comprehensive Analysis From the WHO Mortality Database
Abstract
Background: Understanding the global trends and future projections of maternal mortality ratio (MMR) is crucial as it can provide insights into improving policies and healthcare systems aimed at enhancing the quality of obstetric care and reducing preventable deaths. Given recent reports of increasing MMR trends in some high-income countries (HICs), we aimed to analyze the global trends of MMR from 1990 to 2021 and project future trends until 2050 across 37 countries.
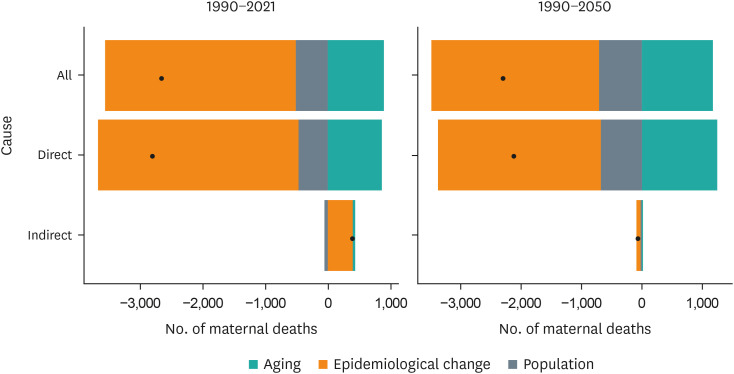
Methods: Age-standardized country-specific MMR for 37 countries from 1990 to 2021 were assessed through a locally weighted scatter plot smoother (LOESS) curve, with weighting based on individual country populations, utilizing the World Health Organization Mortality Database. The impact of premature mortality due to MMR was assessed by analyzing the years of life lost (YLLs). Furthermore, projections for MMR up to 2050 were derived using the Bayesian Age-Period-Cohort (BAPC) model. Decomposition analysis identified factors contributing to MMR variations such as population growth, aging and epidemiological changes.
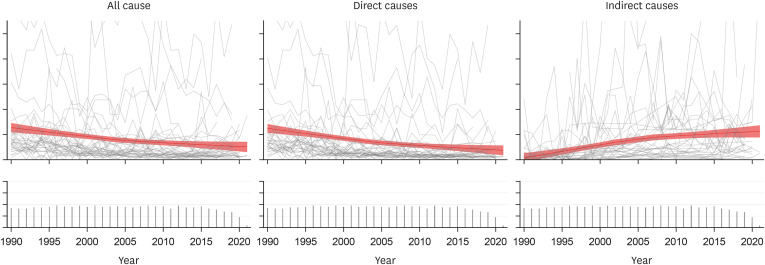
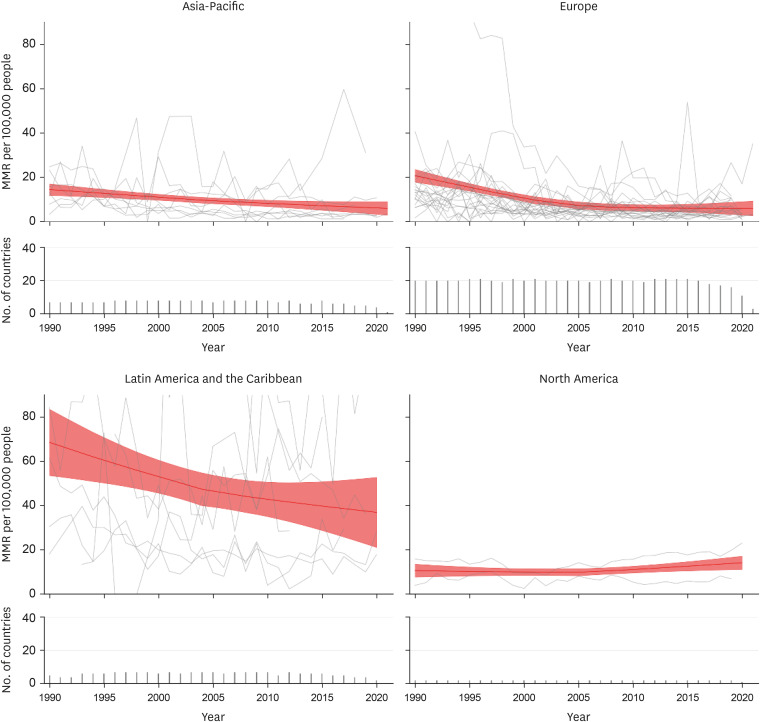
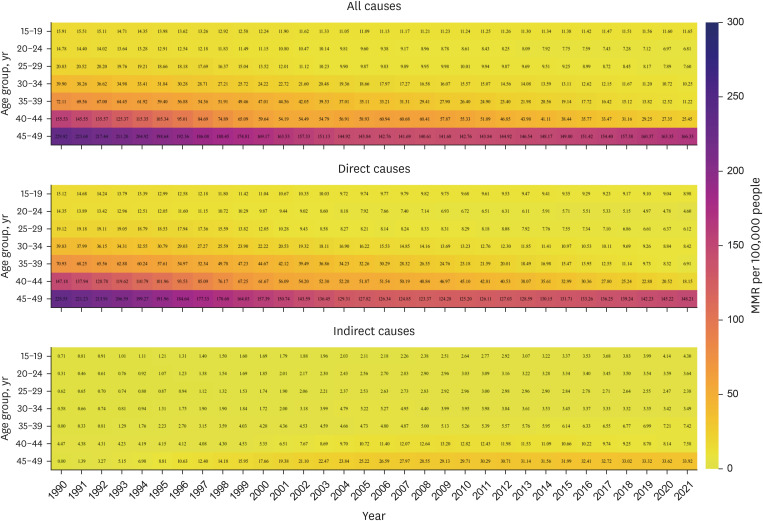
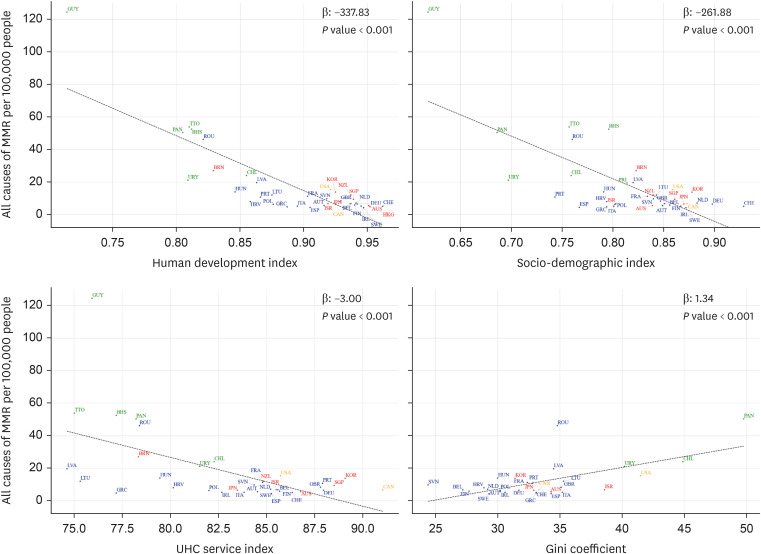
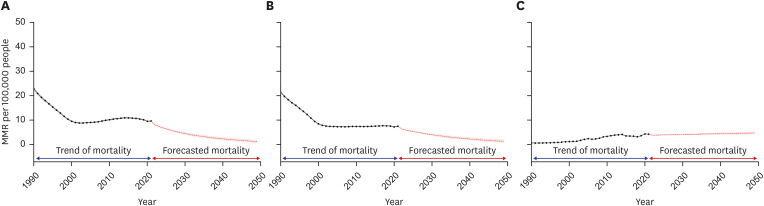
Results: The LOESS estimate of the global MMR decreased from 25.65 deaths per 100,000 live births (95% confidence interval [CI], 22.10, 29.20) in 1990 to 10.38 (6.41, 14.36) in 2021. While most continents showed a decreasing trend, young age groups in Asia-Pacific regions and all age groups in North America exhibited no significant changes from 1990 to 2021. MMR due to direct causes declined from 25.05 deaths per 100,000 live births (95% CI, 21.71, 28.38) in 1990 to 7.66 (3.90, 11.43) in 2021 across all age groups. Conversely, MMR due to indirect causes rose from 0.33 deaths per 100,000 live births (95% CI, -0.37, 1.03) in 1990 to 4.33 (3.43, 5.23) in 2021, with a more pronounced increase in advanced age groups. YLL due to MMR decreased from 866.00 (95% CI, 692.39, 1,039.60) in 1990 to 387.05 (182.82, 591.28) in 2021. Our analysis revealed negative correlations between MMR and the Human Development Index, Socio-demographic Index, and Universal Health Coverage Service Index. BAPC models predict a continued decrease in global MMR to 4.47 (4.07, 4.89) in 2030, 2.32 (1.82, 2.89) in 2040, and 1.25 (0.86, 1.81) in 2050. However, MMR due to indirect causes is projected to consistently increase. The global decrease in MMR from 1990 to 2021 can be primarily attributed to epidemiological changes.
Conclusion: This study reveals a significant global decline in MMR since 1990, with projections indicating further decreases up to 2050, despite persistent increases in indirect causes and mortality among older age groups. These findings highlight the critical need for targeted strategies to address indirect causes and protect vulnerable populations.
Keywords: Global Trend; Maternal Mortality Ratio; Prediction Model; WHO Mortality Database.
© 2025 The Korean Academy of Medical Sciences.
Conflict of interest statement
The authors have no potential conflicts of interest to disclose.
Figures
Similar articles
-
Global, Regional, and National Trends in Liver Disease-Related Mortality Across 112 Countries From 1990 to 2021, With Projections to 2050: Comprehensive Analysis of the WHO Mortality Database.J Korean Med Sci. 2024 Dec 2;39(46):e292. doi: 10.3346/jkms.2024.39.e292. J Korean Med Sci. 2024. PMID: 39623966 Free PMC article.
-
Temporal trends and patterns in mortality from falls across 59 high-income and upper-middle-income countries, 1990-2021, with projections up to 2040: a global time-series analysis and modelling study.Lancet Healthy Longev. 2025 Jan;6(1):100672. doi: 10.1016/j.lanhl.2024.100672. Epub 2025 Jan 20. Lancet Healthy Longev. 2025. PMID: 39848266
-
Global, regional, and national trends in drug use disorder mortality rates across 73 countries from 1990 to 2021, with projections up to 2040: a global time-series analysis and modelling study.EClinicalMedicine. 2024 Dec 17;79:102985. doi: 10.1016/j.eclinm.2024.102985. eCollection 2025 Jan. EClinicalMedicine. 2024. PMID: 39802307 Free PMC article.
-
The 2023 Latin America report of the Lancet Countdown on health and climate change: the imperative for health-centred climate-resilient development.Lancet Reg Health Am. 2024 Apr 23;33:100746. doi: 10.1016/j.lana.2024.100746. eCollection 2024 May. Lancet Reg Health Am. 2024. PMID: 38800647 Free PMC article. Review.
-
Trends and causes of maternal mortality in Indonesia: a systematic review.BMC Pregnancy Childbirth. 2024 Jul 30;24(1):515. doi: 10.1186/s12884-024-06687-6. BMC Pregnancy Childbirth. 2024. PMID: 39080562 Free PMC article.
References
-
- Bustreo F, Say L, Koblinsky M, Pullum TW, Temmerman M, Pablos-Méndez A. Ending preventable maternal deaths: the time is now. Lancet Glob Health. 2013;1(4):e176–e177. - PubMed
-
- Khan KS, Wojdyla D, Say L, Gülmezoglu AM, Van Look PF. WHO analysis of causes of maternal death: a systematic review. Lancet. 2006;367(9516):1066–1074. - PubMed
-
- Alkema L, Chou D, Hogan D, Zhang S, Moller AB, Gemmill A, et al. Global, regional, and national levels and trends in maternal mortality between 1990 and 2015, with scenario-based projections to 2030: a systematic analysis by the UN Maternal Mortality Estimation Inter-Agency Group. Lancet. 2016;387(10017):462–474. - PMC - PubMed
-
- Khalil A, Samara A, O’Brien P, Coutinho CM, Quintana SM, Ladhani SN. A call to action: the global failure to effectively tackle maternal mortality rates. Lancet Glob Health. 2023;11(8):e1165–e1167. - PubMed
MeSH terms
Grants and funding
LinkOut - more resources
Full Text Sources