. 2025 Jun 3;13(6):e011503.
doi: 10.1136/jitc-2025-011503.

Myoglobin expression improves T-cell metabolism and antitumor effector function

Affiliations

Myoglobin expression improves T-cell metabolism and antitumor effector function

Julia Werner et al. J Immunother Cancer. .

Abstract

Background: The tumor microenvironment is frequently hypoxic and characterized by a scarcity of nutritional resources including a shortage of glucose. As effector T cells have high energy demands, tumor metabolism can contribute to T-cell dysfunction and exhaustion.

Methods: In this study, we determined hypoxia in spleen and tumor tissue from tumor-bearing C57BL/6J mice using reverse transcription polymerase chain reaction (RT-PCR), histology and flow cytometry. Next, CD8+ T cells isolated from C57BL6J mice or P14+ mice were transduced with Thy1.1 (Control) or Thy1.1-Myoglobin (Mb) packaged retrovirus. Expression of Mb was confirmed with RT-PCR and western blot. Cellular metabolism was determined by flow cytometry, transmission electron microscopy, focused ion beam scanning electron microscopy, Seahorse, metabolomics and luminescence assays. Mb expressing or control P14+ or OT-I+ T cells were transferred in B16F10-gp33 or MC38-ova tumor-bearing mice respectively and analyzed using flow cytometry and histology. B16F10-gp33 tumor-bearing mice were additionally treated with anti-programmed cell death protein-1 (PD-1) checkpoint inhibitor.

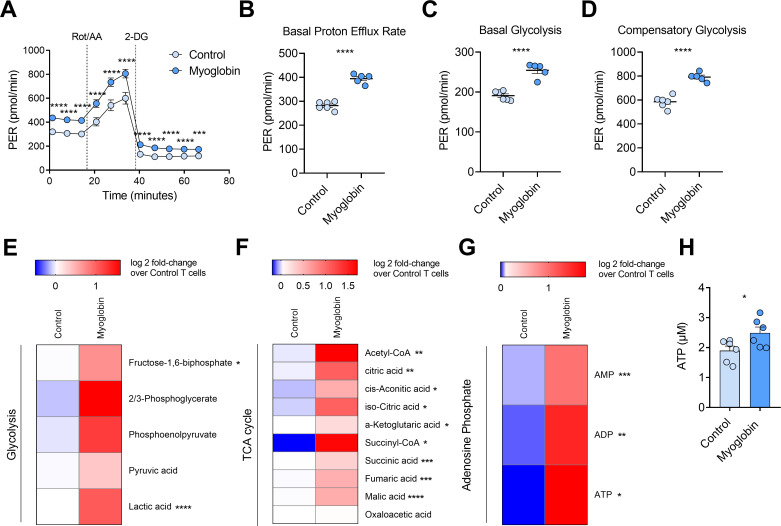
Results: Here we demonstrate that expression of the oxygen-binding protein myoglobin in T cells can boost their mitochondrial and glycolytic metabolic functions. Metabolites and tricarboxylic acid compounds were highly increased in the presence of myoglobin (Mb), which was associated with increased ATP levels. Mb-expressing T cells exhibited low expression of hypoxia-inducible factor-1α after activation and during infiltration into the tumor microenvironment (TME). Accordingly, Mb expression increased effector T-cell function against tumor cells in vitro with concomitant reductions in superoxide levels. Following adoptive transfer into tumor-bearing mice, Mb expression facilitated increased infiltration into the TME. Although T cells expressing Mb exhibited increased expression of effector cytokines, PD-1 was still detected and targetable by anti-PD-1 monoclonal antibodies, which in combination with transfer of Mb-expressing T cells demonstrated maximal efficacy in delaying tumor growth.

Conclusion: Taken together, we show that expression of Mb in T cells can increase their metabolism, infiltration into the tumor tissue, and effector function against cancer cells.

Keywords: Adoptive cell therapy - ACT; Colon Cancer; Immune Checkpoint Inhibitor.


Conflict of interest statement

Competing interests: JW, HCX, GT, LdSS and PAL are involved in the development of LCMV for clinical application in oncology in cooperation with or as founder of or as advisors to Abalos Therapeutics GmbH.

Figures

Figure 1
Figure 1. T cells express hypoxic markers in the tumor microenvironment. (A–C) 5×10⁵ B16F10-gp33 cells were injected into the left flank of C57BL/6J mice. After 14 days tumor and spleen were collected and analyzed. (A) RNA was isolated from organ suspension and RT-PCR was performed. RNA levels of CREB, Nox1 and Hif-1α were normalized to TBP (n=10). (B–C) Histology slides of spleen and tumor tissue stained for CD8 and Hif-1α. (B) Representative fluorescence images of spleen (top panel) and tumor (bottom panel) were taken. The scale bar is equivalent to 50 µm. (C) The colocalization of Hif-1α in CD8 expression was determined (n=4). (D) 5×10⁵ B16F10-gp33 cells were injected into the left flank of C57BL/6J mice. After 10 days, tumor and spleen samples were collected and MFI of Hif-1α on CD8+ CD44high T cells was determined using flow cytometry (n=6). (E–H) CD8+ T cells isolated from C57BL/6J mice were transduced with Thy1.1 (Control) and Thy1.1-Myoglobin (Myoglobin). (E) After enrichment of Thy1.1 expression, RNA was isolated from T-cell suspension and RT-PCR was performed. RNA levels of myoglobin normalized to TBP were detected (n=4). (F–G) Western blot analysis for myoglobin and tubulin was performed. (F) Western blot is shown (n=3) and (G) quantified (relative to α-tubulin) (n=3). (H) Frequency of Hif-1α expression in CD8+ Thy1.1+ T cells was determined with flow cytometry (n=6, from two independent experiments). Error bars indicate SEM. *p<0.05, **p<0.01, ***p<0.001 and ****p<0.0001 between the indicated groups. HIF, hypoxia inducible factors; MFI, mean fluorescence intensity; RT-PCR, reverse transcription polymerase chain reaction; TBP, TATA-binding protein.
Figure 2
Figure 2. Myoglobin-expressing CD8+ T cells exhibit improved mitochondrial activity and aerobic metabolism in comparison to control T cells. (A–E) CD8+ T cells isolated from P14+ mice were transduced with Thy1.1 (Control) or Thy1.1-Myoglobin (Myoglobin) following enrichment for Thy1.1 expression. (A) Representative TEM images of the mitochondrial shape of control and myoglobin T cells are shown as indicated (left panel: scale bar=0.5 µm, right panel: scale bar=0.1 µm). (B) Mitochondria area was calculated based on TEM images in µm2 (n=113–132). Measurement of the (C) mitochondria diameter (n=113–132), (D) the length of cristae (n=315–337) and (E) the width of cristae (n=297–338) based on TEM images in µm is shown. (F) Mitochondrial three-dimensional structure reconstruction of focused ion beam scanning electron microscopy images of Thy1.1 (Control) and Thy1.1-Myoglobin (Myoglobin) expressing CD8+ T cells isolated from P14+ mice are shown (n=10). (G–J) Seahorse analysis of oxygen consumption rate (OCR) of CD8+ T cells transduced with Thy1.1 (Control) or Thy1.1-Myoglobin (Myoglobin), following Thy1.1 enrichment is shown. (G) Time-dependent drug treatment with Oligomycin, FCCP and antimycin A (AA)+rotenone (Rot) is illustrated (n=11–14, from two independent experiments). (H) Basal respiration was determined by subtracting the basal level from the non-mitochondrial respiration (n=11–12, from two independent experiments). (I) The true maximal respiration was determined by subtracting the maximal respiration from the non-mitochondrial respiration (n=11–12, from two independent experiments). (J) Spare capacity was determined by subtracting the basal from the maximal respiration (n=11–12, from two independent experiments). (K) MitoSox expression of Thy1.1 (Control) or Thy1.1-Myoglobin (Myoglobin) expressing CD8+ T cells was determined after 0 and 24 hours via flow cytometry gated on CD8+ Thy1.1+ T cells (n=6, from two independent experiments). (L) H2O2 levels were measured using Peroxy Orange 1 (PO1) of Thy1.1 (Control) and Thy1.1-Myoglobin (Myoglobin) transduced CD8+ T cells via flow cytometry (n=6, from two independent experiments). (M) GSH concentration measured via luminescence of Thy1.1 (Control) and Thy1.1-Myoglobin (Myoglobin) transduced CD8+ T cells is shown (n=8, from two independent experiments). (N) Untransduced, Thy1.1 (Control) and Thy1.1-Myoglobin (Myoglobin) expressing CD8+ T cells were cultured for 24 hours and 48 hours and treated with resazurin. The fluorescence of metabolized resorufin was measured after 30 min and 3 hours. Fold change of NADH/H+ to NAD+/H2O in comparison to untransduced cells is shown (n=16, from two independent experiments). (O) Half maximal time of dihydroethidium oxidation of Thy1.1 (Control) or Thy1.1-Myoglobin (Myoglobin) transduced CD8+ T cells with 2.5 mM H2O2 treatment was determined (n=8, from two independent experiments). Error bars indicate SEM. *p<0.05, **p<0.01, ***p<0.001 and ****p<0.0001 between the indicated groups. FCCP, carbonyl cyanide-p-trifluoromethoxyphenylhydrazone; TEM, transmission electron microscopy.
Figure 3
Figure 3. Myoglobin expression in CD8+ T cells triggers increased glycolysis and ATP expression. (A–D) Seahorse analysis of proton efflux rate (PER) of transduced CD8+ T cells isolated from C57BL/6J mice with Thy1.1 (Control) or Thy1.1-Myoglobin (Myoglobin), following Thy1.1 enrichment was performed. (A) Time-dependent drug treatment with antimycin A (AA)+rotenone (Rot) and 2-Desoxy-D-glucose (2-DG) is shown (n=5–6). (B) Basal PER is derived from A before drug treatment (n=5–6). (C) Basal glycolysis was determined by subtracting the untreated glycolysis rate from the mito acidification measured by oxygen consumption rate (n=5–6). (D) Compensatory glycolysis is derived from A after treating the cells with Rot and AA (n=5–6). Metabolomic analysis of Thy1.1 (Control) and Thy1.1-Myoglobin (Myoglobin) expressing CD8+ T cells stimulated with 10 mM glucose medium is illustrated. Shown are the products of (E) the glycolysis, (F) the TCA cycle and (G) the adenosine phosphates (n=5–6). (H) ATP concentration was measured via luminescence of Thy1.1 (Control) and Thy1.1-Myoglobin (Myoglobin) CD8+ T cells isolated from C57BL/6J mice, following Thy1.1 enrichment incubated with 10 mM glucose as sugar source (n=6, from two independent experiments). Error bars indicate SEM. *p<0.01, **p<0.001 ****p<0.0001 and ****p<0.0001 between the indicated groups. CoA, Coenzyme A; TCA, tricarboxylic acid.
Figure 4
Figure 4. Myoglobin-expressing CD8+ T cells have increased effector functions in comparison to control T cells. (A–G) CD8+ T cells isolated from C57BL/6J mice were transduced with Thy1.1 (Control) or Thy1.1-Myoglobin (Myoglobin) and analyzed via flow cytometry to detect the frequency of (A) effector (with CD44+ CD62L) and memory (CD44+ CD62L+) T-cell subsets, (B) TOXhigh and TOXdim populations, (C) TCF-1+ gated on CD8+ Thy1.1+ T cells (n=6, from two independent experiments). (D) Histogram and (E) frequency of PD-1 gated on CD8+ Thy1.1+ T cells is shown (n=6, from two independent experiments). (E) Histogram and (F) frequency of Tim-3 gated on CD8+ Thy1.1+ T cells is illustrated (n=6, from two independent experiments). (H–K) Co-culture of Thy1.1 (Control) or myoglobin-expressing Thy1.1 (Myoglobin) CD8+ T cells isolated from P14+ mice with B16F10-gp33 cells in indicated target:effector (T:E) ratios are analyzed via flow cytometry. Frequency of (H) IFN-γ+, (I) TNF-α+ and (J) GzmB+ of Thy1.1+ CD8+ T cells is shown (n=9, from three independent experiments). (K) Late apoptotic B16F10-gp33 cells are detected with 7AAD (n=9, from three independent experiments). Error bars indicate SEM. ns: p>0.05, *p<0.05, **p<0.01, ***p<0.001 and ****p<0.0001 between the indicated groups. 7AAD, 7-Aminoactinomycin D; GzmB, Granzyme B; IFN, interferon; PD-1, programmed cell death protein-1; TCF-1, T-cell factor-1; Tim-3, T cell immunoglobulin and mucin-domain containing-3; TNF, tumor necrosis factor.
Figure 5
Figure 5. Myoglobin-expressing CD8+ T cells show enhanced effector function in tumor-bearing mice in comparison to control T cells. (A–H) B16F10-gp33 tumor-bearing C57BL/6J mice were treated on day 7 with splenocytes containing 5×10⁵ Thy1.1 (Control) or Thy1.1-Myoglobin (Myoglobin) expressing P14+ CD8+ T cells, Poly I:C and gp33. Spleen and tumor tissue were analyzed on day 11 via flow cytometry. Frequency of Thy1.1+ CD8+ T cells was determined in (A) tumor and (B) spleen tissue (n=4). MFI of HIF-1α expression in (C) tumor and (D) spleen tissue of CD8+ Thy1.1+ T cells is shown (n=4). (E) CD44+ CD62L and CD44+ CD62L+ T-cell subsets of CD8+ Thy1.1+ cells in spleen tissue is shown (n=4). Frequency of (F) IFN-γ in CD8+ Thy1.1+ T cells harvested from spleen tissue restimulated with gp33 is shown. Expression of (G) PD-1 and (H) Tim-3 in tumor tissue of CD8+ Thy1.1+ cells is shown (n=4). Error bars indicate SEM. ns: p>0.05, *p<0.05, **p<0.01 and ****p<0.0001 between the indicated groups. HIF, hypoxia-inducible factors; IFN, interferon; MFI, mean fluorescence intensity; PD-1, programmed cell death protein-1; Tim-3, T cell immunoglobulin and mucin-domain containing-3.
Figure 6
Figure 6. Tumor-bearing mice show less tumor burden after treatment with Myoglobin-expressing CD8+ T cells in comparison to control CD8+ T cells. (A–E) B16F10-gp33 tumor-bearing C57BL/6J mice were treated on day 7 with splenocytes containing 2×10⁶ Thy1.1 (Control) or Thy1.1-Myoglobin (Myoglobin) expressing P14+ CD8+ T cells, Poly I:C and gp33. dLN and tumor tissue were analyzed on day 20 after T-cell transfer. (A) Tumor growth curve after T-cell transfer is shown (n=3–4). (B) Frequency of Thy1.1+ gated on CD8+ T cells was measured in the tumor tissue via flow cytometry (n=3–4). (C) The absolute count of Thy1.1+ gated on CD8+ T cells per mg tumor was detected via flow cytometry (n=3–4). The (D) frequency and (E) absolute count of Thy1.1+ gated on CD8+ T cells in the dLN was measured via flow cytometry (n=3–4). (F) MC38-ova tumor-bearing C57BL/6J mice were treated on day 6 with splenocytes containing 5×10⁵ Thy1.1 (Control) or Thy1.1-Myoglobin (Myoglobin) expressing OT-1+ CD8+ T cells, Poly I:C and SIINFEKL. The tumor growth was monitored until day 9 after T-cell transfer (n=5–11). (G–P) B16F10-gp33 tumor-bearing C57BL/6J mice were treated on day 7 with splenocytes containing 5×10⁵ Thy1.1 (Control) orThy1.1-Myoglobin (Myoglobin) expressing P14+ CD8+ T cells, Poly I:C and gp33. Spleen and tumor tissue were analyzed on day 20 after T-cell transfer. (G) The tumor growth curve after T-cell transfer is shown (n=7–8). (H) The final tumor weight is shown (n=7). (I) The absolute count of Thy1.1+ gated on CD8+ T cells per mg tumor was detected via flow cytometry (n=7). (J) Frequency of Thy1.1+ gated on CD8+ T cells was measured in the tumor tissue via flow cytometry (n=7). Absolute count per mg tumor of (K) IFN-γ+, (L) GzmB+ and (M) IL-2+ Thy1.1+ CD8+ T cells were detected with flow cytometry in the tumor tissue after restimulation with gp33 (n=7). Sections of tumor tissue were stained with DAPI and (N) anti-CD8α (scale bar=50 µm, one representative image of n=4 is shown) or for (O) cleaved caspase-3 (scale bar=100 µm, one representative image of n=4 is shown). (P) Mice were treated every second day with PD-1 blockade or isotype control starting from day 7. The tumor growth was monitored until day 19 after T-cell transfer (n=6–9). Error bars indicate SEM. ns: p>0.05, *p<0.05, **p<0.01, ***p<0.001 and ****p<0.0001 between the indicated groups. dLN, draining lymph node; GzmB, Granzyme B; IFN, interferon; IL, interleukin; PD-1, programmed cell death protein-1.

Similar articles

Cited by

References

    1. Vander Heiden MG, Cantley LC, Thompson CB. Understanding the Warburg Effect: The Metabolic Requirements of Cell Proliferation. Science. 2009;324:1029–33. doi: 10.1126/science.1160809. - DOI - PMC - PubMed
    1. Geltink RIK, Kyle RL, Pearce EL. Unraveling the Complex Interplay Between T Cell Metabolism and Function. Annu Rev Immunol. 2018;36:461–88. doi: 10.1146/annurev-immunol-042617-053019. - DOI - PMC - PubMed
    1. Chang C-H, Curtis JD, Maggi LB, Jr, et al. Posttranscriptional control of T cell effector function by aerobic glycolysis. Cell. 2013;153:1239–51. doi: 10.1016/j.cell.2013.05.016. - DOI - PMC - PubMed
    1. Buck MD, O’Sullivan D, Klein Geltink RI, et al. Mitochondrial Dynamics Controls T Cell Fate through Metabolic Programming. Cell. 2016;166:63–76. doi: 10.1016/j.cell.2016.05.035. - DOI - PMC - PubMed
    1. Bengsch B, Johnson AL, Kurachi M, et al. Bioenergetic Insufficiencies Due to Metabolic Alterations Regulated by the Inhibitory Receptor PD-1 Are an Early Driver of CD8(+) T Cell Exhaustion. Immunity. 2016;45:358–73. doi: 10.1016/j.immuni.2016.07.008. - DOI - PMC - PubMed

LinkOut - more resources