. 2025 Jun 3;16(1):5150.
doi: 10.1038/s41467-025-60406-z.

Unveiling the structural spectrum of SARS-CoV-2 fusion by in situ cryo-ET

Affiliations

Unveiling the structural spectrum of SARS-CoV-2 fusion by in situ cryo-ET

Caner Akıl et al. Nat Commun. .

Abstract

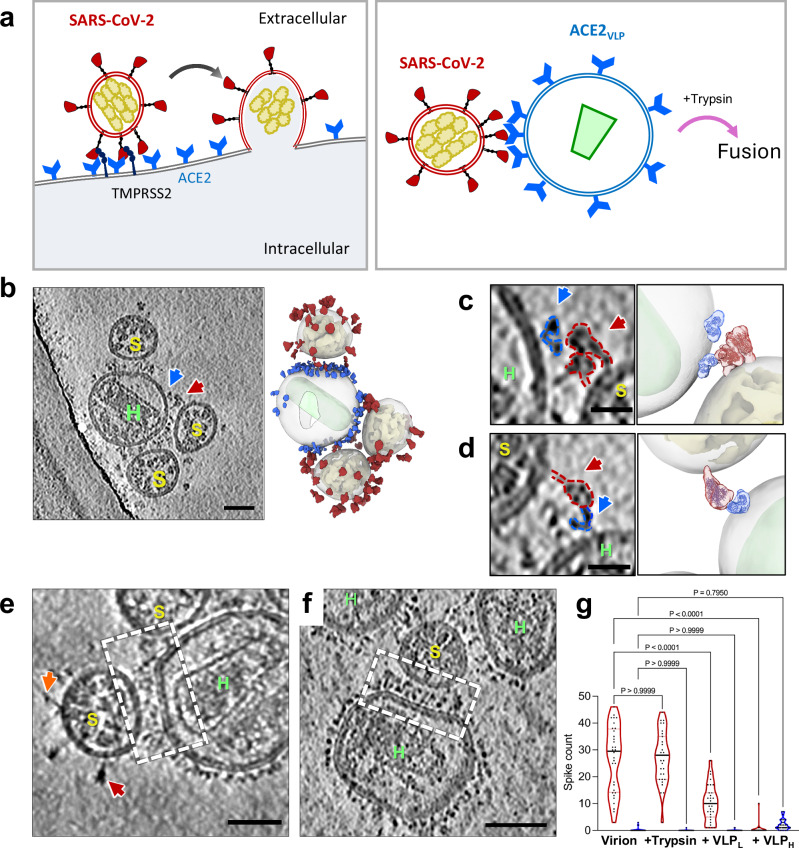
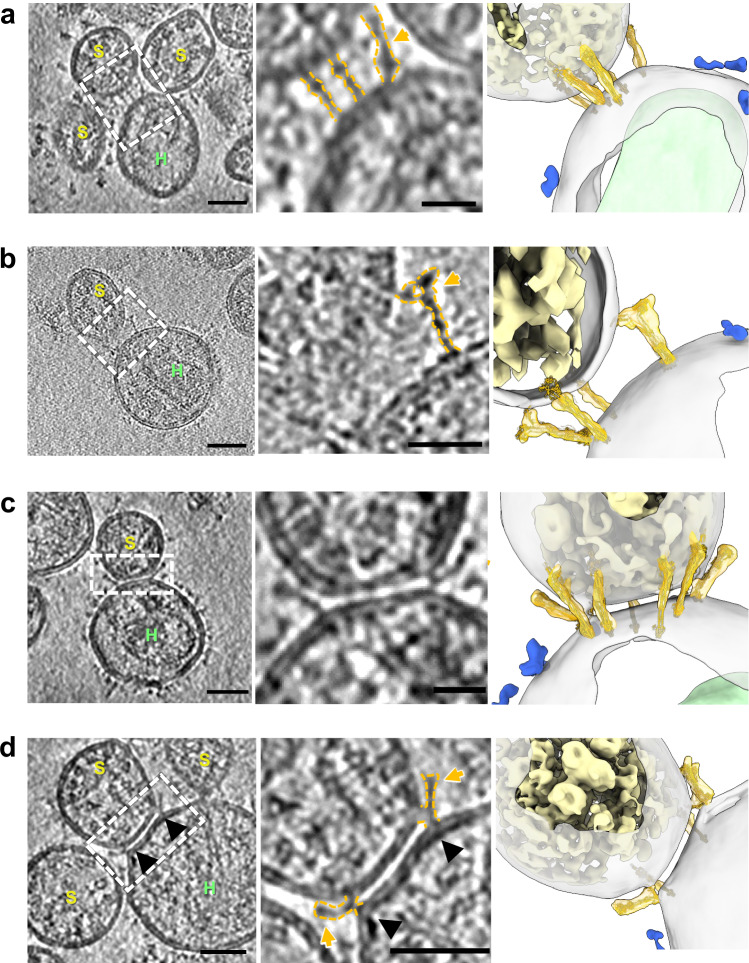
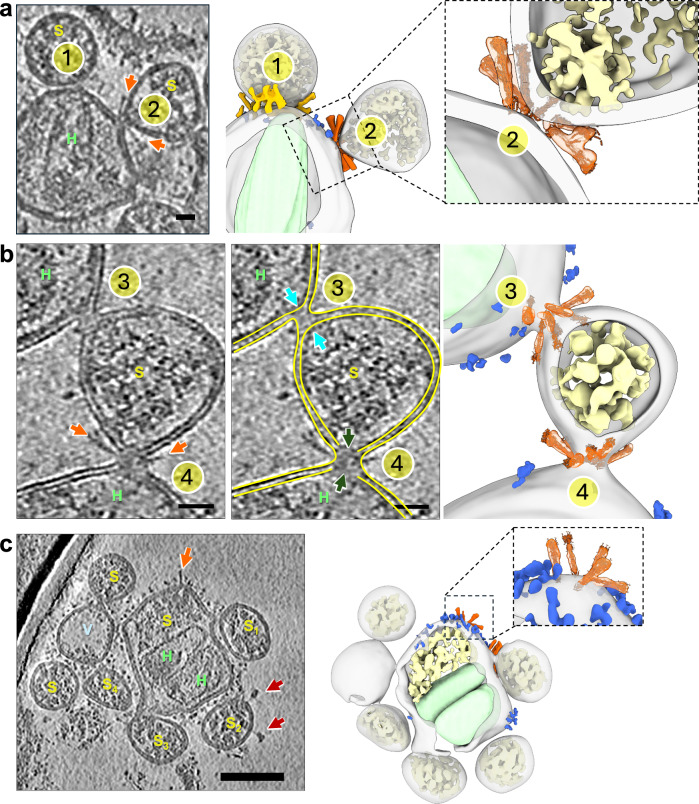
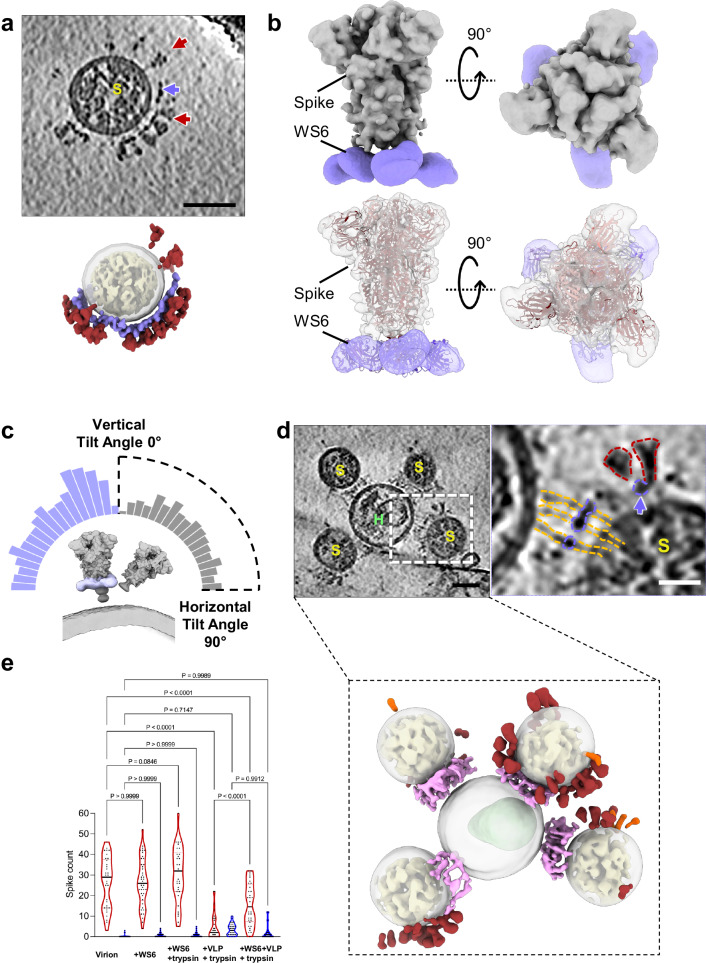
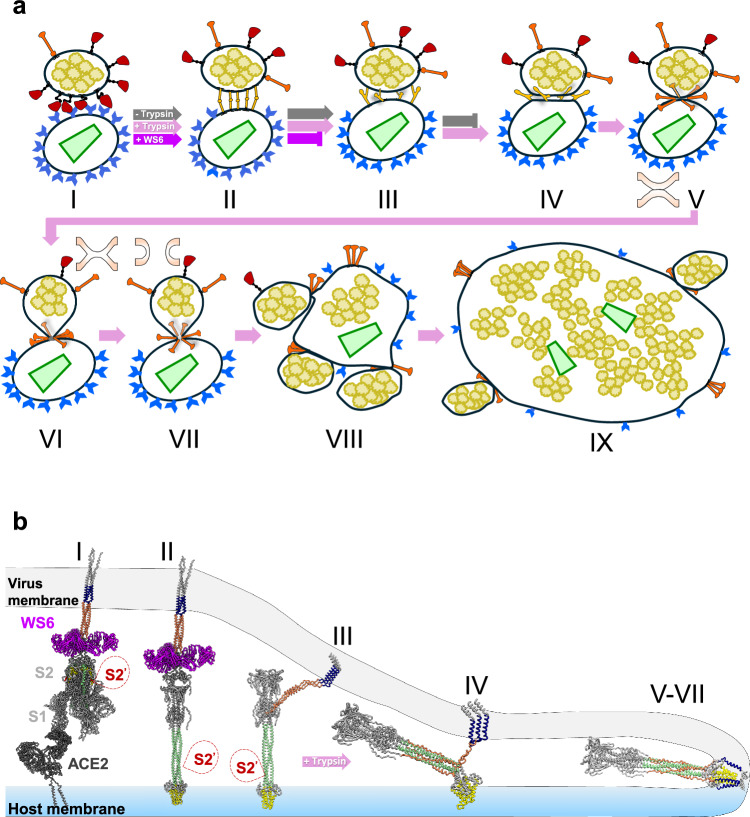
SARS-CoV-2 entry into host cells is mediated by the spike protein, which drives membrane fusion. While cryo-EM reveals stable prefusion and postfusion conformations of the spike, the transient fusion intermediate states during the fusion process remain poorly understood. Here, we design a near-native viral fusion system that recapitulates SARS-CoV-2 entry and use cryo-electron tomography (cryo-ET) to capture fusion intermediates leading to complete fusion. The spike protein undergoes extensive structural rearrangements, progressing through extended, partially folded, and fully folded intermediates prior to fusion-pore formation, a process that depends on protease cleavage and is inhibited by the WS6 S2 antibody. Upon interaction with ACE2 receptor dimer, spikes cluster at membrane interfaces and following S2' cleavage concurrently transition to postfusion conformations encircling the hemifusion and initial fusion pores in a distinct conical arrangement. S2' cleavage is indispensable for advancing fusion intermediates to the fully folded postfusion state, culminating in membrane integration. Subtomogram averaging reveals that the WS6 S2 antibody binds to the spike's stem-helix, crosslinks and clusters prefusion spikes, as well as inhibits refolding of fusion intermediates. These findings elucidate the entire process of spike-mediated fusion and SARS-CoV-2 entry, highlighting the neutralizing mechanism of S2-targeting antibodies.


Conflict of interest statement

Competing interests: The authors declare no competing interests.

Figures

Fig. 1
Fig. 1. Binding of SARS-CoV-2 spike with ACE2 results in clustering of spike/ACE2 complexes.
a Schematic representation of ACE2-mediated SARS-CoV-2 fusion. Left: Fusion between a SARS-CoV-2 virus and a host cell expressing ACE2 and Transmembrane Protease, Serine 2 (TMPRSS2); Right: Fusion between a SARS-CoV-2 virus and an ACE2VLP.Trypsin is added to substitute TMPRSS2. b SARS-CoV-2 spike interacting with ACE2VLPs, shown in a raw tomographic slice (left), and the corresponding segmented volume (right). SARS-CoV-2 spikes are colored in red, RNPs in yellow, ACE2 dimer in blue, and HIV-1 capsid in light green. c–d Zoomed-in views of a spike interacting with an ACE2 dimer. e–f Tomogram slices showing SARS-CoV-2 virions interacting with ACE2VLPs, forming predominantly clusters of spike-receptor complexes (dashed white boxes) at low (0.025 mg/ml) (e) and high (0.4 mg/ml) (f) amount of ACE2VLPs. Prefusion spike, red arrow; Postfusion spike, orange arrow. g The distribution of prefusion (red) and postfusion (blue) spikes for SARS-CoV-2 virions alone (left, n = 32), with the addition of trypsin (n = 31), and with ACE2VLPs at low (0.025 mg/ml, n = 31) and high (0.4 mg/ml, n = 31) concentrations. Data are presented as mean ± SD. Statistical analysis was performed using one-way ANOVA (F(7, 242) = 119.8, p < 0.0001, R² = 0.7760), followed by Šídák’s multiple comparisons test. Exact p values for pairwise comparisons: for prefusion spike numbers, control vs. virus+trypsin (p > 0.9999, ns = not significant), control vs. low concentration (p < 0.0001, ****), control vs. high concentration (p < 0.0001, ****); for postfusion spike numbers, control vs. virus+trypsin (p > 0.9999, ns), control vs. low concentration (p > 0.9999, ns), control vs. high concentration (p = 0.7950, ns). n indicates the sample size used for statistical analysis. Scale bars: 50 nm (b, e, f); 20 nm (c, d). ACE2VLPs are labeled with “H” and SARS-CoV-2 virions with “S.” Source data are provided as a Source Data file.
Fig. 2
Fig. 2. Capturing SARS-CoV-2 fusion intermediates.
a Extended fusion intermediate of SARS-CoV-2 spikes in a tomogram slice (dashed white box), with an enlarged view featuring key structures outlined in gold (middle) and corresponding segmented volumes (right). b Partial backfolding intermediate of SARS-CoV-2 spikes in a tomogram slice (dashed white box), outlined in gold in an enlarged view (middle) and their corresponding segmented volumes (right). c Trypsin treatment induces the tightly opposing intermediate shown in a tomogram slice (left), an enlarged view (middle) and segmented volume (right), with a protein-depleted bilayer patch which is ring fenced by multiple partial backfolding spikes (right). d Spikes in the tightly opposing phase adopt further partial backfolding intermediates, pulling the VLP membrane toward the virion membrane at sharp angles (black arrowheads). Gold arrow indicates spike intermediates. In the segmented volumes, spike intermediates are shown in gold (fitted with a spike model), RNPs in yellow, ACE2 dimers in blue, and HIV-1 capsids in light green. ACE2VLPs are labeled “H” and SARS-CoV-2 virions “S.” Scale bars: 50 nm (ad, left) and 20 nm (ad, middle enlarged views).
Fig. 3
Fig. 3. Complete fusion of SARS-CoV-2 virions with ACE2VLPs upon trypsin treatment.
a The tightly opposing intermediate (site 1) and the dimpling state (site 2) are shown in a tomogram slice (left) and a segmented volume (middle). An enlarged view of the dimpling state is shown on right (site 2). b A hemifusion site (site 3) and an initial fusion pore (site 4) are shown in a raw tomographic slice (left), with corresponding segmentation outlined in yellow (middle), and the segmented volume (right). The differentiation between Sites 3 and 4 as representing distinct fusion states is based on the continuity of the inner leaflet. The inner leaflet appears discontinuous at Site 4 (darkgreen arrows, middle) compared to Site 3 (Cyan arrows). c Multiple fusion events between SARS-CoV-2 virions and ACE2VLPs in the presence of trypsin, shown with a tomographic slice (left) and the corresponding segmented volume (right). The central particle contains two HIV-1 capsids (light green) associated with SARS-CoV-2 RNPs (yellow), while also engaging in additional fusion processes with four adjacent SARS-CoV-2 particles (S1-S4). ACE2VLPs are labeled “H”, SARS-CoV-2 virions “S”, and vesicles “V.” In tomogram slices, SARS-CoV-2 spikes are marked with red arrows (prefusion) and orange arrows (postfusion). In segmented volumes, postfusion spikes are colored in orange and fitted with the postfusion spike model in insets, RNPs in yellow, ACE2 dimer in blue, and HIV-1 capsid in light green. Scale bars: 20 nm in (a) and (b); 50 nm in (c).
Fig. 4
Fig. 4. Inhibition of SARS-CoV-2 fusion with a spike stalk antibody WS6.
a WS6 binds and clusters SARS-CoV-2 spikes on the native virions. Shown are tomographic slices of SARS-CoV-2 virions treated with WS6 antibody (top) and the corresponding segmented volume (bottom). WS6 antibody density is shown in purple, prefusion spikes in red, and RNPs in yellow. Purple arrow indicates WS6 and red arrows indicate prefusion spikes. b Subtomogram average of WS6-bound prefusion spikes at 9.3 Å resolution (top), with the atomic models of the spike trimer (PDB ID: 6XR8) and three WS6 antibodies (PDB ID: 7TCQ) fitted into the density map (bottom). c Distribution of prefusion spike tilt angles relative to the membrane normal axis, for spike alone (gray) and in complex with WS6 (purple). d WS6 binding prevents fusion of SARS-CoV-2 with ACE2VLPs but retains extended fusion intermediates. Shown are tomographic slices (left, dashed white box) and an enlarged view (right) of SARS-CoV-2 virions in the presence of WS6, with prefusion spikes (red outline) and extended spike intermediates (gold outline), along with the corresponding segmented volume (bottom). Density for fusion intermediates and WS6 between membranes is shown in light purple, prefusion spikes in red, postfusion spikes in orange, and RNPs in yellow. e The distribution of prefusion (red) and postfusion (orange) spikes per SARS-CoV-2 virion for SARS-CoV-2 virion alone (n = 33), WS6 antibody (n = 46), with trypsin treatment (n = 34), with addition of ACE2VLPs with trypsin treatment (n = 31), and WS6 antibody together with ACE2VLPs with trypsin treatment (n = 32). Data are presented as mean ± SD. Statistical analysis was performed using one-way ANOVA (F(9, 342) = 82.23, p < 0.0001, R² = 0.6839), followed by Šídák’s multiple comparisons test. Exact p values for pairwise comparisons: for prefusion spike numbers, virion vs. +WS6 (p > 0.9999, ns = not significant), virion vs. +WS6 + Trypsin (p = 0.0846, ns), virion vs. +VLP + Trypsin (p < 0.0001, ****), virion vs. +WS6 + VLP + Trypsin (p < 0.0001, **); for postfusion spike numbers, virion vs. +WS6 (p > 0.9999, ns), virion vs. +WS6 + Trypsin (p > 0.9999, ns), virion vs. +VLP + Trypsin (p = 0.7147, ns), virion vs. +WS6 + VLP + Trypsin (p = 0.9989, ns), +VLP + Trypsin vs. +WS6 + VLP + Trypsin (p = 0.9912, ns). n indicates the sample size used for statistical analysis. Scale bars: 50 nm (a, d) and 20 nm (d, right enlarged view). ACE2VLPs are labeled with “H” and SARS-CoV-2 virions with “S.” Source data are provided as a Source Data file.
Fig. 5
Fig. 5. Schematic model of ACE2-mediated SARS-CoV-2 fusion process and fusion intermediates.
a Membrane fusion stages between SARS-CoV-2 and ACE2VLPs, including initial binding (I), extended intermediates (II), partial backfolding intermediates (III), tightly opposing intermediates (IV), dimpling phase (V), hemifusion (VI), fusion pore (VII), full fusion (VIII), and multiple rounds of fusion (IX). The HIV-1 capsid is depicted in light green, and RNPs are shown in yellow. The membrane states in V–VII are depicted in inset. Trypsin cleavage of S2’ triggers the subsequent processes beyond stage III and completes membrane fusion (IV–VIII) (pink arrows), whereas the WS6 S2 antibody blocks the fusion at stage II (purple arrows). b Models of spike fusion intermediates and the states they are associated with in the schematic above. WS6 antibody binds to spikes in states I and II, inhibiting the refolding of state II intermediate. S2’ cleavage triggers a complete refolding from the state III partial backfolding intermediate and the formation of postfusion spike. The image was generated using PDBs 7a97, 6xr8, 8fdw, 6m1d, and 7TCQ. The fusion peptide is shown in yellow, the transmembrane region in navy, heptad region 1 in light green, heptad region 2 in coral, S2’ cleavage site marked with a dashed red bubble, and WS6 in purple.

Update of

Similar articles

References

    1. Lu, R. et al. Genomic characterisation and epidemiology of 2019 novel coronavirus: implications for virus origins and receptor binding. Lancet395, 565–574 (2020). - PMC - PubMed
    1. Zhou, P. et al. A pneumonia outbreak associated with a new coronavirus of probable bat origin. Nature579, 270–273 (2020). - PMC - PubMed
    1. Peiris, J. S. et al. Coronavirus as a possible cause of severe acute respiratory syndrome. Lancet361, 1319–1325 (2003). - PMC - PubMed
    1. Zaki, A. M., van Boheemen, S., Bestebroer, T. M., Osterhaus, A. D. & Fouchier, R. A. Isolation of a novel coronavirus from a man with pneumonia in Saudi Arabia. N. Engl. J. Med. 367, 1814–1820 (2012). - PubMed
    1. de Haan, C. A. & Rottier, P. J. Molecular interactions in the assembly of coronaviruses. Adv. Virus Res64, 165–230 (2005). - PMC - PubMed

MeSH terms

Substances

LinkOut - more resources