. 2025 Jun 4;16(1):5165.
doi: 10.1038/s41467-025-60314-2.

Efficient generation of germline chimeras in a non-rodent species using rabbit induced pluripotent stem cells

Affiliations

Efficient generation of germline chimeras in a non-rodent species using rabbit induced pluripotent stem cells

Hong-Thu Pham et al. Nat Commun. .

Abstract

Pluripotent stem cells have long been used to produce knockout mice via germline chimera technology. However, aside from the rat, this approach has not been successfully applied to other mammals. Here, we demonstrate that rabbit induced pluripotent stem cells (iPSCs) can be reprogrammed using KLF2, ERAS and PRMT6, enabling them to efficiently colonize embryos. These chimeric embryos can develop into fetuses and newborn rabbits, with iPSCs contributing up to 100 % to certain organs. Notably, female rabbits generated through this method are healthy and transmit the iPSC genome to their offspring with a high efficiency, demonstrating germline chimerism. This advancement establishes a foundation for developing rabbit models of human disease with complex genetic traits.


Conflict of interest statement

Competing interests: The authors declare no competing interests.

Figures

Fig. 1
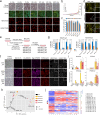
Fig. 1. A culture regimen and reporter cell line for naïve pluripotency in rabbit.
a Experimental scheme of B19_VAL, B19_VAL_14d, NaiveRep_KF, and NaiveRep_VAL cell line generation. b Immunostaining for SOX2, OCT4, DPPA5, OOEP, 5mC, H3K9me3, H3K14ac, and H3K4me3 in B19 cells before (_KF) and after (_VAL) switching to VALGöX culture medium. Scale bars: 50 µm for immunostainings, 100 µm for phase contrast. Violin plots show fluorescence intensity distribution. Means and standard deviations were calculated from measurements in at least 1,000 cells per condition (exact n indicated for each, from independent experiments: 3 for OCT4, OOEP, DPPA5, and 5mC; 4 for SOX2; 5 for H3K14ac and H3K4me3; 6 for H3K9me3). Comparisons between KF and VAL conditions were made using a two-sided Welch’s t-test for unequal variances. No significant differences were observed for SOX2 and H3K4me3 (difference between means <10%) and OCT4 (p = 0.35). Source data are provided in the Source Data file. c Heatmap of differentially expressed genes between B19_KF and B19_VAL cells (three biological replicates). d Phase-contrast images of B19 cells 48 h (_VAL) and 14 days (_VAL_14d) after transfer to VALGöX culture medium (5 experiments). Scale bars: 200 µm. e Heatmap of differentially expressed genes between B19_VAL and B19_VAL_14d cells. f Phase-contrast and epifluorescence images of NaiveRep_KF and NaiveRep_VAL cells (5 experiments). Scale bars: 100 µm. g Flow cytometry analysis of parental B19_KF, NaiveRep_KF, and NaiveRep_VAL showing blue and red fluorescence corresponding to EOS-tagBFP and DDPA2-mKO2, respectively. Basal tagBFP expression in NaiveRep_KF cells reflects endogenous ETn promoter activity downstream of the naïve-state-specific distal enhancer of OCT4/POU5F1 in the EOS vector.
Fig. 2
Fig. 2. cDNA library screening.
a Experimental scheme depicting the four screening conditions. b Flow cytometry analysis of EOS-tagBFP and DPPA2-mKO2 expression in 27 NaiveRep_KF cell lines. c Genomic PCR analysis showing proviral integrations in the 27 NaiveRep_KF cell lines. d Flow cytometry analysis of EOS-tagBFP and DPPA2-mKO2 expression in 14 NaiveRep_FCS + LIF cell lines. e Flow cytometry analysis of EOS-tagBFP and DPPA2-mKO2 expression in 3 NaiveRep_KOSR + LIF cell lines. f Genomic PCR analysis identifying the cDNAs integrated in the 14 NaiveRep_FCS + LIF cell lines and 3 NaiveRep_KOSR + LIF cell lines. g Flow cytometry analysis of EOS-tagBFP and DPPA2-mKO2 expression in 32 NaiveRep_VALGöX cell lines. h Genomic PCR analysis identifying cDNAs in 21 of the 32 NaiveRep_VALGöX cell lines. i Immunostaining for H2AK119Ub and H3K27me3 in four NaiveRep_VALGöX cell lines (from two independent experiments). Scale bars: 20 µm. j Histograms showing the percentage of cells with H2AK119Ub and H3K27me3 nuclear foci in four NaiveRep_VALGöX cell lines and in NaiveRep_VAL control cells. All cells were quantified individually (exact n indicated) from two independent experiments, except for H2AK119Ub analysis in lines #16 and # 25, which were analyzed in three independent experiments. Each dot represents the mean percentage of cells with nuclear foci per replicate; error bars indicate mean ± SEM. Statistical comparisons to NaiveRep_VAL controls were performed using a two-sided Welch’s t-test for unequal variances. For H2AK119Ub, a reduced percentage of cells with nuclear foci was observed in all NaiveRep_VALGöX cell lines (#1, #14, #16, and #25; p = 0.17, 0.01, 0.00006, and 0.00003, respectively). For H3K27me3, Line #1 was not significantly different from controls (p = 0.30), while lines #14, #16, and #25 showed reduced percentage of cells with nuclear foci (p = 0.09, 0.001, and 0.002, respectively). Source data are provided in the Source Data file.
Fig. 3
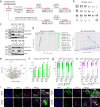
Fig. 3. Stabilization of a naïve-like pluripotent state with a KLF2/ERAS/PRMT6 gene cocktail.
a Phase-contrast and confocal images of B19_VAL before and after single, double, and triple transfection with PiggyBac plasmids expressing KLF2-V5 (K), HA-ERAS (E), and flag-PRMT6 (P). Immunostainings for CD75, H3K27me3 and H2AK119Ub is shown. Scale bars: phase contrast, 100 µm; CD75, 50 µm; histone modifications, 20 µm. b Graphical representing the distribution of fluorescence intensities (between 0 and 200 arbitrary units) for CD75 immunostaining. Source data are provided in the Source Data file. c Percentage of cells with nuclear foci of H3K27me3 and H2AK119Ub across control, single-, double-, and triple-transfected cell populations. Data are from three independent replicates, with each dot representing one replicate. “n” indicates the number of cells analyzed per condition. Bars and error bars represent mean ± SEM. A two-sided Welch’s t-test revealed significantly lower percentages of cells with nuclear foci in KEP_VAL compared to all other conditions (p0.01). Source data are provided in the Source Data file. d Immunostaining of KEP_VAL cells for CD75 and H3K27me3. Scale bar: 40 µm. e Experimental design for generating KEPc_KF and KEPc_VAL stable cell lines. f Phase-contrast and confocal images of control B19_KF, KEPc#37_KF, and KEPc#37_VAL cells stained for KLF2-V5, HA-ERAS, flag-PRMT6, H3R2me2/3, H3K27me3, and H2AK119Ub. Scale bars: phase contrast, 100 µm; immunostainings, 30 µm. g Quantification of cells with H3K27me3 and H2AK119Ub nuclear foci in B19 parental iPSCs, KEPc_KF, and KEPc_VAL cell lines. Values represent means ± SEM from at least 300 cells per condition (exact n provided), based on three independent replicates (additional replicates for parental B19 cells). Each dot indicates a replicate. Two-sided Welch’s t-test was used to compare KF and VAL conditions (p values indicated). Source data are provided in the Source Data file. h Two-dimensional PCA of transcriptomic profiles from five cell populations (B19, KEPc#37, #39, #42, and #44), cultured in two conditions (KF: square; VALGöX: circle), with three biological replicates each. i Histograms showing gene expression levels (RNA-seq) in B19_KF, B19_VAL, KEPc_KF, and KEPc_VAL lines. Mean ± SD are from three independent replicates. j Heatmap of differentially expressed genes among B19_KF and four KEPc_VAL lines (#37, #39, #42, and #44). Genes were selected from a set of 80 differentially expressed genes identified during embryonic development (inner cell mass at E3.5, early epiblast at E4.0, mid-epiblast at E5.0, and late epiblast at E6.0-E6.6).
Fig. 4
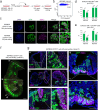
Fig. 4. Colonization of rabbit embryos by iPSCs overexpressing KLF2, ERAS and PRMT6.
a Confocal images of late-blastocyst-stage rabbit embryos (E5.0, 3DIV) following microinjection at the early morula-stage (E2.8) with B19_KF, KEPc#37_KF, KEPc#37_VAL, KEPc#44_KF, and KEPc#44_VAL cells. Scale bars: 50 µM. On the right, intensity profile plots were generated along a line drawn through the inner cell mass (ICM) of each embryo using Fiji. Fluorescence signals across channels (green: GFP; purple: SOX2) indicate co-localization of injected GFP+ cells with SOX2+ regions, suggesting integration into the pluripotent compartment. Images are representative of three independent experiments per cell line and condition. b Percentage of rabbit embryos containing GFP+ cells, based on three independent experiments for each cell line and condition. c Distribution of GFP+ embryos according to the number of GFP+ cells observed, corresponding to the embryos quantified in (b).
Fig. 5
Fig. 5. Design of a reversible KEP expression system for in vivo studies.
a Experimental scheme illustrating the generation of KEPi_VAL + S and KEPi_VAL + S-S cell line. b G-banding karyotype analysis of KEPi#28_VAL + S cells. c Western blot analysis of KLF2-V5 and HA-ERAS expression in KEPi#13, KEPi#18, KEPi#28, and KEPi#36 cells, before and after withdrawal of Shield1 (two biological replicates). Source data are provided in the Source Data file. d Two-dimensional PCA of transcriptomic profiles from the indicated cell lines (three biological replicates). e A volcano plot of differentially expressed genes (DEGs) between KEPi_VAL + S and KEPi_VAL + S–S cells, based on a Mann–Whitney U-test. f Percentage of rabbit embryos containing GFP+ cells after microinjection of each cell line (three independent experiments). g Distribution of embryos according to the number of GFP+ cells per embryo (three independent experiments). h Distribution of embryos according to the number of GFP+/SOX2+ cells per embryo (three independent experiments). i Confocal images of late-blastocyst-stage rabbit embryos (E5.0, 3DIV) after microinjection of KEPi_VAL + S and KEPi_VAL + S-S cells into morula-stage (E2.8) embryos. Scale bars: 50 µm. Images are representative of three independent experiments per cell line and condition.
Fig. 6
Fig. 6. Chimerism induced by KEP_VAL_CD75high cells in rabbit fetuses.
a Experimental scheme for the isolation and analysis of CD75high subpopulations from KEPi#28_VAL + S cells. b Flow cytometry plot showing sorting of the CD75high subpopulation from KEP#28_VAL + S cells. c Confocal images of late-blastocyst-stage rabbit embryos (E5.0, 3DIV) after microinjection of KEPi#28_ CD75high cells into morula-stage (E2.8) embryos. Images are representative of three independent experiments. Scale bars: 50 µm. d Percentage of embryos containing GFP+ cells for each condition. e Percentage of embryos containing more than 20 GFP+ cells per embryo. f GFP+ chimeric rabbit fetus was recovered at embryonic day 10.5 (E10.5) from two independent experiments. Scale bar: 200 µm. g Confocal images of transverse sections from an E10.5 chimeric fetus showing GFP+ cells labeled with anti-GFP antibody in multiple tissues: the neural tube (co-labeled with TUJ1 and SOX2), the heart (co-labeled with SMA), and the somites (co-labeled with PAX3). Images represent three technical replicates. Scale bars: 20 µm.
Fig. 7
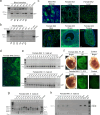
Fig. 7. Somatic and germline chimerism induced by KEP_VAL_CD75high cells in adult rabbits.
a, b Gel electrophoresis of PCR amplification products for GFP DNA sequences in genomic DNA extracted from peripheral blood cells (a) and buccal swabs (b) of six viable chimeric animals (one biological replicate). c Confocal microscopy images of tissue sections from chimeras #A2 and #A5 showing GFP+ cells labeled with anti-GFP antibody in muscle (scale bar: 250 µm), lung, liver, ovary (50 µm), skin (25 µm), and tongue (500 µm). Images represent three technical replicates per tissue. d Confocal image of a primary ovarian follicle labeled with anti-GFP in a section from female chimera #A6 (scale bar: 75 µm; three technical replicates). e Gel electrophoresis of PCR amplification products for GFP DNA sequences from genomic DNA of E14 F1 embryos obtained after insemination of female chimeras #A2 and #A6 with wild-type sperm (three technical replicates). f Epifluorescence images of whole-mount E14 F1 embryos and a non-chimeric control (one biological replicate). g Identification of four transgene integration sites in KEPi#28 donor cells and F1 fetuses via ligation-mediated PCR. Asterisks (*) indicate specific PCR bands confirmed by sequencing in KEPi#28 and F1 fetuses #16 and #19. Bands observed in other fetuses were not further analyzed. “ns” denotes non-specific PCR products with unreadable sequences (two technical replicates). h PCR amplification of genomic DNA from F1 fetuses confirming the integration of the GFP transgene at a Chromosome 1 locus identified in KEPi#28 cells via ligation-mediated PCR. REF, rabbit embryonic fibroblasts (negative control). Two technical replicates were performed.
Fig. 8
Fig. 8. Transcriptomic signature of iPSCs associated with enhanced embryonic colonization.
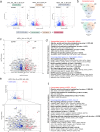
a Volcano plot representation of differentially expressed genes (DEGs) in the comparisons between B19_KF and B19_VAL, B19_KF and KEPc_KF, and B19_KF and KEPc_VAL. The dotted box highlights the region magnified in (c). b Venn diagrams illustrating the overlap of upregulated and downregulated genes among three comparisons: “VALGöX effect”, “KEP effect”, and the combined “KEP + VALGöX synergistic effect”. c Enlarged volcano plot from (a), showing DEGs between B19_KF and KEPc_VAL. d KEGG pathway enrichment analysis of the DEGs associated with the “KEP + VALGöX synergistic effect”, highlighting biological pathways enriched among the upregulated and downregulated genes. e Volcano plot showing DEGs between B19_VAL and KEPi_VAL + S. f KEGG pathway enrichment analysis based on the DEGs identified in (e). For all analyses, a Mann–Whitney U-test (R base package, version 4.1.2) was used to compare medians between groups. A p value <0.05 was considered statistically significant.

References

    1. Bradley, A., Evans, M., Kaufman, M. H. & Robertson, E. Formation of germ-line chimaeras from embryo-derived teratocarcinoma cell lines. Nature309, 255–256 (1984). - PubMed
    1. Okita, K., Ichisaka, T. & Yamanaka, S. Generation of germline-competent induced pluripotent stem cells. Nature448, 313–319 (2007). - PubMed
    1. Nichols, J. & Smith, A. Naive and primed pluripotent states. Cell Stem Cell4, 487–492 (2009). - PubMed
    1. Brons, I. G. et al. Derivation of pluripotent epiblast stem cells from mammalian embryos. Nature448, 191–195 (2007). - PubMed
    1. Tesar, P. J. et al. New cell lines from mouse epiblast share defining features with human embryonic stem cells. Nature448, 196–199 (2007). - PubMed

MeSH terms

Substances

LinkOut - more resources