. 2025 Jun 3;16(1):5137.
doi: 10.1038/s41467-025-59612-6.

Sonic hedgehog medulloblastomas are dependent on Netrin-1 for survival

Affiliations

Sonic hedgehog medulloblastomas are dependent on Netrin-1 for survival

Julie Talbot et al. Nat Commun. .

Abstract

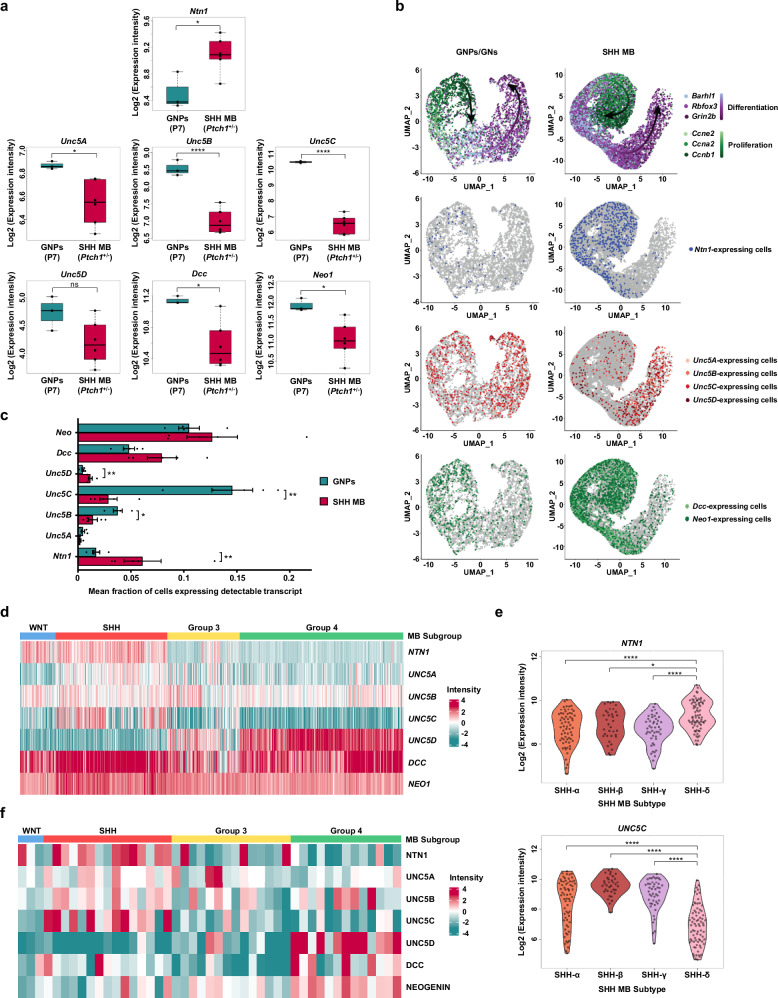
Netrin-1 signaling is an essential prototypical neuronal guidance mechanism during embryonic development that also regulates tumor cell survival in a variety of adult cancer entities. In line with these data, a monoclonal netrin-1 blocking antibody (anti-netrin-1 mAb/NP137) has been preclinically developed and netrin-1 blockade has recently been investigated in phase 1 and 2 clinical trials in several adult cancers. Here, we investigate the role of netrin-1 in the most common malignant pediatric brain cancer, Medulloblastoma. Interestingly, we find that netrin-1 is upregulated in medulloblastoma subgroups associated with developmental dysregulation, in particular in medulloblastoma with Sonic Hedgehog (SHH) activation. First, we demonstrate that genetic deletion of netrin-1 or systemic treatment with the clinical-stage anti-netrin-1 blocking antibody significantly reduces tumor growth in vivo in various orthotopic models of SHH medulloblastomas. Second, in vitro and in vivo, we unexpectedly uncover that SHH medulloblastomas treated with an SHH-inhibitor targeting Smoothened (SMO) increase netrin-1 expression, paving the way for combinatorial therapy. In line with that, we next show that netrin-1 blockade potentiates the efficacy of SMO inhibitor therapy in vivo. Together, our data indicate that, netrin-1 blockade, used as monotherapy or in combination with SMO inhibitors, is a promising therapeutic strategy in SHH medulloblastomas.


Conflict of interest statement

Competing interests: P.M. declared to have a conflict of interest as shareholder of Netris Pharma. The remaining authors declare no competing interests.

Figures

Fig. 1
Fig. 1. Netrin-1 is upregulated in mouse and human SHH MB.
a Boxplots summarizing the expression of murine Ntn1, Unc5A, Unc5B, Unc5C, Unc5D, Dcc and Neo1 analyzed from the Affymetrix dataset of Kutscher et al. in Granule Neuron Progenitors (GNPs; n = 3) compared to SHH MB tumors (n = 6). Results are expressed as Log2FoldChange. The box part of the boxplots represents the interquartile range while the whisker bonds of the boxplots indicate the highest and smallest values within 1.5 times interquartile range above and below the 75th and 25th quantiles, respectively. (two-tailed t test. ****p < 0.0001, *p = 0.012 (Ntn1 and Neo1) = 0.037 (Unc5A) = 0.023 (Dcc), ns: not significant). b t-SNE projection of cells from WT P7 cerebella (n = 5) and SHH MB tumors (n = 5), from Math1-Cre/SmoM2 transgenic mice, based on PCA and color-coded for the expression of indicated markers. Analyses were performed using previously published single-cell RNA sequencing (scRNA-seq) data. c Histograms represent the quantification of cells expressing detectable transcript from WT P7 cerebella (n = 5) and SHH MB tumors (n = 5) of Math1-Cre/SmoM2 transgenic mice, shown in (b). The results are expressed as mean ± SEM. (two-tailed Mann–Whitney test. **p = 0.0079, *p = 0.0159). d Heatmap of NTN1, UNC5A, UNC5B, UNC5C, UNC5D, DCC and NEO1 genes expression analyzed from Cavalli’s transcriptomic data performed by Affymetrix array using 763 primary medulloblastoma samples of patients. Color bars indicate medulloblastoma subgroups. Genes in red color are overexpressed, and those in blue are downregulated. e Violin plots summarizing the expression of NTN1 and UNC5C in the different SHH MB subtypes from the transcriptomic dataset of Cavalli (SHH-α = 65, SHH-β = 35, SHH-γ = 47, SHH-δ = 76). Results are expressed as Log2FoldChange. (two-tailed t test. ****p < 0.0001, *p = 0.01). f Heatmap of NTN1, UNC5A, UNC5B, UNC5C, UNC5D, DCC and NEOGENIN protein expression analyzed from Archer’s proteomic dataset of 45 primary medulloblastoma samples of patients. Color bars indicate medulloblastoma subgroups. Genes in red color are overexpressed, and those in blue are downregulated.
Fig. 2
Fig. 2. Netrin-1 deletion in postnatal cerebellar granule neuron progenitors does not impair SHH MB formation.
a Representative image of in situ hybridization of Ntn1 mRNA and immunostaining of netrin-1 and CaBP, in P7 mouse cerebellum. The nuclei were stained with DAPI (scale bar: 50 µm). b Genotyping obtained by PCR on Atoh1CreERT2+; Ptch1flox/flox mice depending on Ntn1 expression: Ntn1wt/wt, Ntn1flox/wt and Ntn1flox/flox. c Kaplan-Meier survival curve of tamoxifen treated-Atoh1CreERT2+; Ptch1flox/flox mice depending on Ntn1 expression: Ntn1wt/wt (n = 8) compared to Ntn1flox/wt (n = 16) and Ntn1flox/flox (n = 8) (ns: not significant). d Representative images of SHH MB developed in tamoxifen treated-Atoh1CreERT2+; Ptch1flox/flox mice depending on Ntn1 expression: Ntn1wt/wt and Ntn1flox/flox. Atoh1CreERT2− mice were used as a control. Cerebellum slices were stained with Hematoxylin and Eosin (H&E), and Ki-67 immunostaining was performed (scale bar: 500 µm). e Gli1, Gli2 and Atoh1 mRNA expression analyzed by quantitative PCR in cerebellum from tamoxifen treated-Atoh1CreERT2+; Ptch1flox/flox mice depending on Ntn1 expression: Ntn1wt/wt (n = 6), Ntn1flox/wt (n = 8) and Ntn1flox/flox (n = 8). Atoh1CreERT2− (n = 5) mice were used as a control. The results are expressed as mean ± SEM. (two-tailed Mann-Whitney test, compared to Atoh1CreERT2− group: Ntn1wt/wt **p = 0.0087 (Atoh1), *p = 0.0426 (Gli1) = 0.0303 (Gli2); Ntn1flox/wt **p = 0.0047 (Gli1) = 0.0027 (Gli2) = 0.001 (Atoh1); Ntn1flox/flox **p = 0.0047 (Gli1) = 0.0016 (Gli2) = 0.0054 (Atoh1)).
Fig. 3
Fig. 3. Netrin-1 plays a role in SHH MB cell survival and tumor growth.
a, b Primary murine SHH MB cells (from Ptch1+/− mouse model) were infected with shNtn1 prior measurement of survival using the IncuCyte live-imaging system. Cell confluence (a) was monitored during 72h, and cell death (b) was assessed using propidium iodide (PI) uptake over time. (mean ± SD; n = 6; two-way ANOVA, compared to shCtrl: ****p < 0.0001). c, d SHH MB PDX cells (ICN-MB-PDX12) were infected with shNTN1 prior measurement of survival using IncuCyte. Cell number was quantified by counting at indicated time. Living cell number was expressed as a fold increase over control ((c); mean ± SEM; n = 6; two-way ANOVA. ****p < 0.0001, ***p = 0.0001, **p = 0.0012) and cell death ((d); mean ± SEM; n = 7; two-way ANOVA. ****p < 0.0001, ***p = 0.0004, **p = 0.0046) corresponds to the percentage of PI-positive cells. e Kaplan-Meier curves show the effect of loss of Ntn1 expression on survival of pups orthotopically transplanted with murine SHH MB cells (from the Ptch1+/− mouse model) infected with shCtrl (n = 11) or two different shNtn1, #1 (n = 13) or #2 (n = 14). (Log-Rank (Mantel-Cox) test, compared to shCtrl: ***p = 0.0004, **p = 0.002). f, g Primary murine SHH MB cells (from the Ptch1+/− mouse model), infected with shCtrl or two different shNtn1, were daily treated or not with a murine recombinant netrin-1 protein (25 ng/ml) to assess the specificity of the shNtn1. Cell confluence (f) was monitored during 96h using IncuCyte. (mean ± SEM; n = 3; two-way ANOVA. ****p < 0.0001, ***p = 0.0004, **p = 0.0033). Cell death, assessed using PI uptake over time, was represented at 72h (g). (mean ± SEM; n = 3; one-way ANOVA. shNtn1#1 *p = 0.0261; shNtn1#2 *p = 0.013). h, i SHH MB PDX cells (ICN-MB-PDX12), infected with shCtrl or a human shNTN1, were daily treated or not with a human recombinant NETRIN-1 protein (600 ng/ml) to assess the specificity of shNTN1. Cell survival was monitored during 96h using IncuCyte. Cell number was quantified by counting at indicated time. Living cell number was represented as a fold increase over control ((h); mean ± SEM; n = 5; two-way ANOVA. ****p < 0.0001; ***p = 0.0002; shCtrl vs shNTN1 **p = 0.0027; shNTN1 vs shNTN1 + recNTN1 **p = 0.009; *p = 0.012) and cell death ((i); mean ± SEM; n = 5; two-way ANOVA. ****p < 0.0001; ***p = 0.0005; shCtrl vs shNTN1 **p = 0.0031 (24h) = 0.0067 (96h); shNTN1 vs shNTN1 + recNTN1 **p = 0.0046 (48h) =0.0072 (72h), *p = 0.0319 (24h) =0.0106 (96h)) corresponds to the percentage of PI-positive cells.
Fig. 4
Fig. 4. Pharmacological inhibition of Netrin-1 signaling by NP137 induces cell death and inhibits tumor growth of SHH MB PDX.
ac SHH MB PDX (ICN-MB-PDX12) cells were treated once with Control or NP137 (80 µg/ml) during 96h, under IncuCyte monitoring. Cell number was quantified by counting and was represented either as a ratio to seeded cell number at 0h ((a); n = 4; mean ± SEM; two-way ANOVA. ****p < 0.0001) or as a fold over control ((b); n = 4; mean ± SEM; two-way ANOVA. 24h **p = 0.0022; 48h ***p = 0.0003; 72h **p = 0.0012; 96h ***p = 0.0001). Cell death was assessed using PI ((c); n = 6; mean ± SEM; two-way ANOVA. 24h *p = 0.0314; 48h *p = 0.0436). d, e GNP cells (P7), isolated from mouse developing cerebellum, were treated once at the indicated NP137 concentrations for 96h. Cell confluence (d) and cell death (e) were assessed using IncuCyte. (mean ± SD; n = 3; two-way ANOVA. not significant). fi Nude mice (n = 7/group), injected subcutaneously with SHH MB PDX (ICN-MB-PDX12) cells, were treated with NP137 (15 mg/kg, 3 times/week) or vehicle. f Graph shows tumor growth. (mean ± SEM; two-way ANOVA. ****p < 0.0001). g Kaplan-Meier curves show the overall survival rates. (Log-Rank (Mantel-Cox) test. **p = 0.005). Images ((h), magnification ×40; scale bar: 50 µm) and quantification (i) of immunostaining for Ki-67 or cleaved Caspase-3 (CC3) in tumor samples. (n = 7/group; mean ± SEM; two-tailed unpaired t test. **p = 0.0049, *p = 0.017). j The ability of NP137 (15 mg/kg) to cross the BBB was evaluated in healthy C57BL/6 mice treated during 24h (n = 3/group). Images of cerebellum immunostained for anti-human IgG1, used to detect NP137 antibody, are shown (scale bar: 50 µm). k, l NP137 (15 mg/kg) or vehicle were injected subcutaneously in symptomatic C57BL/6 Ptch1+/− mice (n = 4/group) for 4 days, as illustrated in the diagram ((k), Created in BioRender. https://BioRender.com/s18l552). l Images (scale bar: 40 µm) and quantification of immunostaining for Ki-67 and CC3 in tumor samples. (mean ± SEM; two-tailed unpaired t test. ****p < 0.0001). m Immunocompetent C57BL/6 mice, injected orthotopically with murine SHH MB cells (Ptch1+/−) were treated with NP137 (15 mg/kg, 3 times/week) or vehicle. Kaplan-Meier curves show the overall survival rates. (Log-Rank (Mantel-Cox) test. *p = 0.047). In (f, g, and m), the arrow indicates the start of treatment.
Fig. 5
Fig. 5. The combination of a SMO inhibitor and an anti-netrin-1 mAb synergizes to inhibit SHH MB tumor growth.
a, b Murine SHH MB cells, from the Ptch1+/− mouse model, were treated with either 1) NP137 (40 µg/ml), 2) GDC-0449 (10 nM), 3) the association of NP137 and GDC-0449, or 4) respective controls for 72h. The effect of these treatments was evaluated on cell survival over time, using the IncuCyte. a Cell confluence images at 0h and 72h (scale bar: 150 µm). b Cell death, corresponding to the percentage of PI positive cells, is represented at 48h and 72h. (mean ± SD; n = 3; two-way ANOVA. **p = 0.0072, *p = 0.0409). c Representation of calculated synergy maps (3D on the left and 2D on the right) based on dose response matrix (5 × 5). Murine SHH MB cells (Ptch1+/− model) were treated with a range of NP137, GDC-0449, or a combination of both drugs for 48h, followed by a luminescence-based assay for cell viability. Synergy score was calculated using the HSA reference model. Negative scores indicate antagonism (green) and positive scores indicate synergy (red). d Nude mice (n = 5/group), injected subcutaneously with murine SHH MB (Ptch1+/− model) cells, were treated with NP137 (15 mg/kg, 3 times/week or its control) and GDC-0449 (2.5 mg/kg, 5 times/week or its control). Graph shows tumor growth. (mean ± SEM; two-tailed Mann-Whitney test at final point, compared to “NP137 + GDC-0449” group: **p = 0.0041 (Control), *p = 0.0221 (NP137), *p = 0.0303 (GDC)). e, f Nude mice (n = 6/group), injected subcutaneously with human SHH MB PDX (Med-1712FH) cells, were treated with NP137 (10 mg/kg, 3 times/week or its control) and GDC-0449 (35 mg/kg, 5 times/week or its control). e Graph shows tumor growth. (mean ± SEM; two-way ANOVA, compared to “NP137 + GDC-0449” group: ****p < 0.0001 (Control), **p = 0.0018 (NP137), *p = 0.0231 (GDC)). f Human GLI1 and NTN1 mRNA levels were determined by quantitative RT-PCR in tumor samples. (mean ± SEM; one-way ANOVA, compared to Control group: GDC-0449 ***p = 0.0007 (GLI1), *p = 0.0467 (NTN1); Combo ***p = 0.0005 (GLI1), *p = 0.0331 (NTN1)). In (d and e), the arrow indicates the start of treatments.
Fig. 6
Fig. 6. SMO inhibitors activate Netrin-1 signaling pathway.
a qPCR of Ntn1 and Gli1 mRNA levels in murine SHH MB cells upon GDC-0449 treatment (1 µM, 24h). (mean ± SEM; n = 5; two-tailed Mann-Whitney test. **p = 0.0079). b Netrin-1 and Gli1 protein levels were determined by Western Blot in murine SHH MB cells upon GDC-0449 treatments (1–2.5 µM, 48h). Results are representative of three independent experiments. c qPCR of Ntn1 and Gli1 mRNA levels in murine SHH MB cells upon GDC-0449 treatments (24h). (mean ± SEM; n = 6; Kruskal Wallis test, compared to Control: ****p < 0.0001, ***p = 0.0002, **p = 0.0019 (Ntn1/GDC 100 nM) = 0.0032 (Ntn1/GDC 500 nM), *p = 0.0147 (Gli1/GDC 100 nM) = 0.0221 (Ntn1/GDC 250 nM). d qPCR of Ntn1 and Gli1 mRNA levels in murine SHH MB cells upon NVP-LDE225 treatments (24h). (mean ± SEM; n = 6; Kruskal Wallis test, compared to Control: ****p < 0.0001, ***p = 0.0002, **p = 0.0065, *p = 0.042 (Ntn1/LDE 50 nM) = 0.0108 (Ntn1/LDE 100 nM). e qPCR of Ntn1, Gli1, and Smo mRNA levels in murine SHH MB infected cells with shCtrl or two shSmo. (mean ± SEM; n = 5; two-tailed Mann-Whitney test, compared to shCtrl: **p = 0.0079). f Boxplots of Ntn1 mRNA expression upon GDC-0449 treatment (1 µM, 8h) in murine SHH MB cell line (SMB56, from Ptch1+/− mouse model), analyzed from the public RNAseq database of Liu et al. (Series GSE130485). (n = 2, median, interquartile 25th/75th. Two-tailed Wald test. ****p < 0.0001). g qPCR of Ntn1 and Gli1 mRNA levels in murine SHH MB cells treated 24h with GDC-0449 (1 µM) or GANT61 (25 µM). (mean ± SEM; n = 4; two-tailed unpaired t test, compared to Control: ****p < 0.0001, *p = 0.0211 (Ntn1) = 0.0299 (Gli1)). h qPCR of Ntn1, Gli1 and Gli3 mRNA levels measured 24h after Gli1- or Gli3-overexpression. (mean ± SEM; n = 3; two-tailed Mann-Whitney test. ****p < 0.0001, ***p = 0.0004). i qPCR of Ntn1 and Gli1 mRNA levels in murine SHH MB cells, from two distinct Ptch1+/−; Trp53−/− mouse models, upon GDC-0449 treatment (1 µM, 24h). (mean ± SEM; n = 4; two-tailed Mann-Whitney test. **p = 0.0079, *p = 0.0286). jl Analyses from public Affymetrix database from Buonamici et al. (Series GSE19657). SHH MB, from Ptch1+/−; p53−/− mouse model, were treated in vivo with NVP-LDE225 (20 mg/kg/day, 4h or 16h; n = 3/group). j Boxplots of Ntn1 mRNA expression. (expressed as Log2FoldChange. median, interquartile 25th/75th. two-tailed t test. ****p < 0.0001, ns: not significant). k Volcano plot of differentially expressed genes. l Enrichment pathways analysis performed with PANTHER tool.
Fig. 7
Fig. 7. Netrin-1 is a survival factor in proliferative cells upon anti-SMO treatment.
a t-SNE projection of tumor cells from the spontaneous Math1-Cre/SmoM2 SHH MB mouse model (M-Smo mice) treated with vehicle (n = 5) or Vismodegib (n = 5), based on PCA and color-coded for the expression of indicated markers. Metaclusters are defined by hierarchical clustering of single-cell RNA clusters. The percentage of cells expressing the genes of interest are quantified in the proliferative (green), intermediate (blue) and differentiating (purple) subsets. Analyses were performed using previously published single-cell RNA sequencing (scRNA-seq) data. b Representation of calculated synergy maps (3D above and 2D below) based on dose response matrix. Primary murine SHH MB cells, from the hGFAP-Cre/SmoM2 (G-Smo) model, were treated with a range of NP137, GDC-0449, or a combination of both drugs in an 5 × 5 matrix as indicated, for 72h, followed by a luminescence-based assay for cell viability. Synergy score was calculated using the HSA reference model. Negative scores indicate antagonism (green) and positive scores indicate synergy (red). Results are representative of three independent experiments.

References

    1. Guerreiro Stucklin, A. S., Ramaswamy, V., Daniels, C. & Taylor, M. D. Review of molecular classification and treatment implications of pediatric brain tumors. Curr. Opin. Pediatr.30, 3–9 (2018). - PubMed
    1. Northcott, P. A., Korshunov, A., Pfister, S. M. & Taylor, M. D. The clinical implications of medulloblastoma subgroups. Nat. Rev. Neurol.8, 340–351 (2012). - PubMed
    1. Taylor, M. D. et al. Molecular subgroups of medulloblastoma: the current consensus. Acta Neuropathol.123, 465–472 (2012). - PMC - PubMed
    1. Hovestadt, V. et al. Medulloblastomics revisited: biological and clinical insights from thousands of patients. Nat. Rev. Cancer20, 42–56 (2020). - PMC - PubMed
    1. Cavalli, F. M. G. et al. Intertumoral heterogeneity within medulloblastoma subgroups. Cancer Cell31, 737–754.e6 (2017). - PMC - PubMed

MeSH terms

LinkOut - more resources