. 2025 Jun 3;16(1):5154.
doi: 10.1038/s41467-025-60293-4.

Inhibition of tumor-intrinsic NAT10 enhances antitumor immunity by triggering type I interferon response via MYC/CDK2/DNMT1 pathway

Affiliations

Inhibition of tumor-intrinsic NAT10 enhances antitumor immunity by triggering type I interferon response via MYC/CDK2/DNMT1 pathway

Wan-Cheng Liu et al. Nat Commun. .

Abstract

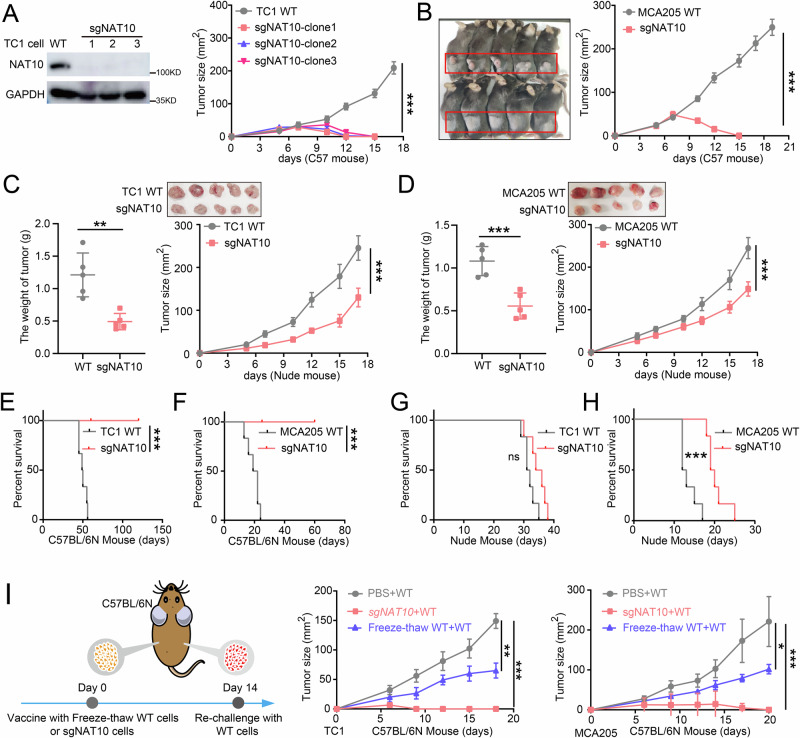
Posttranscriptional modifications are involved in cancer progression. However, the function and regulatory mechanism of mRNA acetylation modification remains largely unknown. Here, we discover an unexpected role of N4-acetylcytidine (ac4C) RNA acetyltransferase NAT10 in reshaping the tumor immune microenvironment. By analyzing patients' data, we find that NAT10 is upregulated in tumor tissues, and negatively correlated with immune cell infiltration and overall survival. Loss of tumoral NAT10 enhances tumor-specific cellular immune response and suppresses tumor growth. Mechanistically, MYC is identified as a key downstream target of NAT10 via enhancing mRNA ac4C modification. Inhibition of NAT10 blocks the MYC/CDK2/DNMT1 pathway, enhances double-stranded RNA (dsRNA) formation, which triggers type I interferon response and improves tumor specific CD8+ T cell response in vivo. More importantly, the inhibition of NAT10, using either small molecule inhibitor (Remodelin) or PEI/PC7A/siNAT10 nanoparticles, synergize PD-1 blockade in elevating anti-tumor immune response and repressing tumor progression. Our findings thus uncover the crucial role of tumor-intrinsic NAT10 in tumor immune microenvironment, which represents a promising target for enhancing cancer immunotherapy.


Conflict of interest statement

Competing interests: The authors declare no competing interests.

Figures

Fig. 1
Fig. 1. Elevated NAT10 expression is associated with decreased survival and reduced infiltration of immune cells in cancer.
A The expression of NAT10 was assessed in different stages of LUAD using the GEPIA website (http://gepia.cancer-pku.cn/). B Kaplan-Meier survival curve comparing the high- and low-NAT10 expression groups (optimal cut-off) in the TCGA-LUAD cohort. C Kaplan-Meier survival curve comparing the high- and low-NAT10 expression groups in 37 patients with lung cancer. NAT10 expression was quantified using immunohistochemistry and Image Pro Plus. Statistical significance was determined using the log-rank test. D ROC curves for survival prediction with corresponding AUC values. The area under the curve (AUC) was calculated, and the statistical significance of AUC comparison between groups was determined using the DeLong test. E, F Tumor weight and growth curves for C57BL/6 N mice inoculated with TC1 (E) or MCA205 tumor cells (F). 2 × 106 WT cells were subcutaneously inoculated into the back of C57BL/6 N mice; n = 5 mice per group. Mice received Remodelin or saline via oral gavage for the first 5 days at a dose of 100 mg/kg. Tumor size was measured daily using calipers to generate growth curves. Tumor growth curves were analyzed by two-way ANOVA with the tumor size at the final day used for significance testing. From left to right, **P = 0.004; ***P < 0.001; **P = 0.0015; ***P < 0.001, respectively. G, H Tumor weight and growth curves for nude/nude mice inoculated with TC1 (G) or MCA205 tumor cells (H). 2 × 106 WT cells were subcutaneously inoculated into the back of C57BL/6 N mice; n = 5 mice per group. Mice received Remodelin or saline via oral gavage for the first 5 days at a dose of 100 mg/kg. I Analysis of immune cell infiltration using the CIBERSORT algorithm between high- and low-NAT10 expression groups in the TCGA-LUAD cohort. J Immunohistochemical analysis of NAT10 expression and CD8+ T cell infiltration in patient-derived lung cancer samples (n = 37). CD8+ T cell counts in the high- and low-NAT10 expression groups are presented on the right. The arrow indicates CD8+ T cells; Scale bar: 50 µm; *P = 0.0484. Unless specified otherwise, the data are presented as means ± SEM (error bar) and compared using the two-sided Student’s t test; ns, no significance; Source data are provided as a Source Data file.
Fig. 2
Fig. 2. NAT10 deficiency suppresses tumor growth via immune-dependent mechanisms.
A, B Tumor growth curves for C57BL/6 N mice bearing TC1 (A) or MCA205 (B) tumor cells transplants. 2 × 106 WT or sgNAT10 tumor cells were subcutaneously transplanted into the back and flanks of C57BL/6 N mice (n = 5 mice per group), and tumor growth was monitored with calipers at the indicated time points. Tumor growth curves were analyzed by two-way ANOVA with the tumor size at the final day used for significance testing; ***P < 0.001; ***P < 0.001. C, D Tumor weight and growth curves for nude mice (n = 5 mice per group) inoculated with TC1 (C) or MCA205 tumor cells (D). 2 × 106 WT or sgNAT10 tumor cells were subcutaneously transplanted into nude mice that lacked mature T lymphocytes. Tumor growth was monitored at the indicated time points. Tumor growth curves were analyzed by two-way ANOVA with the tumor size at the final day used for significance testing; **P = 0.0021; ***P < 0.001; ***P = 0.0009; ***P < 0.001. E, F Kaplan-Meier survival curves for C57BL/6 N mice injected with TC1 (E) and MCA205 (F) tumor cells (n = 6 mice per group). 2 × 106 WT or sgNAT10 tumor cells were injected intravenously into C57BL/6 N mice, and the number of dead mice was recorded every day. Statistical significance was determined using Log-rank test; ***P = 0.0005 (E); ***P = 0.0006 (F). G, H Kaplan-Meier survival curves for nude/nude mice injected with TC1 (G) and MCA205 (H) tumor cells (n = 6 mice per group). 2 × 106 WT or sgNAT10 tumor cells were injected intravenously into C57BL/6 N mice, and the number of dead mice was recorded every day. Statistical significance was determined using Log-rank test. ns, no significance, P = 0.0524 (G); ***P = 0.0004 (H). I C57BL/6 N mice were subcutaneously immunized at the left flank with equal numbers of sgNAT10 tumor cells, freeze-thawed WT tumor cells, or PBS (control). Freezing and thawing were performed three times. Fourteen days after immunization, an equivalent number of live WT tumor cells were subcutaneously transplanted into the right flank of immunized mice. A schematic representation of the vaccination experiment with sgNAT10 tumor cells is provided in the left panel. Tumor growth was monitored at the specified time point points; n = 5 mice per group. Tumor growth curves were analyzed by two-way ANOVA with the tumor size at the final day used for significance testing; **P = 0.006; ***P = 0.0003; *P = 0.026; ***P < 0.0008. Unless specified otherwise, the data are presented as means ± SEM (error bar) and compared using the two-sided Student’s t test. Source data are provided as a Source Data file.
Fig. 3
Fig. 3. NAT10 deficiency triggers immune-response signaling and induces cellular immune responses in vivo.
A Gene Set Enrichment Analysis (GSEA) was conducted on the differentially expressed genes between WT and sgNAT10 TC1 tumor tissues (n = 3 biologically independent samples). Three positively regulated ‘hallmark’ signatures were identified: interferon-alpha response, interferon-gamma response, and inflammatory response (left panel). The gene list was ranked based on the signed likelihood ratio (from log2 fold change [log2FC]) comparing sgNAT10 tumors versus WT TC1 tumors (right panel). B Heatmaps illustrating core biological pathways, such as antigen presentation machinery (APM) and CD8+ T effector cells (Teff), and depicting gene expression (color-coded by log2FC) in columns. C Heatmaps depicting biological pathways related to cell cycle and illustrating gene expression (color-coded by log2FC) in columns. D Multichannel imaging and image analysis were employed to investigate immune cell infiltration in the tumor microenvironment. C57BL/6 N mice were subcutaneously transplanted with either WT or sgNAT10 TC1 tumor cells. On day 8, tumor tissues were subjected to a six-color immunofluorescence analysis. The arrow indicates CD8+ T cells, DCs and Treg cells; n = 3 biologically independent samples; ***P < 0.0001. E C57BL/6 N mice (n = 5 mice per group) were subcutaneously inoculated with 2×10^6 WT or sgNAT10 TC1 tumor cells. They were intravenously administered with 200 µg of anti-CD8 antibodies per mouse on days -1, 3, and 5. Red arrows indicate the time points of anti-CD8 antibody injections. Tumor growth was monitored at specified time points, starting on day 0. Tumor growth curves were analyzed by two-way ANOVA with the tumor size at the final day used for significance testing; ***P = 0.0002. F, G Flow cytometry was used to analyze the proportions of major immune cell populations in TC1 (F) and MCA205 (G) tumor tissues (n = 5 mice per group). Tumor tissues from C57BL/6 N mice, transplanted as described in (E), underwent flow cytometry to identify IFN-γ+CD8+ T and GZMB+CD8+ T cells; ***P = 0.0005; *P = 0.0103; *P = 0.0124; **P = 0.0015. H mRNA expression levels of CD8a, IFN-γ, GZMA, GZMB, Cxcl19, and Cxcl10 genes were analyzed using RT-qPCR in TC1 (left panel) and MCA205 (right panel) tumor tissue. Tumor tissues from C57BL/6 N mice transplanted as described in (E) underwent RT-qPCR analysis. Data are presented as fold changes relative to WT tumor (n = 5 mice per group). From left to right, *P = 0.03; ***P < 0.001; ***P < 0.001; ***P < 0.001; *P = 0.038; **P = 0.0077; **P = 0.0036; **P = 0.0069; ***P < 0.001; *P = 0.0284; *P = 0.049; *P = 0.0283; respectively. I ELISpot assay was conducted to measure IFN-γ secretion in TC1 (left panel) and MCA205 (right panel) tumors. Tumor tissues from C57BL/6 N mice (n = 5 mice per group) transplanted as described in (E) underwent ELISpot analysis. The number of spots was quantified using an ELISpot reader. The results are expressed as spot-forming units (SFU); **P = 0.0018 (left); ***P = 0.0003 (right). J, K FACS analysis was performed to assess the proliferation of CD8+ (J) and CD4+ (K) T cells co-cultured with TC1 and MCA205 tumor cells, with or without NAT10 deficiency. The percentage of proliferating (CFSE-low) cells among all labeled CD4+ or CD8+ T cells is shown on the right of (J) and (K) (n = 3 biologically independent samples). From left to right, ***P < 0.001; ***P < 0.001; **P = 0.0057; **P = 0.0018; respectively. Unless specified otherwise, the data are presented as means ± SEM (error bar) and compared using the two-sided Student’s t test. Source data are provided as a Source Data file.
Fig. 4
Fig. 4. NAT10 deficiency induces IFN-I responses in tumor cells.
A, B GSEA was conducted on DEGs between the WT group and the sgNAT10 group of TC1 (A) and MCA205 (B) tumor cells (n = 3 biologically independent samples). Two positively regulated ‘hallmark’ signatures were identified: interferon-alpha response and interferon-gamma response. The heatmaps of the gene list of ‘hallmark’ signatures are shown on the right. C, D The mRNA expression levels of Ifnb, Stat1, Tlr3, Ddx58, Ccl5, Ccl7, Tap1, and Mx2 in WT and sgNAT10 of TC1 (C) and MCA205 (D) tumor cells were detected by RT-qPCR, with normalization to GAPDH (n = 3 biologically independent samples). From left to right, *P = 0.028; ***P < 0.001; **P = 0.0034; ***P < 0.001; ***P < 0.001; ***P < 0.001; **P = 0.002; ***P < 0.001; ***P < 0.001; *P = 0.0213; ***P < 0.001; ***P < 0.001; ***P < 0.001; ***P < 0.001; respectively. E, F WT or sgNAT10 TC1 (E) and MCA205 (F) tumor cells were subcutaneously transplanted into ifnar-/- C57BL/6 N mice (n = 5 mice per group). From left to right, ***P < 0.001; ***P = 0.0003; ***P < 0.001; **P = 0.0058. The tumor weight and growth were monitored at the indicated time points. Unless specified otherwise, the data are presented as means ± SEM (error bar) and compared using the two-sided Student’s t test. Source data are provided as a Source Data file.
Fig. 5
Fig. 5. NAT10 regulates MYC protein expression.
A The highly enriched motif within ac4C peaks was analyzed using acRIPseq. B The proportion of ac4C peak distribution in the TSS, 5’UTR, start codon, stop codon, and 3’UTR regions across the entire set of mRNA transcripts. C Density distribution of ac4C peaks across mRNA transcripts. D Seven candidate genes, including Phf2, Myc, Wwc2, Kmt2a, Gigyf1, Timeless, and Nufip2, were identified using acRIP-seq and label-free quantitative proteomics. E The expression levels of MYC in sgNAT10 TC1 and MCA205 tumor cells were analyzed by Western blotting. F The peaks of myc in WT and sgNAT10 TC1 cells from acRIP-seq data were visualized using the IGV software. G Schematic representation of the positions of ac4C motifs in Myc mRNA (upper panel). The ac4C sites in the 3’UTR of Myc mRNA were mutated to eliminate ac4C sites as much as possible. The lower panel shows the schematic representation of the mutated 3’UTR of the pEZX-MT06 vector for studying the roles of ac4C in Myc mRNA stability. H Effect of NAT10 on pEZX-MT06-Myc reporter. TC1 tumor cells were cultured in 24-well plates and transfected with Lipofectamine 3000 reagent according to the manufacturer’s instructions. Specifically, 100 ng/well of pEZX-MT06-Myc and either 0, 150, or 300 ng/well of VP64-NAT10 or empty vector were co-transfected. Additionally, Renilla luciferase plasmids (30 ng/well) were co-transfected as a normalization control for transcription efficiency. Luciferase activity was measured 24 h after transfection. The results are presented as relative luciferase activity (luciferase activity normalized to Renilla activity); ***P < 0.001; ***P < 0.001. I Anti-NAT10 antibody-based RIP-PCR analysis of Myc mRNA in TC1 cells. J The mRNA levels of MYC were detected in sgNAT10 TC1 cells after treatment with Act-D. The statistical method used was two-way ANOVA; **P = 0.0023. Unless specified otherwise, the data are presented as means ± SEM (error bar). Source data are provided as a Source Data file.
Fig. 6
Fig. 6. Depletion of NAT10 induces dsRNA-mediated RIG-I-dependent signaling through the Myc/CDK2/DNMT1 pathway.
A The FPKM of individual genes of the CDK family from RNAseq data originating from WT and sgNAT10 TC1 tumor cells. Heatmap depicting the CDKs and illustrating gene expression (color-coded by log2FC) (n = 3 biologically independent samples); **P = 0.0065. B The FPKM of individual genes of the DNMT family from RNAseq data originating from WT and sgNAT10 TC1 tumor cells. Heatmap depicting DNMTs and illustrating gene expression (color-coded by log2FC) (n = 3 biologically independent samples); ***P = 0.0004. C Western blotting of DNMT1, CDK2, and NAT10 in matched WT, sgNAT10 TC1 (upper panel), and MCA205 (lower panel) tumor cells. β-actin was used as a loading control. D Representative immunofluorescence staining of dsRNA in WT, sgNAT10, sgCDK2, sgNAT10 Myc-rescued, and sgNAT10 Cdk2-rescued TC1 tumor cells was detected using confocal microscopy. Antibody J2 targeted dsRNA (labeled in red). The corresponding statistical diagrams are shown on the right. Statistical analysis was conducted using one-way ANOVA (n = 15 biologically independent samples); ***P < 0.001; **P = 0.0055. E Representative immunofluorescence staining of dsRNA in WT, sgNAT10, sgCDK2, sgNAT10 Myc-rescued, and sgNAT10 Cdk2-rescued MCA205 tumor cells was detected using confocal microscopy. The corresponding statistical diagrams are shown on the right. Statistical analysis was conducted using one-way ANOVA (n = 15 biologically independent samples); ***P < 0.001; **P = 0.0057. F Protein expression levels of NAT10 and RIG-I in vector, sgNAT10, and sgNAT10/RIG-I TC1 tumor cells determined by Western blotting (upper panel). mRNA expression levels of Ifnb1, Stat1, Tlr3, Ddx58, Ccl5, Ccl7, Tap1, and Mx2 by RT-PCR in vector, sgNAT10, and sgNAT10/RIG-I TC1 tumor cells (n = 3 biologically independent samples). From left to right, all *** indicate P < 0.001; *P = 0.0451. Unless specified otherwise, the data are presented as means ± SEM (error bar) and compared using the two-sided Student’s t test. Source data are provided as a Source Data file.
Fig. 7
Fig. 7. Inhibition of NAT10 enhances the response to ICIs.
A Schematic diagram showing combination therapy of C57BL/6 N mice with Remodelin and ICIs. B, C Tumor weight for C57BL/6 N mice (n = 5 mice per group) inoculated with TC1 (B) or MCA205 (C) tumor cells treated with Remodelin and/or anti-PD-1 antibodies. TC1 or MCA205 tumor cells were inoculated subcutaneously into C57BL/6 N mice. Mice received Remodelin or saline via oral gavage for the first 7 days at a dose of 100 mg/kg. On day 8, mice were treated with IgG control or anti-PD-1 antibodies. After sacrificing the mice, tumor tissues were excised and representative images are shown in the left panel. Statistical significance was determined using One-way ANOVA; from left to right, all *** indicate P < 0.001. D, E Representative immunofluorescence staining of CD8+ T cells in TC1 (D) and MCA205 (E) tumor tissues. Tumor tissues from C57BL/6 N mice (B) were subjected to immunostaining for CD8+ T cells (red) and nuclei (blue). CD8+ T cells were quantified by counting positive signals in 3 randomly selected fields (20×) per tumor section using Image J. Statistical analysis was conducted using One-way ANOVA, n = 15 biologically independent samples. Scale bar, 100 µm; from left to right, all *** indicate P < 0.001. F, G FACS analysis of the proportions of IFN-γ+CD8+ immune cell populations in TC1 (F) and MCA205 (G) tumor tissues. Tumor tissues from C57BL/6 N mice (B) were subjected to FACS analysis for IFN-γ+CD8+ immune cells (n = 5 mice per group). Statistical significance was determined using One-way ANOVA; from left to right, ** P = 0.0027; ** P = 0.0063; ***P < 0.001; *** P < 0.001. H, I ELISpot assay was conducted to measure IFN-γ secretion in TC1 (H) and MCA205 (I) tumor tissues after different treatments. The number of spots and the results were quantified (n = 5 mice per group). Statistical significance was determined using One-way ANOVA; from left to right, ** P = 0.0039; ***P < 0.001; ** P = 0.0011; *** P = 0.0002. Unless specified otherwise, the data are presented as means ± SEM (error bar). Source data are provided as a Source Data file.
Fig. 8
Fig. 8. Intratumoral delivery of PEI/PC7A/siNAT10 nanoparticles for cancer immunotherapy.
A The diagram of PEI/PC7A and its size distribution. B Confocal image showing the uptake of PEI/PC7A. TC1 tumor cells were cultured in chamber slides overnight, and then added with 20 nM FAM-labeled siRNA for 4 h. Cells were stained with 50 nM Lyso-Tracker Red (Beyotime, catalog C1046) and 10 µg/mL Hoechst (Beyotime, catalog C1022) for 30 min. Immunofluorescence images were acquired using a Nikon A1 fluorescence microscope. C The mRNA expression levels of NAT10 were measured using RT-PCR in TC1 tumor cells with or without siRNA. 2×10⁵ TC1 tumor cells were seeded in 12-well plates overnight. The medium was then replaced with Opti-MEM, and PEI/PC7A was added with a final siRNA concentration of 20 nM (n = 3 biologically independent samples). The data are compared using the two-sided Student’s t test; **P = 0.006. D Protein expression levels of NAT10 were determined by Western blotting in TC1 (left panel) and MCA205 (right panel) tumor cells treated with or without PEI/PC7A/siNAT10 nanoparticles. E Tumor weight for C57BL/6 N mice (n = 5 mice per group) inoculated with TC1 tumor cells treated with Remodelin or PEI/PC7A/siNAT10 nanoparticles. TC1 tumor cells were inoculated subcutaneously into C57BL/6 N mice. Mice received Remodelin via oral gavage for the first 7 days at a dose of 100 mg/kg. PEI/PC7A containing siRNA (5 nmol/kg) was dissolved in PBS and injected into the tumor on days 4, 7, and 9. Tumor tissues were harvested after sacrificing the mice. Representative images are shown in the left panel. Statistical significance was determined using One-way ANOVA; from left to right, ** P = 0.0006; *P = 0.0183. F Tumor weight for C57BL/6 N mice (n = 5 mice per group) inoculated with TC1 tumor cells treated with PEI/PC7A/siRNA nanoparticles and/or anti-PD-1 antibodies. TC1 tumor cells were inoculated subcutaneously into C57BL/6 N mice. PEI/PC7A/siNAT10 nanoparticles or saline were injected into the tumor on days 4, 7, and 9. On day 8, mice were treated with IgG control or anti-PD-1 antibodies. Statistical significance was determined using One-way ANOVA; from left to right, *** P < 0.001; **P = 0.0092. G Representative immunofluorescence staining of CD8+ T cells in TC1 tumor tissues. Tumor tissues from C57BL/6 N mice (F) were subjected to immunostaining analysis for CD8+ T cells (red) and nucleus (blue). CD8+ T cells were quantified by counting positive signals in 3 randomly selected fields (20×) per tumor section using Image J. Statistical analysis was conducted using One-way ANOVA, Scale bar, 100 µm; n = 15 biologically independent samples. Statistical significance was determined using One-way ANOVA; from left to right, *** P < 0.001; ***P = 0.0007. H FACS analysis of the proportions of IFN-γ+CD8+ immune cells in TC1 tumor tissues. Tumor tissues from C57BL/6 N mice (F) were subjected to FACS analysis for IFN-γ+CD8+ immune cell populations (n = 5 mice per group). Statistical significance was determined using One-way ANOVA; from left to right, *** P = 0.0007; **P = 0.0046. I Diagram illustrating how tumor-intrinsic NAT10 orchestrates immune evasion and regulates antitumor immunity. Tumor-intrinsic NAT10 directly acetylated Myc mRNA, enhancing Myc transcription and subsequently promoting CDK2 expression, which in turn upregulates DNMT1 and drives cell proliferation. However, inhibition of NAT10 downregulates the MYC/CDK2/DNMT1 pathway, leading to increased formation of dsRNA and triggering RIG-I-mediated IFN-I response. This activation of the innate immune response enhances CD8+ T cell mediated antitumor immunity, offering a potential therapeutic avenue for boosting immune surveillance in cancer. Unless specified otherwise, the data are presented as means ± SEM (error bar). Source data are provided as a Source Data file.

References

    1. Salik, B., Smyth, M. J. & Nakamura, K. Targeting immune checkpoints in hematological malignancies. J. Hematol. Oncol.13, 111 (2020). - PMC - PubMed
    1. Zhu, S. et al. Combination strategies to maximize the benefits of cancer immunotherapy. J. Hematol. Oncol.14, 156 (2021). - PMC - PubMed
    1. de Miguel, M. & Calvo, E. Clinical challenges of immune checkpoint inhibitors. Cancer Cell38, 326–333 (2020). - PubMed
    1. Li, B., Chan, H. L. & Chen, P. Immune checkpoint inhibitors: Basics and challenges. Curr. Med Chem.26, 3009–3025 (2019). - PubMed
    1. Benci, J. L. et al. Tumor interferon signaling regulates a multigenic resistance program to immune checkpoint blockade. Cell167, 1540–1554.e12 (2016). - PMC - PubMed

MeSH terms