. 2025 Jun 3;16(1):5132.
doi: 10.1038/s41467-025-60187-5.

Forebrain neural progenitors effectively integrate into host brain circuits and improve neural function after ischemic stroke

Affiliations

Forebrain neural progenitors effectively integrate into host brain circuits and improve neural function after ischemic stroke

Xiao He et al. Nat Commun. .

Abstract

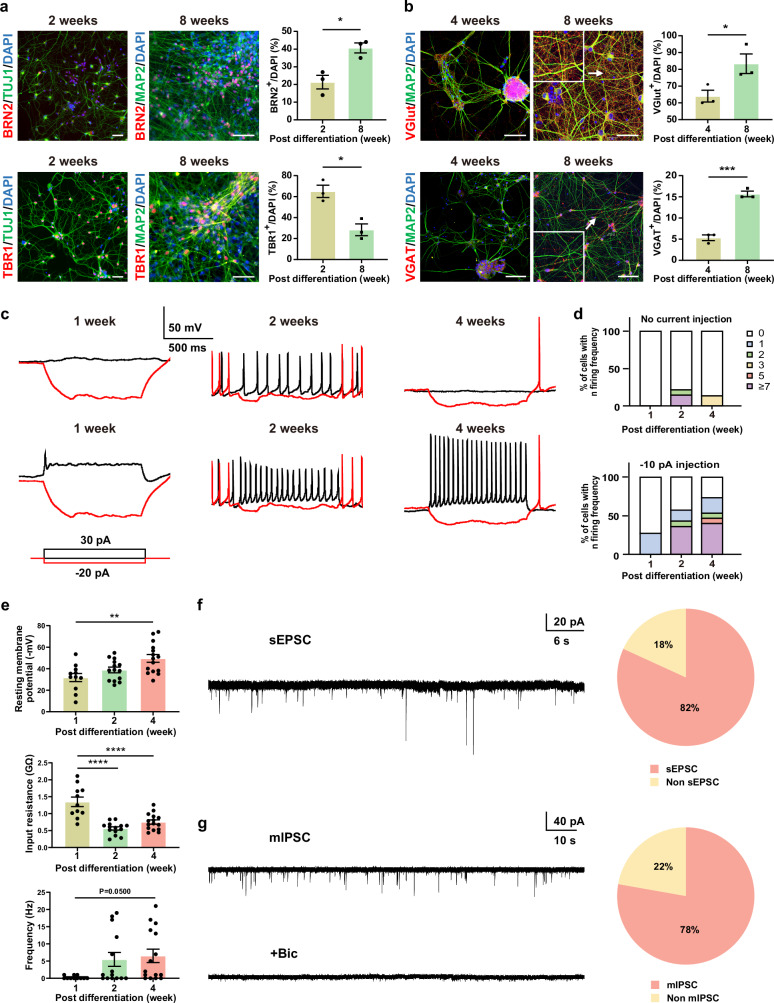
Human cortical neural progenitor cell transplantation holds significant potential in cortical stroke treatment by replacing lost cortical neurons and repairing damaged brain circuits. However, commonly utilized human cortical neural progenitors are limited in yield a substantial proportion of diverse cortical neurons and require an extended period to achieve functional maturation and synaptic integration, thereby potentially diminishing the optimal therapeutic benefits of cell transplantation for cortical stroke. Here, we generated forkhead box G1 (FOXG1)-positive forebrain progenitors from human inducible pluripotent stem cells, which can differentiate into diverse and balanced cortical neurons including upper- and deep-layer excitatory and inhibitory neurons, achieving early functional maturation simultaneously in vitro. Furthermore, these FOXG1 forebrain progenitor cells demonstrate robust cortical neuronal differentiation, rapid functional maturation and efficient synaptic integration after transplantation into the sensory cortex of stroke-injured adult rats. Notably, we have successfully utilized the non-invasive 18F-SynVesT-1 PET imaging technique to assess alterations in synapse count before and after transplantation therapy of FOXG1 progenitors in vivo. Moreover, the transplanted FOXG1 progenitors improve sensory and motor function recovery following stroke. These findings provide systematic and compelling evidence for the suitability of these FOXG1 progenitors for neuronal replacement in ischemic cortical stroke.


Conflict of interest statement

Competing interests: The authors declare the following competing interests: Jing Fan and Anxin Wang are named inventors on two Chinese patents (Application Nos. CN 202110505838.6 and CN 201810298488.9) related to the neural induction and differentiation methodology (optimized RONA method) described in this study. These patents are owned by Hopstem Bioengineering Co., Ltd. and were granted in 2025 and 2020, respectively. All remaining authors declare no competing interests related to this work.

Figures

Fig. 1
Fig. 1. Induction of forebrain NPCs from human iPSC based on an optimized neural differentiation strategy.
a Schematic summary of optimized neural differentiation approach and culture timeline. mTeSR, modified TeSR™ medium. Nog, noggin. SB, SB431542. EB, embryonic body. NIM, neural induction medium. NB, Neurobasal. RA, retinoic acid. E / I network, excitatory / inhibitory network. The time when human iPSC (hiPSC) clones are dissociated to form EBs is defined as Day 0 of the entire differentiation process. To facilitate comparison with the previous RONA method, the time of forebrain NPC formation (D28) is designated as the starting point (t = 0) for neural precursor differentiation into neurons. b Representative bright-field images of the same rosette neural aggregates captured on days 0, 1, 21, 22, and 30. Scale bar, 200 μm. The experiment was independently repeated 5 times with similar results. c–g Expression and quantification of neural stem cell marker SOX2 (c) and early forebrain regionalization markers FOXG1 (d), PAX6 (e), LHX2 (f), NKX2.1 (g) in the stage of NPCs formation. Colors are indicated in images. Scale bar, 50 μm. Data are means ± SEM (n = 3 samples). h Neuronal differentiation of forebrain NPCs produced by our differentiation strategy. DAPI (blue) was used to counterstain nuclei. Colors are indicated in the images. Scale bar, 50 μm. i Time-course immunostaining analysis of TUJ1+ cells in total cell population at weeks 1, 2, 4, and 8 of differentiation (n = 3 samples in each group). Data are means ± SEM. **P = 0.003, ***P < 0.001, one-way ANOVA followed by Tukey’s post hoc test. Source data are provided as a Source Data file.
Fig. 2
Fig. 2. Generation of balanced cortical subtypes and functional E-I networks.
a Expression and quantification of markers of superficial (BRN2) and deep (TBR1) cortical-layer neurons at 2 and 8 weeks of neuronal differentiation. Colors are indicated in images. Data are means ± SEM (n = 3 samples in each group). *P = 0.0156 for BRN2 and *P = 0.0107 for TBR1, two-tailed unpaired t-tests. Scale bar, 50 μm. b Expression and quantification of markers of excitatory (VGLUT) and inhibitory (VGAT) neurons at 4 and 8 weeks of neuronal differentiation. The zoomed-in view shows detailed fluorescence signal information. Colors are indicated in images. Data are means ± SEM (n = 3 samples in each group). *P = 0.047, ***P = 0.0004, two-tailed unpaired t-tests. Scale bar, 50 μm. c Action potential firing traces at 1, 2, and 4 weeks of neuronal differentiation without current injection and with −10 pA step current injection (down). d Quantification of percentage of cells with indicated firing frequencies at 1, 2, and 4 weeks of neuronal differentiation without current injection and with −10 pA step current injection (down). n = 11, 14, and 15 cells from three batches of independent cell cultures at 1, 2, and 4 weeks of neuronal differentiation. e Quantification of single-cell electrophysiological properties at 1, 2, and 4 weeks of neuronal differentiation. Solid dots denote individual cells. n = 11, 14, and 15 cells from three batches of independent cell cultures at 1, 2, and 4 weeks of neuronal differentiation. Data are means ± SEM. **P = 0.0022, ****P < 0.0001, one-way ANOVA followed by Tukey’s post hoc test. f Left: Representative traces of spontaneous excitatory current (sEPSC) in cultured human cortical neurons. Right: Summary pie chart of proportion of cells receiving sEPSCs (n = 11 cells from three samples) at 2 weeks of neuronal differentiation. g Left: Representative traces of miniature inhibitory postsynaptic current (mIPSC) in cultured human cortical neurons. By selectively blocking GABA receptors, bicuculine (10 μM) blocks mIPSCs, indicating inhibitory synaptic currents. Right: Summary pie chart of proportion of cells receiving mIPSCs (n = 9 cells from three samples) at 4 weeks of neuronal differentiation. Source data are provided as a Source Data file.
Fig. 3
Fig. 3. In vivo differentiation of grafted forebrain NPCs in focal photothrombotic model of stroke.
a Schematic timeline for experimental design. PT, photothrombotic. PET, positron emission tomography. MRI, magnetic resonance imaging. BLI, bioluminescence imaging. IEM, immunoelectron microscopy. EEG, electroencephalography. b Graph-based clustering of grafted cells from forebrain NPCs by snRNA-seq (n = 3 rats) at 11 weeks post-transplantation. c, d Five (c) and 7 (d) clusters showing detailed cell-type annotation utilizing singleR. RG, radial glia cell; DPC, diving progenitor cell; IPC, intermediate progenitor cell; EN, excitatory neuron; IN, inhibitory neuron. ULN, upper layer cortical neuron. DLN, deep layer cortical neuron. The pie chart showing the proportion of seven different cell types derived from forebrain NPCs (n = 3 rats) at 11 weeks post-transplantation. e UMAP plot showing selected marker gene expression of different cell types derived from grafted forebrain NPCs. f, g Representative images (f) and quantification (g) of NeuN-positive neurons derived from forebrain NPCs at 8 weeks after transplantation. Data are means ± SEM (n = 3 rats). Scale bar, 20 μm. h, i Pseudo-time trajectories of engrafted forebrain NPCs using diffusion map, colored by identified subpopulation. Diffusion map was constructed using Monocle2 (h) and Slingshot (i). Source data are provided as a Source Data file.
Fig. 4
Fig. 4. Functional maturation and synaptic integration of NPC-derived cortical neurons post-transplantation.
a Chemical formula for the synthetic radiotracer 18F-SynVest-1 and a schematic diagram of its microPET scan. b, c Representative cerebral 18F-SynVest-1 PET images (b) and semiquantitative analysis (c) of the SUVr in vehicle and NPC groups (n = 3 rats in vehicle group, n = 3 rats in NPC group; Data are means ± SEM. *P = 0.021, two-way ANOVA followed by Sidak’s post hoc test). Images are shown in coronal view. The white lines depict the midline of the rat brain, while the black circles denote the transplanted regions. TP, transplantation. SUVr = SUV (transplanted region) / SUV (brain stem region). d Gene Ontology (GO) analysis of NPC-derived cell subtypes after transplantation (See also Supplementary Data 2). e Engrafted GFP/gold nanoparticle-positive grafted human neurons (marked in black, dense particles with red arrows) with Golgi apparatus (red arrowheads) and mitochondria (red asterisk). The experiment was independently repeated 6 times in two rats, yielding similar results. Scale bar, 2 μm. f–h Engrafted GFP/gold nanoparticle-positive grafted human neurons (marked in black, dense particles with red arrows) established asymmetric (f) and symmetric (g) synaptic contacts with rat host neurons. Scale bar, 500 nm. h Summary pie chart of proportion of synaptic types (n = 251 synapses from two rats) at 6 weeks after transplantation. i–k Engrafted GFP/gold nanoparticle-positive grafted human neurons (marked in black, dense particles with red arrows) established afferent (i) and efferent (j) synaptic contacts with rat host neurons. Scale bar = 500 nm. k Summary pie chart of proportion of synaptic types (n = 251 synapses from two rats) at 6 weeks after transplantation. l Left: Representative trace of action potential firing pattern of NPC-derived cortical neurons elicited by 50 pA depolarizing current injection. Right: Summary pie chart of proportion of recorded NPC-derived cells firing action potentials (n = 27 cells from a total of 4 rats) at 7 weeks post-transplantation (2 rats) and 11 weeks post-transplantation (2 rats). m Left: Representative traces of spontaneous excitatory (sEPSC) or inhibitory postsynaptic current (sIPSC), which were blocked by glutamate receptor antagonist NBQX (AMPAR antagonist, 5 μM) or GABAA receptor antagonist bicuculine (10 μM), respectively. Right: Summary pie chart of proportion of cells displaying postsynaptic currents (n = 23 cells from a total of 4 rats) at 7 weeks post-transplantation (2 rats) and 11 weeks post-transplantation (2 rats). Source data are provided as a Source Data file.
Fig. 5
Fig. 5. Rabies-mediated tracing of synaptic inputs from host neurons to engrafted human neurons.
a The strategy for tracing direct synaptic inputs to human neurons transplanted into the stroke-injured cortex. Green: the transplanted region; gray: the infarcted region. b Fluorescence photomicrographs show the expression patterns of GFP, HuNu, and tdTomato in human or host neurons at the graft site. The white arrowheads indicate GFP+/tdTomato+ starter neurons, the white long arrows indicate GFP-/HuNu+/tdTomato+ rabies virus-traced human neurons, and the white short arrows indicate HuNu-/tdTomato+ rabies virus-traced host neurons. The experiment was independently repeated 3 times with similar results. Scale bar = 20 μm. c–e Traced host neurons in the ipsilateral cortex (c), contralateral cortex (d), and multiple subnuclei of ipsilateral thalamus (e). Edge of the thalamus subnuclei are highlighted with white dotted line. VL: ventrolateral; VM: ventromedial. VPL: Ventral posterolateral. The experiment was independently repeated 3 times with similar results. Scale bars = 100 μm.
Fig. 6
Fig. 6. Forebrain NPC transplanted in stroke-injured cortex exhibit cortical neuronal morphology and result in distant axonal projections across the brain.
a An overview of the relative positions of the infarct and the graft. Scale bar = 1 mm. b, c Representative fluorescent images of pyramidal-like cells (b) and bipolar cells (c) are shown with low (Scale bar = 50 um) and high (Scale bar = 20 um) magnification. The dashed rectangle at the bottom is shown at higher magnification above. The experiment was independently repeated 3 times with similar results. d Summary pie chart of proportion of grafted cells with different morphology at 8–10 weeks after transplantation (n = 3 rats). e Engrafted GFP/STEM121-positive grafted human neurons formed extensive axonal outgrowth in corpus callosum (CC), ipsilateral claustrum, bilateral frontal cortex (FrC), and bilateral internal capsule (IC). Green: the transplanted region; gray: the infarcted region. Scale bar, 100 μm. The experiment was independently repeated 3 times with similar results. f Axonal outgrowth of grafted human neurons, as measured by TAU and GFP co-localization. Scale bar, 50 μm. The experiment was independently repeated 3 times with similar results. Source data are provided as a Source Data file.
Fig. 7
Fig. 7. Therapeutic effects of transplanted forebrain NPCs on focal cerebral infarction.
a, b Representative MRI images of coronal brain slides (a) and quantitative analysis (b) of infarct volume in each group (n = 4 rats in vehicle group, n = 6 rats in NPC group; Data are means ± SEM. *P = 0.0277, two-way ANOVA followed by Sidak’s post hoc test). Coronal brain slides are arranged in sequence. The areas indicated by white arrow represent infarcted regions in ipsilateral hemisphere. TP, transplantation. c Sensorimotor function is measured by the percentage of touches made by the impaired limb compared to the ipsilateral and contralateral paw touches in the cylinder test. (n = 5 rats in sham group, n = 6 rats in NPC group, n = 7 rats in vehicle group; Data are means ± SEM. *P = 0.0233, two-way ANOVA followed by Tukey’s post hoc test). TP, transplantation. d Fine motor improvement, as determined by success rates (%) of single pellet reaching (SPR) (n = 5 rats in sham group, n = 6 rats in NPC group, n = 7 rats in vehicle group; Data are means ± SEM. *P = 0.0365, two-way ANOVA followed by Tukey’s post hoc test). TP, transplantation. e Typical EEGs and power spectrogram recorded from primary motor cortex (M1) adjacent to infarct in vehicle and NPC groups during post-stroke seizure. f Proportion of rats with EEG seizures and without EEG seizure in vehicle (n = 5 rats) and NPC transplantation (n = 8 rats) groups, respectively. g Representative PET images of rats with EEG seizures and without EEG seizure. White arrow points to M1 (primary motor cortex) area. h Comparison of 18F-FDG uptake in EEG recording area (M1 brain area) in rats with EEG seizures (n = 4 rats) and without EEG seizure (n = 13 rats, containing an additional 3 sham rats). Data are means ± SEM. ***P < 0.001, two-tailed unpaired t-tests. Source data are provided as a Source Data file.
Fig. 8
Fig. 8. Summary of the improved strategy for neural differentiation and transplantation therapy using forebrain NPC.
In this study, the ROCK inhibitor, Y-27632, was used to promote the survival of hiPSC as single cells in this study. Dual SMAD inhibition by noggin and SB431542 promoted the differentiation of embryonic bodies (EBs) towards forebrain fates. Rosette neural aggregates were collected and maintained as neurospheres in neural induction medium (NIM). Then, timed administration of retinoic acid promoted the generation of an appropriate proportion of excitatory and inhibitory neuronal populations. Meanwhile, the additions of SU5402, BIBF1120, and IBMX facilitated neurite outgrowth and maturation into truly functional neurons. At 2 weeks after NPC differentiation in vitro, the derived cortical neurons exhibited action potential firing properties. At 4 weeks after NPC differentiation in vitro, the derived cortical neurons exhibited excitatory-inhibitory postsynaptic current activity. At 7 to 11 weeks after transplantation of NPCs into the stroke-injured cortex, the differentiated progeny cortical neurons matured and established functional synaptic connections with host cells (a). Transplanted cells (colored in green) are located adjacent to the cortical ischemic lesion (colored in gray). Red cells: host neurons located in the ipsilateral thalamus, ipsilateral and contralateral cortex.TH: thalamus. For clarity and as an example, thalamo-cortical afferent projections to the graft and bidirectional interhemispheric projections between the graft and host cortical neurons are presented. Different techniques are distributed in the areas of the brain where they are applied: (b) snRNA-seq, (c) electron microscope, (d) electrophysiology, (e) virus tracing.

References

    1. Palma-Tortosa, S., Coll-San Martin, B., Kokaia, Z. & Tornero, D. Neuronal replacement in stem cell therapy for stroke: filling the gap. Front. Cell Dev. Biol.9, 662636 (2021). - PMC - PubMed
    1. Gladstone, D. J., Black, S. E. & Hakim, A. M. Toward wisdom from failure: lessons from neuroprotective stroke trials and new therapeutic directions. Stroke33, 2123–2136 (2002). - PubMed
    1. Stinear, C. M., Lang, C. E., Zeiler, S. & Byblow, W. D. Advances and challenges in stroke rehabilitation. Lancet Neurol.19, 348–360 (2020). - PubMed
    1. Palma-Tortosa, S. et al. Activity in grafted human iPS cell-derived cortical neurons integrated in stroke-injured rat brain regulates motor behavior. Proc. Natl Acad. Sci. USA117, 9094–9100 (2020). - PMC - PubMed
    1. Kokaia, Z., Martino, G., Schwartz, M. & OJNn, L. indvall Cross-talk between neural stem cells and immune cells: the key to better brain repair?. Nat. Neurosci.15, 1078–1087 (2012). - PubMed

MeSH terms

Substances

LinkOut - more resources