. 2025 Jul;44(13):3645-3668.
doi: 10.1038/s44318-025-00455-8. Epub 2025 Jun 3.

Epigenetic regulation of neural stem cell aging in the mouse hippocampus by Setd8 downregulation

Affiliations

Epigenetic regulation of neural stem cell aging in the mouse hippocampus by Setd8 downregulation

Shuzo Matsubara et al. EMBO J. 2025 Jul.

Abstract

Neural stem cells (NSCs) in the mammalian brain decline rapidly with age, leading to impairment of hippocampal memory function in later life. However, the relationship between epigenetic remodeling and transcriptional regulation that compromises hippocampal NSC activity during the early stage of chronological aging remains unclear. Here, we performed single-cell RNA sequencing (scRNA-seq) and single-cell ATAC sequencing (scATAC-seq) on NSCs and newly generated neurons across different stages. Integrated data analysis revealed continuous alterations in the chromatin profile of hippocampal NSCs and their progeny from neonatal to mature adult stages, accompanied by consistent changes in transcriptional profiles. Further, decreased expression of Setd8, encoding the enzyme for histone H4 monomethylation at lysine 20 (H4K20me1), underlies age-related changes in mouse hippocampal NSCs. Notably, depletion of Setd8 elicits alterations in gene expression and epigenetic regulation that phenocopy age-related changes, and impairs NSC activity, leading to hippocampal memory deficits. Together, our study provides a global map of longitudinal chromatin and transcriptome changes during brain aging and identifies mechanistic insights into early-onset decline of NSC activity and hippocampal neurogenesis that precedes functional aging.

Keywords: Aging; Epigenetics; Hippocampus; Neural Stem Cell.


Conflict of interest statement

Disclosure and competing interests statement. The authors declare no competing interests.

Figures
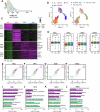
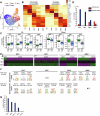
Figure 1
Figure 1. scRNA-seq analysis reveals continuous transcriptomic alterations in NSCs and progeny with age.
(A) Schematic timeline for investigating gene expression and chromatin changes in hippocampal NSCs with age by scRNA-seq and scATAC-seq. (B) Uniform Manifold Approximation and Projection (UMAP) plot showing the re-clustered 7471 cells including astrocytes or astrocyte precursor cells (AS), neural stem cells (NSC), neural progenitor cells (NPC), immature neurons 1 (IMN1), and immature neurons 2 (IMN2). (C) Heatmap showing the average expression of marker genes for each cell type at P5, 12w, and 24w. The brighter the magenta color, the higher the expression level. (D) Box plot of marker gene expression for indicated cell types at P5, 12w, and 24w. ∗p = 0.04162 by Wilcoxon rank-sum test. Box plots show the median (centre line), the 25th and 75th percentiles (bounds of box), and the minimum and maximum values (whiskers). n = 189 (NSC), 370 (NPC), 288(IMN1), 275 (IMN2). Exact p values from left to right: p  =  0.1696; p  =  0.1201; p  =  0.04162; p = 0.2363; p = 0.2511; p = 0.2782; p = 0.2286; p = 0.2371. (EH) Scatter plots showing fold change of gene expression in each cell cluster between P5 and 12w (x axis) and between P5 and 24w (y axis). Dots in any color other than gray are DEGs (q-value < 0.05 by Seurat package with MAST and fold change ≥ 2) that differed at 12w or 24w compared to P5. Genes with increased and decreased expression in common at 12w and 24w compared to P5 are shown in purple and bright green, and defined as upregulated DEGs and down-regulated DEGs, respectively. (IL) Functional annotation of upregulated DEGs (purple) and down-regulated DEGs (green) in common at 12w and 24w compared to P5 in (E). The top three GO terms in each gene group are displayed.
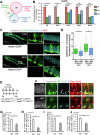
Figure 2
Figure 2. Altered chromatin accessibility during aging is associated with gene expression changes.
(A) UMAP plot showing the re-clustered 7103 cells including AS, NSC, NPC, IMN1, and IMN2 identified by scATAC-seq. (B) Heatmap showing chromatin accessibility around the indicated genes (left) and corresponding gene expression levels (right) for each cluster. (C) Box plots showing the chromatin accessibility (gene activity score) around up- and downregulated DEG loci indicated in Fig. 1 (E–H) (≥1.25-fold, up in NSC cluster (n = 244), up in NPC cluster (n = 184), up in IMN1 cluster (n = 159), up in IMN2 cluster (n = 129), down in NSC cluster (n = 184), down in NPC cluster (n = 84), down in IMN1 cluster (n = 19), down in IMN2 cluster (n = 26)). To calculate the gene activity score, the gene coordinates were extracted and extended to include the upstream 2-kb region. *p < 0.05 by Wilcoxon rank-sum test compared with averaged gene expression at P5. n.s., not significant. Box plots show the median (centre line), the 25th and 75th percentiles (bounds of box), and the minimum and maximum values (whiskers). Exact p values from left to right: p  =  0.0102; p  =  0.01198; p  =  0.145; p = 0.001434; p = 0.811; p = 0.0452; p = 0.8263; p = 0.0412; p = 0.03337; p = 0.0163; p = 0.1788; p = 0.03739; p = 0.2139; p = 0.0482; p = 0.2135; p = 0.03121. (D) Bar graph showing chromatin accessibility in the number of gained-open or gained-closed DARs called by MACS (p < 0.05 by Wilcoxon rank-sum test and fold change ≥1.5). The number of accessible or inaccessible regions in common at 12w and 24w compared to P5 is shown. (E) Heatmaps showing the chromatin accessibility of the regions indicated in (D). (F) Enriched motifs for gained-open and -closed DARs. The top three enriched motifs in each group are displayed. (G) Bar graph showing the significant enrichment of motifs associated with NSC activity in the gained-closed DAR of NSCs with age.
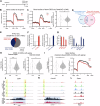
Figure 3
Figure 3. Setd8 maintains NSC activity and neurogenesis in the DG.
(A) Venn diagram showing overlap between epigenetic regulators and up- or downregulated DEGs in NSCs. (B) Bar graphs showing fold change of Setd8 expression in each cluster compared to P5. *q < 0.01 by FindMarker in Seurat package with MAST compared with P5. n.s., not significant. Exact p values from left to right: p = 2.6618 × 105; p = 0.0033; p = 2.2097 × 105; p = 0.00019; p = 1.5876 × 105; p = 0.6469; p = 1.1316 × 106; p = 0.5275; p = 5.6776 × 10¹¹; p = 0.0524. (C) Representative images of staining for EGFP (green), H4K20me1 (cyan), Ki67(red), and Hoechst (gray; insets) in the hippocampal DG of Nestin-EGFP mice. The areas outlined by a white rectangle are enlarged to the right. Arrows and arrowheads indicate Ki67+ activated and Ki67− quiescent NSCs, respectively. Scale bars, 100 µm (left) and 20 µm (right). (D) Box plots showing H4K20me1 fluorescence intensity normalized by background in NSCs. Quiescent and active NSCs of the hippocampus in 24w mice displayed reduced signal intensity for H4K20me1 compared to the respective states of NSCs in 12w mice (n = 76 cells from three mice per group). *p < 0.001 by Wilcoxon rank-sum test. Box plots show the median (centre line), the 25th and 75th percentiles (bounds of box), and the minimum and maximum values (whiskers). Exact p values from left to right: p = 0.0002829; p  =  0.0007525. (E) Experimental scheme for investigating Setd8 function in adult hippocampal NSCs using Ctrl (NestinCreERT2/+; Setd8wt/wt; R26yfp/yfp) and Setd8 cKO mice (NestinCreERT2/+; Setd8flox/flox; R26yfp/yfp). (F) Representative images of staining for YFP (green), Ki67 (cyan), Gfap (red), Sox2 (red), and Hoechst (gray) of the hippocampus in Ctrl and Setd8 cKO mice. White arrowheads, magenta arrowheads, and white arrows indicate quiescent NSCs, activated NSCs, and NPCs, respectively. Scale bars, 20 µm. (G, H) Quantification of the number of YFP+ Gfap/Sox2 + Ki67− quiescent NSCs (G) and YFP+ Gfap/Sox2 + Ki67+ active NSCs (H) in Ctrl and Setd8 cKO (n = 4 animals per group). *p = 0.036522487 (G) and 0.016106224 (H) by Student’s t test. (I) The proportion of YFP+ Gfap+ Sox2 + Ki67+ activated NSCs among YFP+ Gfap+ Sox2+ total NSCs in Ctrl and cKO (n = 4 animals per group). *p = 0.04574894 by Student’s t test. (J) Quantification of the number of NPCs expressing YFP, Ki67, and Sox2 without Gfap+ radials in Ctrl and cKO (n = 4 animals per group). *p = 0.026683966 by Student’s t test. Source data are available online for this figure.
Figure 4
Figure 4. Reduction of Setd8 expression causes premature depletion of NSCs and memory impairment.
(A) Experimental scheme for assessing the effect of Setd8 expression decrease on NSCs and neurogenesis in the DG at young adult age (10w). (BD) Representative images of staining for YFP (green), Ki67 (cyan), Gfap (red), Sox2 (red), and Hoechst (gray; insets) of the DGs in Ctrl (B) (n = 4 animals), Setd8 het-cKO (C) (n = 4 animals), and Setd8 cKO (D) (n = 4 animals). Arrowheads indicate YFP-labeled NSCs. Lower panels show higher magnification of upper panel. Scale bars, 100 µm (upper) and 20 µm (lower). (E, F) Quantification of the number of YFP+ Gfap/Sox2 + Ki67− quiescent (E) and YFP+ Gfap/Sox2 + Ki67+ activated (F) NSCs in Ctrl, het-cKO, and cKO (n = 4 animals per group). *p < 0.05 and **p < 0.01 by ANOVA with Tukey post hoc tests. Statistical data are presented as mean ± SEM. Exact p values from left to right: p  =  0.0489931 (E); p  =  0.0012056 (E); p = 0.0001080 (E); p = 0.0030571 (F); p = 0.00658989 (F); p = 0.0001245 (F). (G) Proportion of YFP+ Gfap+ Sox2 + Ki67+ activated NSCs among YFP+ Gfap+ Sox2+ total NSCs in Ctrl, het-cKO, and cKO (n = 4 animals per group). *p < 0.01 by ANOVA with Tukey post hoc tests. Statistical data are presented as mean ± SEM. Exact p values from left to right: p  =  0.0083019; p  =  0.7975168; p = 0.0032564. (H) Schematic diagram of the NPRT. (I) Exploration ratio for time spent in exploring the object during sampling phase (left) and the relocated object during the test phase (right) in Ctrl, het-cKO, and cKO. het-cKO and cKO mice lacked a preference for the relocated object. *p < 0.05 by Student’s t test. n.s., not significant. n = 14 (Ctrl), 18 (het-cKO) and 13 (cKO). Statistical data are presented as mean ± SEM. Exact p-values from left to right are as follows: for sampling, p = 0.3243, p = 0.2591, and p = 0.2734; for testing, p = 0.0303, p = 0.3020, and p = 0.1761. Source data are available online for this figure.
Figure 5
Figure 5. Molecular signature of NSC aging is established by Setd8 downregulation.
(A) Experimental scheme for investigating transcriptomic alteration in NSCs in vitro by RNA-seq (n = 3). (B) Scatter plot of genes expressed in NSCs from Ctrl and Setd8-KD mice. Upregulated (red) and downregulated (blue) DEGs in Setd8-KD (q value < 0.05 by DESeq2 package, fold change ≥ 1.5) are highlighted. (C, D) The top 10 GO terms in significantly up- (n = 995) (C) or downregulated (n = 1049) (D) DEGs in Setd8-KD cells. (E, F) GSEA showing the significant enrichment of up- (E) or downregulated (F) DEGs of in vivo NSCs with age (identified in Fig. 1E) in Setd8-KD cells or Ctrl cells, respectively. (G) Enrichment analysis of up- (red) or downregulated (blue) DEGs of NSCs with age in vivo, identified in Fig. 1E, on Setd8-KD-induced up- or downregulated genes. The leftmost bar represents the expected overlap based on a random gene set, while the remaining bars show the fold enrichment of actual overlaps. *p < 0.01 by hypergeometric distribution. Exact p values from left to right: p = 2.52 × 10⁻¹⁸; p = 3.48 × 10⁻¹5; p = 2.59 × 10⁻10. (H) Enrichment analysis of NSC quiescence- (red) or activation-associated (blue) genes, reported by Shin et al, , on Setd8-KD-induced up- or downregulated genes. The leftmost bar represents the expected overlap based on a random gene set, while the remaining bars show the fold enrichment of actual overlaps. *p < 0.001 by hypergeometric distribution. Exact p values from left to right: p = 3.31 × 10⁻¹⁸; p = 1.17 × 10⁻91. (IN) Bar graphs showing expression levels of the indicated genes in Ctrl (white) and KD (gray) NSCs. *q < 0.01 by DESeq2 package. n = 3 samples. Statistical data are presented as mean ± SEM. (O) GSEA results showing significant enrichment of the senescence-associated gene set, as reported by Saul et al, , in Ctrl (white) and KD (gray) NSCs after long-term suppression of Setd8, observed 7 days post-infection. (P) Expression level of interferon signaling-related genes in Ctrl (white) and KD (gray) NSCs after long-term suppression of Setd8, observed 7 days post-infection. *q < 0.01 by DESeq2 package. n = 3 samples. Statistical data are presented as mean ± SEM. Exact p values from left to right: q  =  0.0167630229897316; q  =  0.0167; q  =  1.43528482781079 × 10⁻¹¹; q = 3.495 × 10⁻⁵¹.
Figure 6
Figure 6. Downregulation of Setd8 induces aging-related epigenomic alteration.
(A) Experimental scheme for investigating epigenetic alteration in NSCs in vitro by ChIP-seq for H4K20me1 (n = 2) and ATAC-seq (n = 2). (B) Enrichment profile of H4K20me1 in gene body of all genes in Ctrl (black) and KD (red) NSCs. (C) Enrichment profile (left) and violin plot (right) of H4K20me1 around gene bodies of downregulated DEGs (n = 1049 genes) by Setd8-KD in Ctrl (black) and KD (red) (left) NSCs. *p = 2.371 × 10⁻6 by Wilcoxon rank-sum test. Box plots show the median (centre line), the 25th and 75th percentiles (bounds of box), and the minimum and maximum values (whiskers). (D) Venn diagram showing significant overlap between the downregulated DEGs by Setd8-KD and genes with decreased H4K20me1 in the gene body (Fisher’s test). (E) Pie chart showing the percentage of accessible and inaccessible regions of Setd8-KD NSCs. (F) Enrichment analysis of genes associated with gained-open or -closed DARs within 10 kb up- or downstream of a TSS, on Setd8 KD-induced up- (left) or downregulated genes (right). *p < 0.001 and **p < 0.0001 by hypergeometric distribution. (G) Bar graphs showing the significant enrichment of motifs associated with NSCs and NPC activity in the gained-open (left) and -closed DARs (right) in Setd8-KD NSCs. *p < 0.01 by hypergeometric distribution. (H) Violin plots showing chromatin accessibility of gained-open (left) or -closed DARs (right) of in vivo NSCs with age between Ctrl and Setd8-KD cells. *p < 0.001 by Wilcoxon rank-sum test. n.s., not significant. Violin plots show the median (centre line), the 25th and 75th percentiles (bounds of box), and the minimum and maximum values (whiskers). n = 751 (gained-open) and 7488 (gained-closed). Gained-open: p = 0.3082; Gained-closed: p = 8.61 × 10⁻10. (I) Violin plot (left) and enrichment profile (right) at gained-closed DARs of in vivo NSCs with age for H4K20me1 in Ctrl and Setd8-KD cells. *p = 8.34 × 10⁻5 by Wilcoxon rank-sum test. Box plots show the median (centre line), the 25th and 75th percentiles (bounds of box), and the minimum and maximum values (whiskers). n = 7488 (gained-closed). (JL) Alignment data for scATAC-seq in NSCs in vivo (P5, 12w, and 24w), ATAC-seq in NSCs in vitro (Setd8-KD and Ctrl), and ChIP-seq to H4K20me1 in NSCs in vitro (Setd8-KD and Ctrl) at the Cdk1, Lmnb1, and Apoe loci. The regions identified by peak-calling are highlighted in yellow, and the gene bodies are highlighted in light blue.

Similar articles

References

    1. Aimone JB, Li Y, Lee SW, Clemenson GD, Deng W, Gage FH (2014) Regulation and function of adult neurogenesis: from genes to cognition. Physiol Rev 94:991–1026 - PMC - PubMed
    1. Andersen J, Urbán N, Achimastou A, Ito A, Simic M, Ullom K, Martynoga B, Lebel M, Göritz C, Frisén J et al (2014) A transcriptional mechanism integrating inputs from extracellular signals to activate hippocampal stem cells. Neuron 83:1085–1097 - PMC - PubMed
    1. Artegiani B, Lyubimova A, Muraro M, van Es JH, van Oudenaarden A, Clevers H (2017) A single-cell RNA sequencing study reveals cellular and molecular dynamics of the hippocampal neurogenic niche. Cell Rep 21:3271–3284 - PubMed
    1. Beck DB, Oda H, Shen SS, Reinberg D (2012) PR-Set7 and H4K20me1: at the crossroads of genome integrity, cell cycle, chromosome condensation, and transcription. Genes Dev 26:325–337 - PMC - PubMed
    1. Bedrosian TA, Houtman J, Eguiguren JS, Ghassemzadeh S, Rund N, Novaresi NM, Hu L, Parylak SL, Denli AM, Randolph‐Moore L et al (2021) Lamin B1 decline underlies age‐related loss of adult hippocampal neurogenesis. EMBO J 40:1–21 - PMC - PubMed

Substances

LinkOut - more resources