

Enhanced nuclear information fusion and visual transformer for pathological breast cancer image classification
- PMID: 40461688
- PMCID: PMC12134255
- DOI: 10.1038/s41598-025-04344-2
Enhanced nuclear information fusion and visual transformer for pathological breast cancer image classification
Abstract
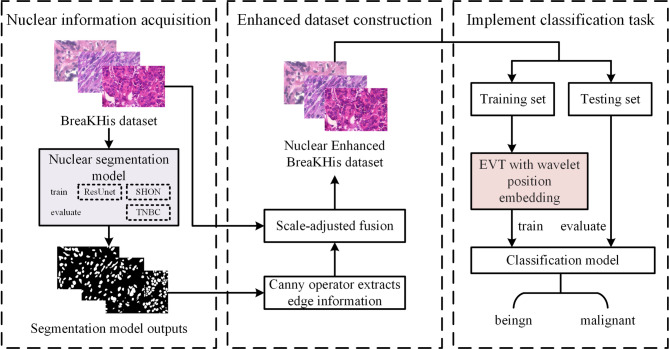
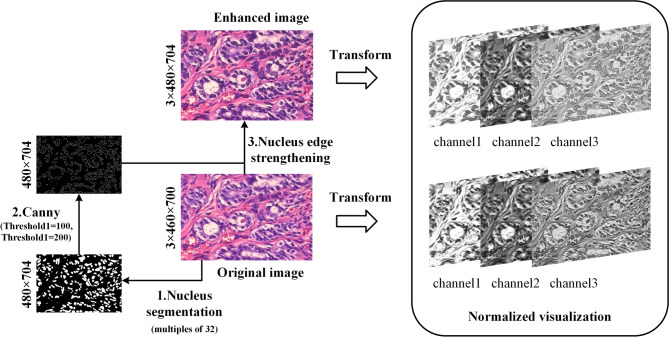
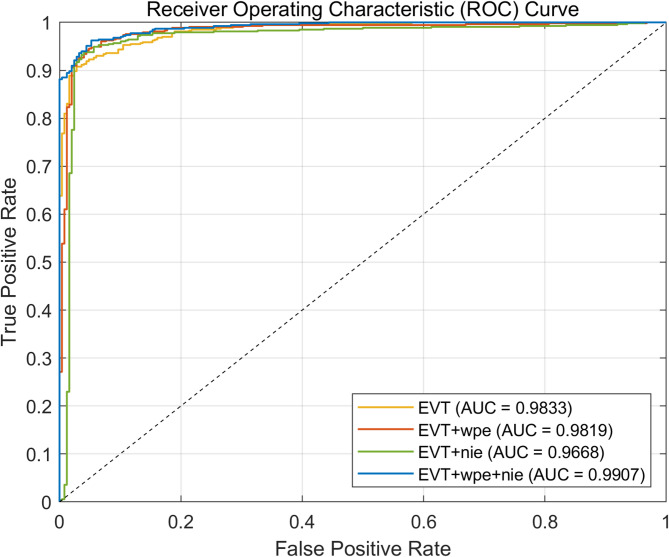
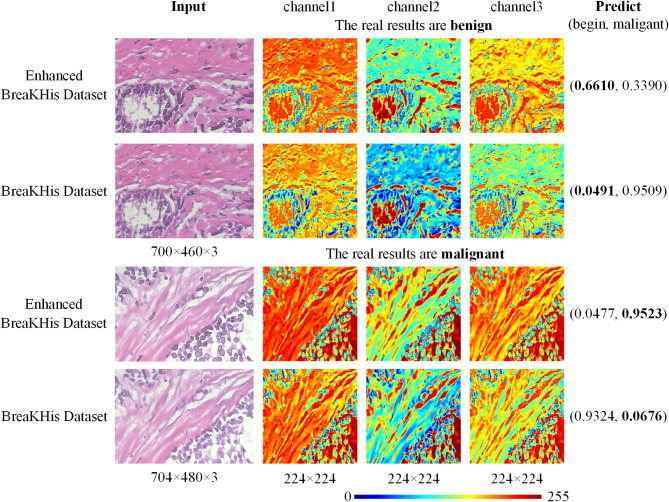
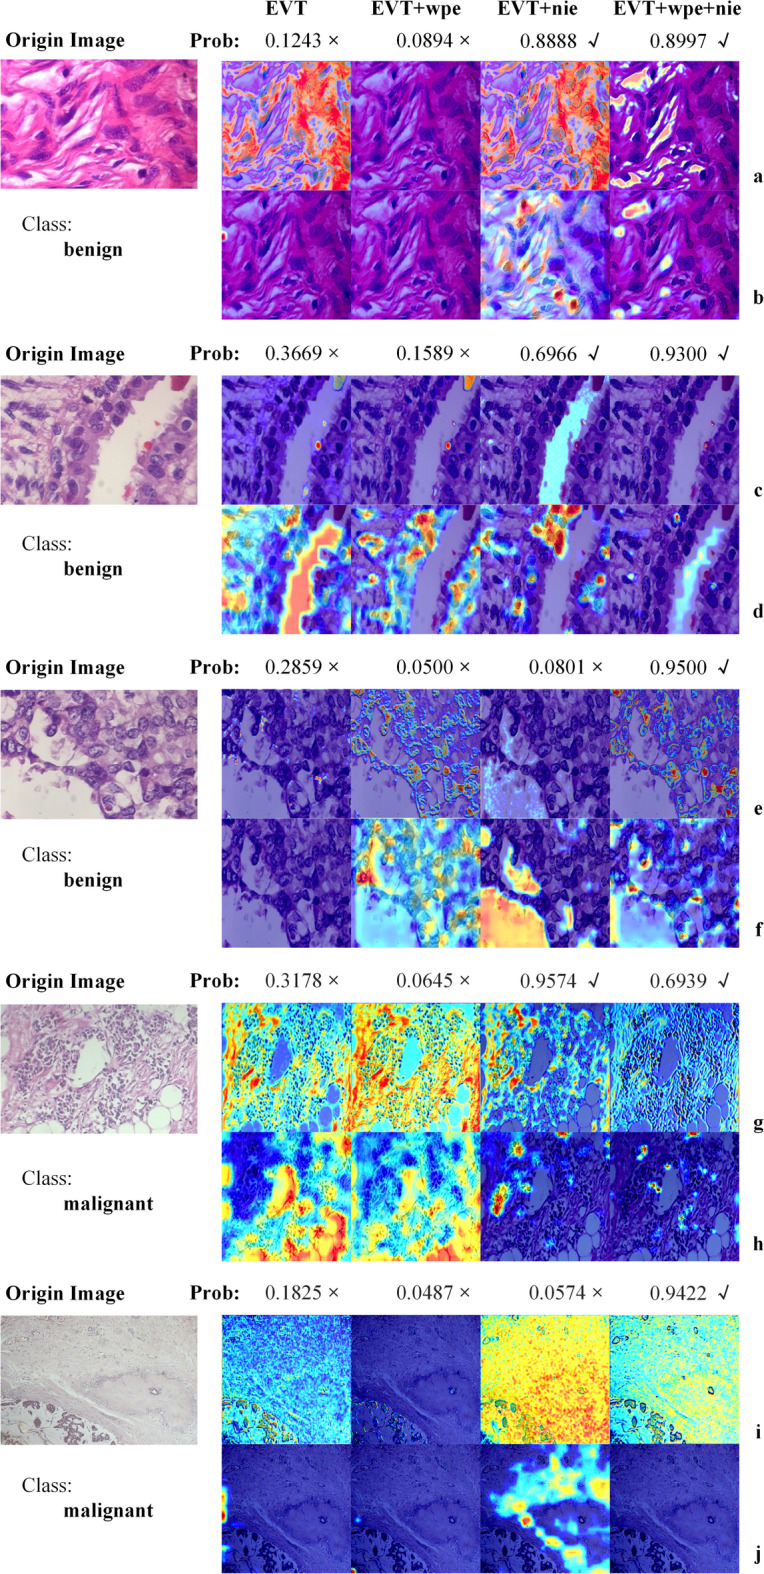
Breast cancer poses a significant threat to women's health. Early diagnosis using pathological images is crucial for effective treatment planning. However, the low resolution of pathological images poses significant challenges for the extraction of valid information, while their high complexity greatly increases the difficulty of image analysis. To address these challenges, this paper introduces an innovative classification method for breast cancer histopathological images, combining enhanced nuclear information with an Enhanced Vision Transformer (EVT) model using wavelet position embedding. The quintessence of the proposed method resides in its capacity to efficiently extract both biological and foundational image features from pathological images. This is accomplished by initially enhancing nuclear information through the application of segmentation models and sophisticated image processing techniques. Subsequently, wavelet positional embedding within the EVT model is leveraged to precisely capture key information embedded within the images. Experimental outcomes have demonstrated that our method attains an accuracy rate of 94.61% and an AUC value of 99.07% on the BreaKHis dataset, significantly outperforming other baseline network models in terms of classification efficacy. Furthermore, through visual representation, this study underscores the significance of nuclear information enhancement and wavelet position transformation in the EVT model, thereby further confirming the effectiveness and effectiveness of the method we proposed.
Keywords: Classification; Enhanced nuclear information fusion; Pathological breast cancer image; Segmentation; Visual transformer.
© 2025. The Author(s).
Conflict of interest statement
Declarations. Competing interests: The authors declare no competing interests.
Figures


References
-
- Sung, H., Ferlay, J. & Siegel, R. L., et al. Global cancer statistics 2020: GLOBOCAN estimates of incidence and mortality worldwide for 36 cancers in 185 countries. CA71(3), 209–249 (2021). - PubMed
-
- Kaul, V., Enslin, S. & Gross, S. A. History of artificial intelligence in medicine. Gastrointest. Endosc.92(4), 807–812 (2020). - PubMed
-
- LeCun, Y., Bengio, Y. & Hinton, G. Deep learning. Nature521(7553), 436–444 (2015). - PubMed
MeSH terms
Grants and funding
LinkOut - more resources
Full Text Sources
Medical
