. 2025 Jun 3;15(1):19427.
doi: 10.1038/s41598-025-04343-3.

Lipidomic signatures linked to gut microbiota alterations in children and adolescents with type 2 diabetes mellitus and metabolic syndrome

Affiliations

Lipidomic signatures linked to gut microbiota alterations in children and adolescents with type 2 diabetes mellitus and metabolic syndrome

Shirley Mora-Godínez et al. Sci Rep. .

Abstract

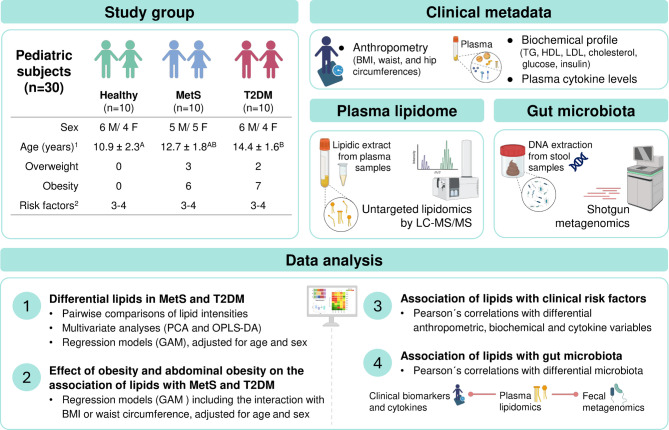
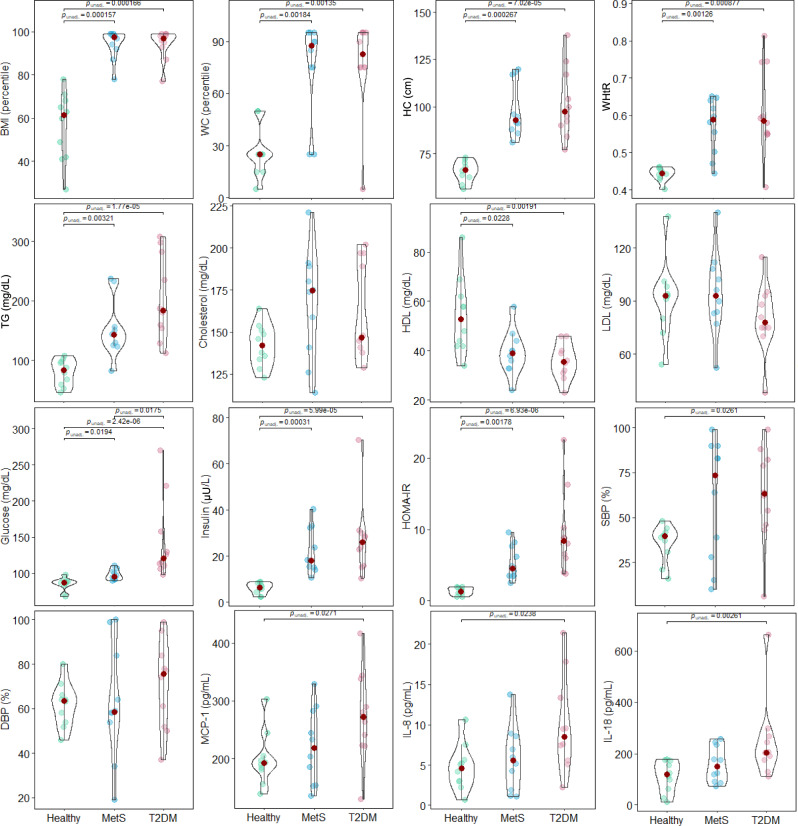
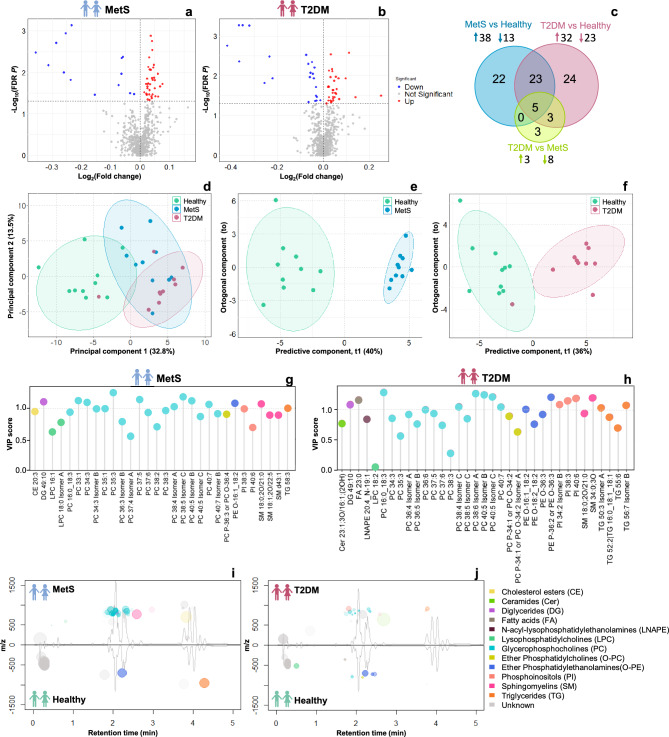
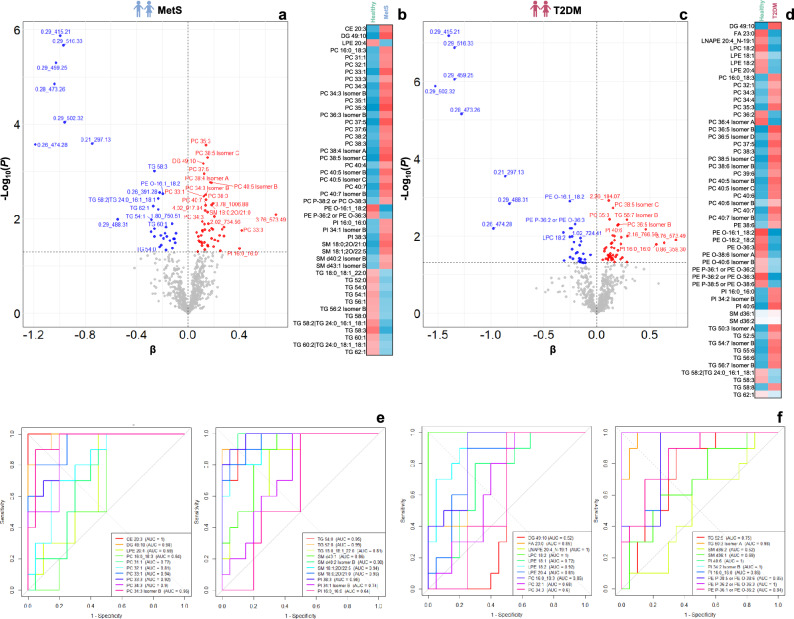
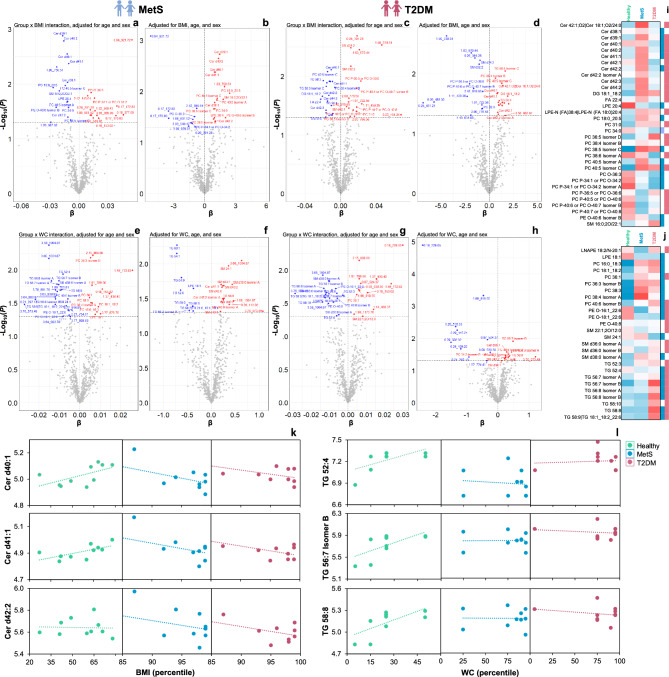
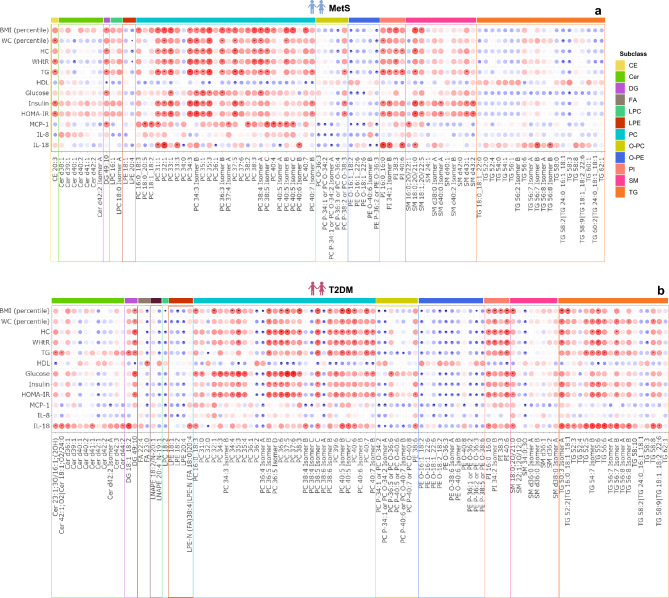
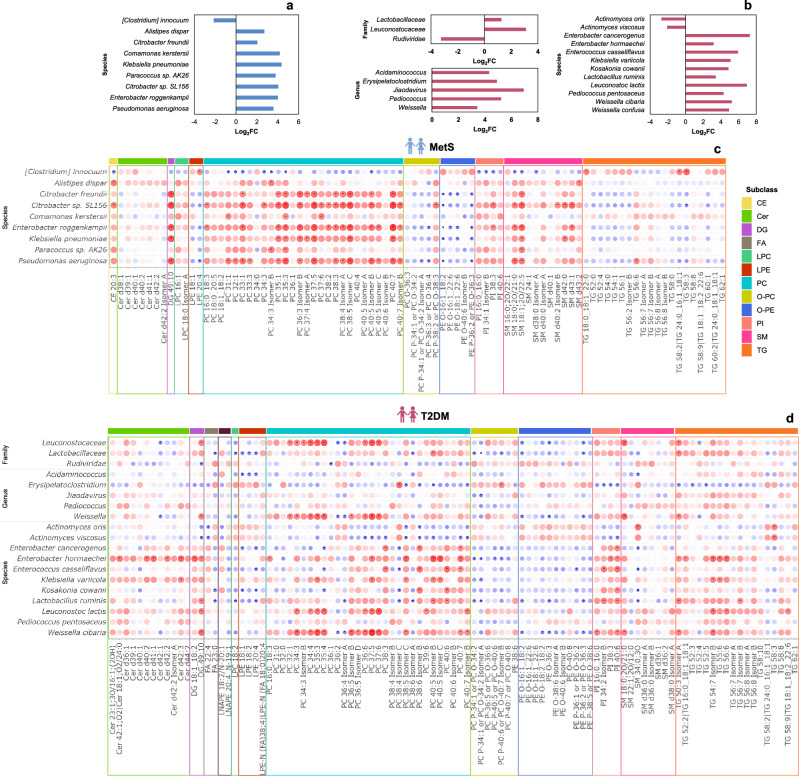
Youth-onset type 2 diabetes mellitus (T2DM) has an aggressive clinical course and is usually preceded by obesity and metabolic syndrome (MetS). Lipids have emerged as potential biomarkers for studying metabolic risk factors and predicting disease progression. An untargeted lipidomic analysis by liquid chromatography-mass spectrometry was performed in thirty pediatric subjects with T2DM and MetS and a healthy group. Plasma lipids were associated with obesity, metabolic risk factors, inflammatory biomarkers, and gut microbiota. A total of 375 lipid species were annotated. MetS and T2DM groups had increased levels of phosphocholines (15-18), phosphoinositols (2-3), sphingomyelins (2-3), and triglycerides (1-4), and lower plasmalogens (2-6) and lysophospholipids (1-2). Phosphocholines, phosphoinositols, sphingomyelins, and triglycerides positively correlated with metabolic risk factors such as body mass index (BMI), waist and hip circumference, triglycerides, glucose, insulin, and HOMA-IR. Ceramides were significantly higher in MetS and T2DM in regression analysis, adjusted for BMI, age, and sex, and only increased with higher BMI in the healthy group. Significant positive correlations were observed for phosphocholines and phosphoinositols with species from the phyla Pseudomonadota and Bacillota, like Weissella cibaria and Enterobacter hormaechei, and the latter species with ceramides. This study provides novel evidence on the role of plasma lipids in the pathophysiology of MetS and T2DM in children and adolescents and their associations with gut microbial species. These findings documented opportunities for developing therapeutic strategies, such as dietary interventions and microbiome modulation, to mitigate the burden of metabolic diseases in pediatric populations.

Keywords: Children; Gut microbiota; Lipidomics; Metabolic syndrome; Type 2 diabetes mellitus.


Conflict of interest statement

Declarations. Competing interests: The authors declare no competing interests.

Figures

Fig. 1
Fig. 1
Study design of plasma lipidomics and its association with clinical risk factors and fecal microbiota in children with metabolic syndrome (MetS) and type 2 diabetes mellitus (T2DM) compared to a healthy group. 1Different letters indicate significant differences between groups (Dunn´s test). 2Cook et al. criteria.
Fig. 2
Fig. 2
Violin plots of anthropometric, biochemical, and cytokine biomarkers of the study groups; metabolic syndrome (MetS), type 2 diabetes mellitus (T2DM), and a healthy group (Dunn´s test, P < 0.05, n = 30). BMI = Body mass index, WC = Waist circumference, HC = Hip circumference, WHtR = Waist-to-height ratio, TG = Triglycerides, HDL = High-density lipoprotein, LDL = Low-density lipoprotein, HOMA-IR = Homeostatic model assessment of insulin resistance, SBP = Systolic blood pressure, DBP = Diastolic blood pressure.
Fig. 3
Fig. 3
Differential lipids in children with metabolic syndrome (MetS) and type 2 diabetes mellitus (T2DM), compared to the healthy group. (a-b) Volcano plots showing feature significance and change magnitude of pairwise comparisons (a) MetS vs. healthy, and (b) T2DM vs. healthy. The horizontal dashed line indicates the significance threshold (Wilcoxon rank-sum test, FDR P < 0.05). (c) Venn diagram of differential features. (d) PCA. (ef) OPLS-DA score plots for (e) MetS vs. healthy (R2 = 0.949, Q2 = 0.841), and (f) T2DM vs. healthy (R2 = 0.803, Q2 = 0.548). All multivariate analyses were conducted using only significant features. (g-h) Variable importance in projection (VIP). (i-j) Cloud plots of significant lipidic features. Dots in negative m/z indicate features with lower intensities in MetS or T2DM than in healthy controls. Dot size and transparency represent the magnitude of change and significance, respectively.
Fig. 4
Fig. 4
Regression analysis of metabolic syndrome (MetS) and type 2 diabetes mellitus (T2DM), compared to the healthy group, adjusting for age and sex. (a and c) Volcano plots showing feature significance and β value. The horizontal dashed line indicates the significance threshold (P < 0.05). (b and d) Heatmap of the z-score for each lipid. (e and f) Receiver Operating Characteristic (ROC) curves of representative significant metabolites from regression models for MetS and T2DM, respectively. The Area Under the Curve (AUC) value is shown in the legend for each metabolite.
Fig. 5
Fig. 5
Effect of obesity and abdominal obesity on the association of plasma lipids of children with metabolic syndrome (MetS) and type 2 diabetes mellitus (T2DM) in reference to the healthy group. (a-d) Regression analysis (a and c) including the group and body mass index (BMI) interaction, and (b and d) group adjusted for BMI. (eh) Regression analysis (e and g) including the group and waist circumference (WC) interaction, and (f and h) group adjusted for WC. All models were adjusted for age and sex. Volcano plots show feature significance and β value. The horizontal dashed line indicates the significance threshold (P < 0.05). (i) Heatmap of the z-score for each lipid that resulted significant for group and BMI interaction. (j) Heatmap of the z-score of each lipid that resulted significant for group and WC interaction. Bars in heatmaps indicate significant lipids in MetS (blue) and T2DM (dark pink). (k-l) Scatter plots of representative significant lipids for group and BMI/WC interaction.
Fig. 6
Fig. 6
Lipid association with clinical risk factors and cytokines. (a-b) Pearson´s correlation coefficient in (a) MetS and (b) T2DM. Healthy subjects were included in both correlation analyses. Dot size and color intensity represent the coefficient (red = positive, blue = negative) and significance of the correlation, respectively. Asterisks indicate significant correlations (P < 0.05).
Fig. 7
Fig. 7
Lipid association with fecal microbiota. (a-b) Change magnitude of microorganisms at family, genus, and species levels in the comparisons (a) MetS vs. healthy, and (b) T2DM vs. healthy. (c-d) Pearson´s correlation coefficient in (c) MetS and (d) T2DM. Healthy subjects were included in both correlation analyses. Dot size and color intensity represent the coefficient (red = positive, blue = negative) and significance of the correlation, respectively. Asterisks indicate significant correlations (P < 0.05).

Similar articles

References

    1. Huang, Y. et al. Lipid profiling identifies modifiable signatures of cardiometabolic risk in children and adolescents with obesity. Nat. Med.1, 294–305 (2024). - PMC - PubMed
    1. Vajravelu, M. E., Tas, E. & Arslanian, S. Pediatric Obesity: Complications and current day management. Life13, 1591 (2023). - PMC - PubMed
    1. World Health Organization. Obesity and overweight. https://www.who.int/news-room/fact-sheets/detail/obesity-and-overweight (2024).
    1. Rubino, F. et al. Definition and diagnostic criteria of clinical obesity. Lancet Diabetes Endocrinol.10.1016/S2213-8587(24)00316-4 (2025). - PMC - PubMed
    1. Barata Cavalcanti, O. et al. World Obesity Atlas 2022. (2022).

LinkOut - more resources