. 2025 Jul;5(7):1266-1279.
doi: 10.1038/s43587-025-00877-3. Epub 2025 Jun 3.

The secretome of senescent monocytes predicts age-related clinical outcomes in humans

Affiliations

The secretome of senescent monocytes predicts age-related clinical outcomes in humans

Bradley Olinger et al. Nat Aging. 2025 Jul.

Abstract

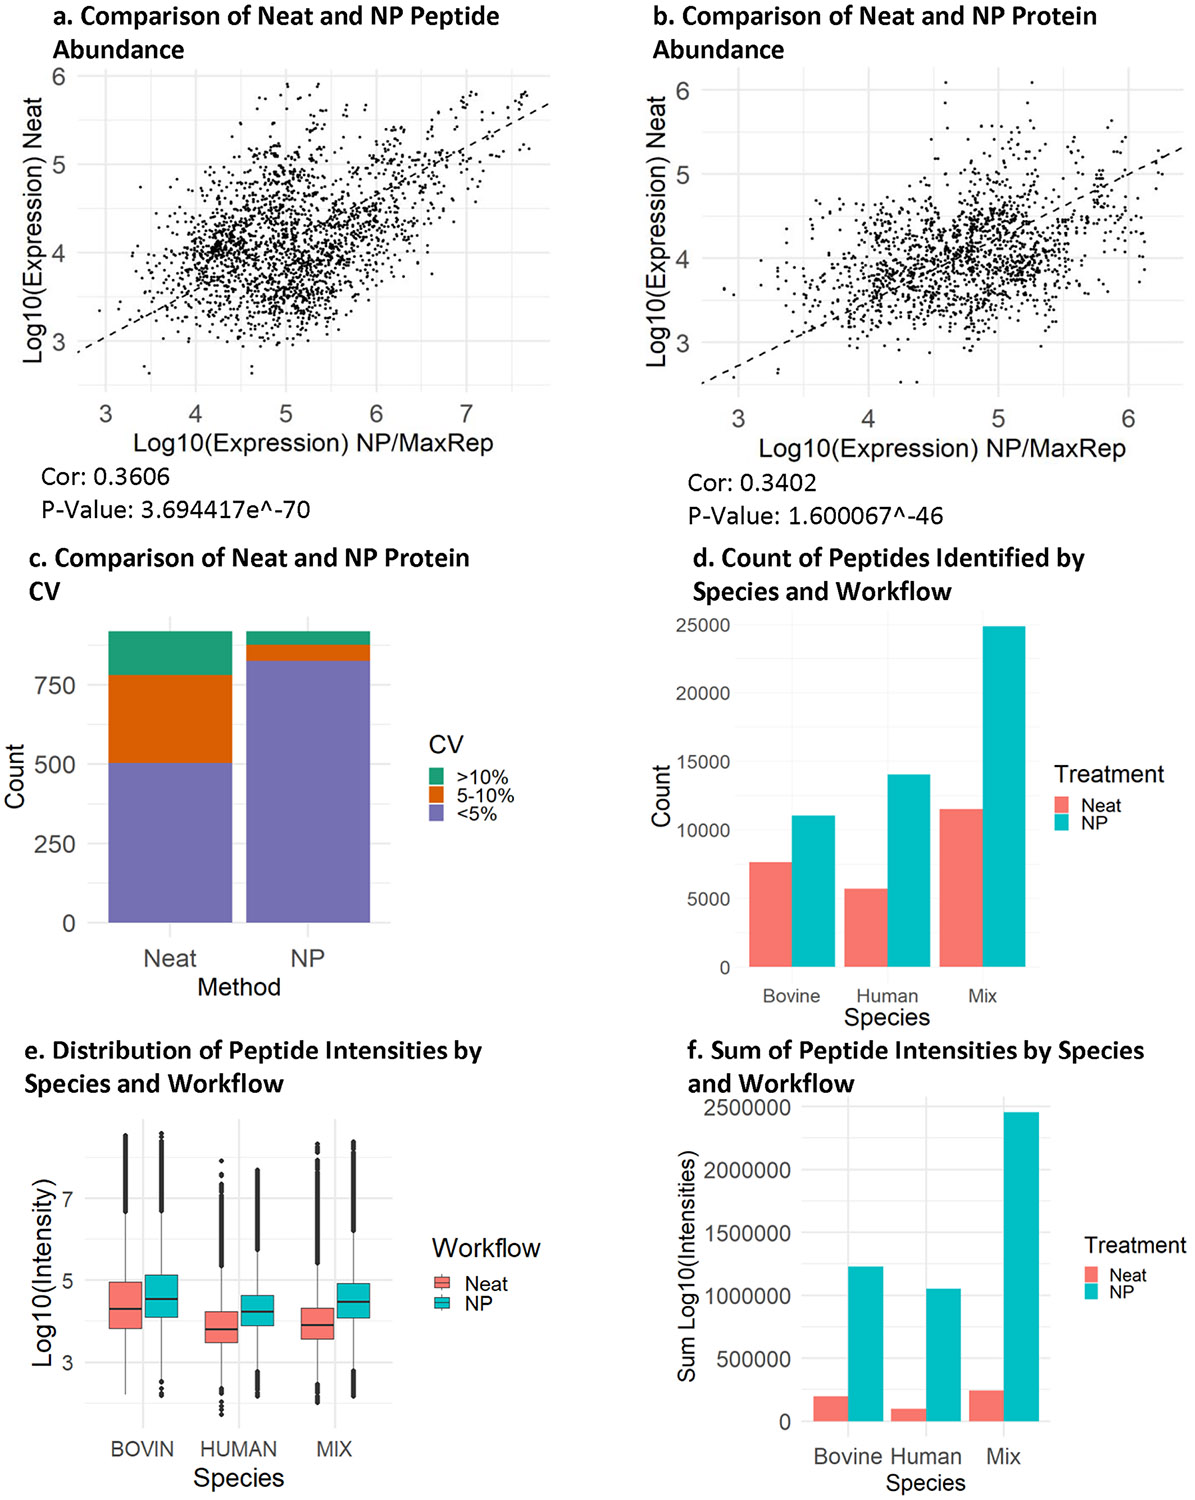
Cellular senescence increases with age and contributes to age-related declines and pathologies. We identified circulating biomarkers of senescence and related them to clinical traits in humans to facilitate future noninvasive assessment of individual senescence burden, and efficacy testing of novel senotherapeutics. Using a nanoparticle-based proteomic workflow, we profiled the senescence-associated secretory phenotype (SASP) in THP-1 monocytes and examined these proteins in 1,060 plasma samples from the Baltimore Longitudinal Study of Aging. Machine-learning models trained on THP-1 monocyte SASP associated SASP signatures with several age-related phenotypes in a test cohort, including body fat composition, blood lipids, inflammatory markers and mobility-related traits, among others. Notably, a subset of SASP-based predictions, including a high-impact SASP panel, were validated in InCHIANTI, an independent aging cohort. These results demonstrate the clinical relevance of the circulating SASP and identify potential senescence biomarkers that could inform future clinical studies.


Conflict of interest statement

Competing interests: The authors declare no competing interests.

Figures

Extended Data Fig. 1 ∣
Extended Data Fig. 1 ∣. Optimization of IR-induced senescence in THP-1 monocytes.
a, Line plot indicating the cell number after exposure to different doses of IR indicates inhibition of cell proliferation up to 7 days after exposure to different doses of IR. b–e, Bar plots showing increased expression of known senescence markers over time after exposure to different doses of IR. f, Bar plots showing elevated SPiDER β-gal confirming induction of senescence in IR-treated THP-1 cells. Statistical analysis was performed using two-tailed Students’ t-test (**P < 0.01). g, Representative fluorescence microscopy images from Edu incorporation assay after exposure to different doses of IR indicating inhibition of cell proliferation on Day 7 after exposure to different doses of IR. Data are represented as mean +/− standard deviation for n number of replicates in all graphs.
Extended Data Fig. 2 ∣
Extended Data Fig. 2 ∣. Validation of Cell Identity after IR Treatment.
a, Classical SA Beta-gal staining performed 7 days after IR treatment showed increased number of beta galactosidase positive cells as indicated by the formation of blue color in senescent cells as compared to the proliferating controls. b, Brightfield microscopy images to assess any change in morphology after senescence induction shows conservation of suspension cell characteristic of monocytes 7 days after IR treatment. Flow cytometry analysis performed to confirm cell identity after IR treatment shows no increase the monocyte differentiation markers c, CD14 and d, CD11b indicating conservation of monocyte cell lineage after IR treatment.
Extended Data Fig. 3 ∣
Extended Data Fig. 3 ∣. NanoParticle Analysis.
a, Peptide expression level is compared between quantification methods of 3 proliferating and 3 senescent monocyte samples, using NanoParticles or Neat (control). Only human peptides present in at least 4 of 6 samples, showing differential expression (Pval < 0.05, t-tests) in neat samples were included (n = 428). b, Protein expression level is compared between quantification methods of 3 proliferating and 3 senescent monocyte samples, using NanoParticles or Neat (control). Only human proteins present in at least 4 of 6 samples, and showing differential expression (Pval < 0.05, t-tests) in neat samples were included (n = 132) For all figures, human mapped peptides and proteins were used. c, CV (SD / Mean log10 intensities) was calculated for all proteins present in at least 2 of 3 Senescent samples and 2 of 3 Proliferating samples in Both Neat and NP MaxRep rollup (N = 919). d, The number of identified peptides in any sample in either NP or Neat treatments, classified as either human, bovine, or mixed. e, The distribution of the peptide log10 intensities sorted by species, quantified using either the standard (Neat) or Proteograph (NP) workflows. f, The sum of the log10 intensities sorted by species, quantified using either the standard (Neat) or Proteograph (NP) workflows.
Extended Data Fig. 4 ∣
Extended Data Fig. 4 ∣. LSPs Show Age-Independent Predictive Potential.
a, Pearson linear models were constructed using covariates only (age, sex, race, and eGFR), LSPs only, or LSPs and covariates. Correlation coefficients for all models are shown by trait. b, This analysis is repeated but including fat percent as a covariate. Pearson linear models were constructed using covariates only (age, sex, race, and eGFR, and fat percent), LSPs only, or LSPs and covariates. Correlation coefficients for all models are shown by trait.
Extended Data Fig. 5 ∣
Extended Data Fig. 5 ∣. Senescence Signatures Predict Frailty.
a, LASSO modeling was used with age, sex, race, and eGFR as covariates in one model, and with CRP and IL-6 added as two additional covariates in a second model, for feature selection of proteins implicated in either BMI or walking pace. Selected features were used for trait prediction (90% train, 10% test). b, Senescence signatures were selected for a 44-component frailty index. Ten rounds of cross-validated (90% train, 10% test) trait prediction using a linear model with LSPs only was performed. Total sample sizes per trait are indicated in Table 1. c, Proteins chosen via machine learning and positively associated with frailty are shown by their association with the frailty index using linear modeling, with covariates age, sex, race, and eGFR.
Extended Data Fig. 6 ∣
Extended Data Fig. 6 ∣. LASSO-Selected Proteins by Cohort.
a, 220 monocyte SASP were detected in both the BLSA (7k SomaScan) and Inchianti (1.3k SomaScan). LASSO modeling was used for feature selection in both Inchianti and BLSA. The number of LSPs selected via LASSO for each train in the BLSA are shown, including 220 SASP and 2 covariates (age and sex). b, LSPs selected in InCHIANTI, including 220 SASP and 2 covariates (age and sex). c, Linear models were constructed using only proteins selected in both studies for each trait. Spearman’s correlation of predicted values of linear models trained on the BLSA and observed values in InCHIANTI. d, Spearman’s correlation of predicted values of linear models trained on InCHIANTI and observed values in the BLSA.
Extended Data Fig. 7 ∣
Extended Data Fig. 7 ∣. Permutation Tests and LASSO Optimized Lambda Values.
a, Principal-Component Analysis was used to condense the high-impact panel into a composite senescence burden score in the BLSA. Principal Component 1 was used to represent an eigengene for the high-impact panel. With the InCHIANTI cohort ranked from low to moderate to high senescence burden, linear trait trends reveal that positive traits HDL and Walking Pace show a negative trend, while negative traits BMI and CRP show a positive trend. b, Permutation tests comparing the predictive potential is shown for LSPs compared with randomly selected proteins. Linear models for each trait were created either using LSPs or randomly selected proteins of the same size. Models were trained on 80% of the data and used to predict the clinical traits for the remaining 20%. Randomly selected proteins models were trained and tested 100,000 times per trait and compared with the accuracy of the LSP-only model. Red dotted lines show where the Spearman’s correlation of the LSP-only model lies in relation to the bell curve for the randomly selected protein models.
Fig. 1 ∣
Fig. 1 ∣. Workflow for identification of SASP signatures from the aging plasma proteome.
a, An in vitro model of senescent monocytes was developed by exposing THP-1 cells to IR and measuring senescence markers. Further quantitative MS proteomics was performed on the secretome of these cells using the automated nanoparticle processing and digestion platform, Proteograph. Age association of the differentially secreted proteins was evaluated using proteomic and phenotypic data from the BLSA and InCHIANTI aging cohorts. b, The analysis pipeline used DIA-NN to identify monocyte secretome followed by filtering out the bovine and shared peptides. Peptide quantities from each nanoparticle were rolled up to proteins to determine the differentially expressed proteins. Image created with BioRender.com.
Fig. 2 ∣
Fig. 2 ∣. Establishing an IR-induced model of senescence in THP-1 monocytes.
a, Representative fluorescence microscopy images from EdU incorporation assay (blue indicates 4,6-diamidino-2-phenylindole (DAPI)-positive cells and pink indicates 5-ethynyl-2′-deoxyuridine (EdU)-positive cells). b, Corresponding quantification bar plots indicating reduced cellular incorporation of EdU by THP-1 cells 7 days after IR exposure (n = 7 replicates; P = 0.00028). c, Bar plots showing increased expression of known senescence markers (n = 7 replicates). d, Elevated SPiDER-βGal confirming induction of senescence in IR-treated THP-1 cells (n = 7 replicates; P = 3.079 × 10⁻⁶). Data are represented as mean ± s.d. for n number of replicates in all graphs. Statistical analyses were performed using an unpaired two-tailed Student’s t-test (*P < 0.05, **P < 0.01, ***P < 0.001).
Fig. 3 ∣
Fig. 3 ∣. Monocyte SASP is Associated with Age in the BLSA.
a, PCA of Neat samples (protein level). b, PCA of 6 NP samples (protein level). c, PCA of 14 NP samples (protein levels). For all PCA, only human proteins present in all samples were used (red dots represent proliferating controls while blue represent senescent samples). d, THP-1 monocyte SASP were identified using nanoparticle processing on the Proteograph. e, The top 200 differentially expressed proteins were used for Ontology analysis for Biological Process (P < 0.05, q-value < 0.1 calculated using the Benjamini–Hochberg method. f, Overlap between monocyte and fibroblast SASP. g, Ontology analysis of overlapping SASP proteins between monocytes and fibroblasts (P adjusted calculated using the Benjamini–Hochberg method).
Fig. 4 ∣
Fig. 4 ∣. LASSO Modeling Using SASP of Clinical Traits in the BLSA.
a, The 1,550 THP-1 monocyte SASPs are detected in the BLSA 7K SomaScan. b, LASSO models were trained on 80% of the BLSA cohort and used to predict clinical traits of the remaining 20%. Total sample sizes per trait are indicated in Table 1. Two-sided Spearman correlations are shown between the predicted and observed values in the test set for each clinical trait. c, LASSO modeling was used for feature selection and the number of LSPs implicated in each clinical trait are shown, including 1,550 SASP proteins and four covariates (age, sex, race and eGFR). d, /Receiver operating characteristic (ROC) plot comparing the predictive potential (80% train and 20% test) of LSPs to predict obesity with control-only models, showing that LSPs seem to provide additional predictive potential beyond age and other controls alone.
Fig. 5 ∣
Fig. 5 ∣. Modeling of the fat content in BLSA using SASP candidates.
a, LASSO models were trained on 80% of the BLSA cohort and used to predict clinical traits of the remaining 20%. Total sample sizes per trait are indicated in Table 1. Two-sided Spearman correlations are shown between the predicted and observed values of the test set for each clinical trait. b, LASSO modeling was used for feature selection, and the number of LSPs implicated in each clinical trait are shown. c, ROC plot comparing the predictive potential (80% train and 20% test) of LSPs to predict obesity with control-only models, showing that LSPs seem to provide additional predictive potential beyond age and other controls alone. d, The correlation between observed waist size and that predicted by LASSO modeling (80% train and 20% test).
Fig. 6 ∣
Fig. 6 ∣. SASP-based associations show robust replication in the InCHIANTI aging study.
a, 220 THP-1 monocyte SASP were detected in both the BLSA (7K SomaScan) and InCHIANTI (1.3K SomaScan). LASSO modeling was used for feature selection in both InCHIANTI (n = 997) and BLSA (n = 1,060) and linear models were constructed using only proteins selected in both studies for each trait. Spearman’s correlation of predicted values of linear models trained on the BLSA and observed values in InCHIANTI are shown on the x axis and Spearman’s correlation of predicted values of linear models trained on InCHIANTI and observed values in the BLSA are shown on the y axis. b, Binomial models were trained either using controls (age and sex) or controls + LSPs in BLSA, then used to predict obesity in InCHIANTI.
Fig. 7 ∣
Fig. 7 ∣. A high-impact SASP panel robustly predicts multiple clinical traits.
a, For a 14-trait panel, proteins were ranked by the number of features for which they were selected via LASSO in the BLSA, and the most frequently selected proteins are shown with their cross-trait importance on the x axis. Only proteins that were positively associated with negative traits such as BMI and CRP, and those that were inversely associated with positive traits such as mobility were selected. Stars indicate those that were also detected in InCHIANTI. Boxplot elements are defined as follows: center line, median; box limits, upper and lower quartiles; whiskers, 1.5× interquartile range; points, outliers. b, Linear models were trained on 80% of the BLSA cohort and used to predict clinical traits in the remaining 20%. Total sample sizes per trait are indicated in Table 1. Spearman correlation between the predicted and observed test values are shown. c, Linear models were trained on 80% of the InCHIANTI cohort and used to predict clinical traits in the remaining 20%. Spearman correlation between the predicted and observed test values are shown. d, PCA was used to condense the high-impact panel into a composite senescence burden score in the BLSA. Principal component 1 was used to represent an eigengene for the high-impact panel. With the BLSA cohort ranked from a low to moderate to a high senescence burden, linear trait trends reveal that the positive traits HDL and walking pace show a negative trend, whereas the negative traits BMI and CRP show a positive trend. The lines represent the trait scores predicted by each linear model. Shaded regions represent 95% confidence intervals.

Update of

References

    1. Lee KA, Flores RR, Jang IH, Saathoff A & Robbins PD Immune senescence, immunosenescence and aging. Front. Aging 3, 2673–6217 (2022). - PMC - PubMed
    1. Yousefzadeh MJ et al. An aged immune system drives senescence and ageing of solid organs. Nature 594, 100–105 (2021). - PMC - PubMed
    1. Ong S-M et al. The pro-inflammatory phenotype of the human non-classical monocyte subset is attributed to senescence. Cell Death Dis. 9, 266 (2018). - PMC - PubMed
    1. Saul D. et al. A new gene set identifies senescent cells and predicts senescence-associated pathways across tissues. Nat. Commun 13, 4827 (2022). - PMC - PubMed
    1. Lin Y. et al. Circulating monocytes expressing senescence-associated features are enriched in COVID-19 patients with severe disease. Aging Cell 22, 1474–9726 (2023). - PMC - PubMed

LinkOut - more resources