Clinical Trial
. 2025 Aug;31(8):2602-2610.
doi: 10.1038/s41591-025-03743-2. Epub 2025 Jun 3.

A generative AI-discovered TNIK inhibitor for idiopathic pulmonary fibrosis: a randomized phase 2a trial

Affiliations
Clinical Trial

A generative AI-discovered TNIK inhibitor for idiopathic pulmonary fibrosis: a randomized phase 2a trial

Zuojun Xu et al. Nat Med. 2025 Aug.

Abstract

Despite substantial progress in artificial intelligence (AI) for generative chemistry, few novel AI-discovered or AI-designed drugs have reached human clinical trials. Here we present the results of the first phase 2a multicenter, double-blind, randomized, placebo-controlled trial testing the safety and efficacy of rentosertib (formerly ISM001-055), a first-in-class AI-generated small-molecule inhibitor of TNIK, a first-in-class target in idiopathic pulmonary fibrosis (IPF) discovered using generative AI. IPF is an age-related progressive lung condition with no current therapies available that reverse the degenerative course of disease. Patients were randomized to 12 weeks of treatment with 30 mg rentosertib once daily (QD, n = 18), 30 mg rentosertib twice daily (BID, n = 18), 60 mg rentosertib QD (n = 18) or placebo (n = 17). The primary endpoint was the percentage of patients who have at least one treatment-emergent adverse event, which was similar across all treatment arms (72.2% in patients receiving 30 mg rentosertib QD (n = 13/18), 83.3% for 30 mg rentosertib BID (n = 15/18), 83.3% for 60 mg rentosertib QD (n = 15/18) and 70.6% for placebo (n = 12/17)). Treatment-related serious adverse event rates were low and comparable across treatment groups, with the most common events leading to treatment discontinuation related to liver toxicity or diarrhea. Secondary endpoints included pharmacokinetic dynamics (Cmax, Ctrough, tmax, AUC0-t/τ/∞ and t1/2), changes in lung function as measured by forced vital capacity, diffusion capacity of the lung for carbon monoxide, forced expiry in 1 s and change in the Leicester Cough Questionnaire score, change in 6-min walk distance and the number and hospitalization duration of acute exacerbations of IPF. We observed increased forced vital capacity at the highest dosage with a mean change of +98.4 ml (95% confidence interval 10.9 to 185.9) for patients in the 60 mg rentosertib QD group, compared with -20.3 ml (95% confidence interval -116.1 to 75.6) for the placebo group. These results suggest that targeting TNIK with rentosertib is safe and well tolerated and warrants further investigation in larger-scale clinical trials of longer duration. ClinicalTrials.gov registration number: NCT05938920 .


Conflict of interest statement

Competing interests: F.R., S.R., C.S., S.L., Y.L., H.Z., S.C., H.C., M.K., D.G. and A.Z. are employees of Insilico Medicine. Insilico Medicine was the study sponsor. The other authors declare no competing interests.

Figures

Fig. 1
Fig. 1. Trial participant randomization and follow-up scheme.
Of 128 patients screened for inclusion, 71 were randomized to receive 30 mg rentosertib QD (n = 18), 30 mg rentosertib BID (n = 18), 60 mg rentosertib QD (n = 18), or placebo (n = 17) over the course of 12 weeks. Sixteen patients discontinued treatment prior to the end of treatment. Source data
Fig. 2
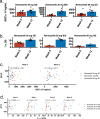
Fig. 2. Changes in FVC ± 95% CI after 12 weeks of rentosertib treatment compared to baseline.
a, The absolute change in FVC ± 95% CI. b, The absolute change in FVC ± 95% CI ANCOVA model with multiple imputation assuming missing at random (MAR).
Fig. 3
Fig. 3. Pharmacokinetic properties of rentosertib.
ac, Pharmacokinetic dynamics of rentosertib in patient sera collected predose and periodically throughout 24 h posttreatment at week 0 (a), at 0 h posttreatment at weeks 2, 4 and 8 (b) and 48 h after administration at week 12 (c). d, AUC0–t of rentosertib exposure; n = 22 in 30 mg QD, n = 21 in 30 mg BID, n = 20 in 60 mg QD. e, Cmax of rentosertib exposure; n = 22 in 30 mg QD, n = 21 in 30 mg BID, n = 20 in 60 mg QD. f, Ctrough of rentosertib exposure in patient sera collected pretreatment at weeks 0, 2, 4, 8 and 12. All data represent arithmetic mean ± s.d.
Fig. 4
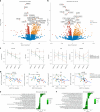
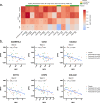
Fig. 4. Post-hoc exploratory analysis of serum protein profiling.
a,b, Differentially abundant proteins in serum from patients receiving rentosertib at 30 mg BID (a) and 60 mg QD (b) identified with a generalized linear model. c, Serum levels of COL1A1, FAP, FN1 and MMP10 decrease with rentosertib dose and time on treatment. n = 11 patients in placebo, n = 11 patients in 30 QD, n = 11 patients in 30 BID, n = 10 patients in 60 QD. d, The changes in serum levels of COL1A1, FAP, FN1 and MMP10 from baseline to week 12 are inversely correlated with change in FVC from baseline to week 12. n = 43 patients at each visit; P value calculated by Pearson correlation analysis. e,f, Reactome pathway enrichment for differentially abundant proteins in serum from patients receiving rentosertib at 30 mg BID (e) and 60 mg QD (f).
Extended Data Fig. 1
Extended Data Fig. 1. Key trial eligibility criteria, randomization scheme, and schedule of key study activities.
Eligible patients were randomized to receive 30 mg rentosertib QD, 30 mg rentosertib BID, 60 mg rentosertib QD, or placebo administered over 12 weeks with periodic assessment and plasma sampling. IPF, idiopathic pulmonary fibrosis; FVC, forced vital capacity; FEV1, forced expiratory volume in one second; DLCO, diffusion capacity of the lung for carbon monoxide; SOC, standard-of-care; QD, once-daily; BID, twice-daily; HRCT, high-resolution computed tomography; 6MWD, six-minute walk distance; LCQ, Leicester cough questionnaire; PK, pharmacokinetics; EOT, end-of-trial; EOS, end-of-study.
Extended Data Fig. 2
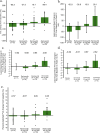
Extended Data Fig. 2. Changes in FVC after 12 weeks of treatment with rentosertib.
a-b) Changes in forced vital capacity (FVC) ± 95% CI after 12 weeks of treatment compared to baseline excluding n = 1 patient from the placebo group and n = 1 patient from the rentosertib 30 mg QD group who exhibited >600 mL difference between screening and baseline FVC measurements, making uncertain the baseline FVC values in those patients. Absolute change in FVC ± 95% CI (a) and absolute change in FVC ± 95% CI ANCOVA Model with Multiple Imputation assuming missing at random (MAR) (b). (c) Absolute change in FVC (% Predicted) ± SE, ANCOVA Model with Multiple Imputation assuming MAR. (d) Percentage change in FVC ± SE, ANCOVA Model with Multiple Imputation assuming MAR. (e) Change in percent predicted FVC ± SD.
Extended Data Fig. 3
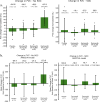
Extended Data Fig. 3. Changes in FVC after 12 weeks of treatment with rentosertib stratified by concurrent use of SOC antifibrotic therapy.
(a) Absolute change in FVC ± 95% CI in patients not concurrently taking SOC antifibrotic therapy (left) or in patients concurrently taking antifibrotic therapy (right). (b) Absolute change in FVC ± 95% CI by ANCOVA Model with Multiple Imputation assuming missing at random (MAR) in patients not concurrently taking SOC antifibrotic therapy (left) or in patients concurrently taking antifibrotic therapy (right).
Extended Data Fig. 4
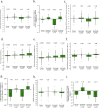
Extended Data Fig. 4. Changes in additional lung function metrics after 12 weeks of treatment with rentosertib.
(a) Absolute change in DLCO ± 95% CI. (b) Absolute Change in DLCO (% Predicted) ± SE, ANCOVA Model with Multiple Imputation assuming missing at random (MAR). (c) Absolute change in percent predicted HGB-corrected DLCO (%) ± SD. (d) Absolute change in FEV1 ± SD. (e) Mean percent-change in FEV1 ± SD. (f) Absolute change in LCQ score ± SD. (g) Absolute change in LCQ score ± SE by Mixed model for repeated measures (MMRM). (h) Absolute change in 6MWD ± SD. (i) Absolute change in 6MWD ± SE, ANCOVA Model with Multiple Imputation assuming MAR.
Extended Data Fig. 5
Extended Data Fig. 5. Association of rentosertib treatment with PK parameters.
(a) AUC0-t of rentosertib at week 0 and week 12, data are mean ± SD. n = 11 at week 0 and n = 11 at week 12 in 30QD, n = 11 at week 0 and n = 10 at week 12 in 30 BID, n = 10 at week 0 and n = 10 at week 10 in 60 QD. (b) t1/2 of rentosertib at week 0 and week 12, data are mean ± SD. n = 11 at week 0 and n = 11 at week 12 in 30QD, n = 11 at week 0 and n = 10 at week 12 in 30 BID, n = 10 at week 0 and n = 10 at week 10 in 60 QD. (c) Correlation analysis of AUC0-t and change in FVC between week 0 and week 12. (d) Correlation analysis of Ctrough measured throughout the trial and change in FVC between week 0 and week 12. P values calculated by two-sided Spearman correlation analysis.
Extended Data Fig. 6
Extended Data Fig. 6. Time- and dose-associated changes in serum protein expression associated with rentosertib treatment.
(a) Change in Normalized Protein eXpression (NPX) from baseline to subsequent visits (weeks 4, 8, and 12) with a simple linear regression model (delta_NPX ~ treatment_cat) fitted to assess the relationship between treatment dose and protein expression changes using Benjamini-Hochberg (BH)-adjusted P values. (b) Change in NPX between baseline and week 12 by two-sided paired BH-adjusted t-test. Red dots denote proteins with BH-adjusted P value < 0.1. Yellow boxes highlight fibrosis-related proteins.
Extended Data Fig. 7
Extended Data Fig. 7. Serum proteins with changes in expression associated with changes in FVC with rentosertib treatment.
(a) PandaOmics analysis of published RNA-seq gene expression datasets profiling patients with IPF and healthy individuals of four top proteomics hit genes in our trial cohort. (b) Correlation analysis of protein abundance of genes previously associated with lung function and IPF TFS with change in FVC from week 0 to week 12, treatment regimen, and time on treatment. n = 43 patient at each visit, and the P value was calculated by two-sided Pearson correlation analysis; n = 11 patients in Placebo, n = 11 patients in 30 QD; n = 11 patients in 30 BID, n = 10 patients in 60 QD. P values calculated by paired t-test.
Extended Data Fig. 8
Extended Data Fig. 8. Correlation analysis of protein abundance of genes previously associated with aging-related dysfunction.
Correlation analysis of protein abundance of genes (IL10, CD5, COL6A3) previously associated with aging-related dysfunction, such as immunity and ECM remodeling, with change in FVC from week 0 to week 12 and time on treatment. Left panel: n = 43 patient at each visit; P values calculated by two-sided Pearson correlation analysis; Right panel: n = 11 patients in placebo, n = 11 patients in 30 QD; n = 11 patients in 30 BID, n = 10 patients in 60 QD, boxes and whiskers are quartiles; P values calculated by paired t-test.

References

    1. Scannell, J. W., Blanckley, A., Boldon, H. & Warrington, B. Diagnosing the decline in pharmaceutical R&D efficiency. Nat. Rev. Drug Discov.11, 191–200 (2012). - PubMed
    1. Berdigaliyev, N. & Aljofan, M. An overview of drug discovery and development. Future Med Chem.12, 939–947 (2020). - PubMed
    1. Pun, F. W., Ozerov, I. V. & Zhavoronkov, A. AI-powered therapeutic target discovery. Trends Pharmacol. Sci.44, 561–572 (2023). - PubMed
    1. Qureshi, R. et al. AI in drug discovery and its clinical relevance. Heliyon9, e17575 (2023). - PMC - PubMed
    1. You, Y. et al. Artificial intelligence in cancer target identification and drug discovery. Signal Transduct. Target. Ther.7, 156 (2022). - PMC - PubMed

Publication types

Associated data

LinkOut - more resources