. 2025 Jul;31(7):2416-2429.
doi: 10.1038/s41591-025-03693-9. Epub 2025 Jun 3.

Pooled analysis of 3,741 stool metagenomes from 18 cohorts for cross-stage and strain-level reproducible microbial biomarkers of colorectal cancer

Affiliations

Pooled analysis of 3,741 stool metagenomes from 18 cohorts for cross-stage and strain-level reproducible microbial biomarkers of colorectal cancer

Gianmarco Piccinno et al. Nat Med. 2025 Jul.

Abstract

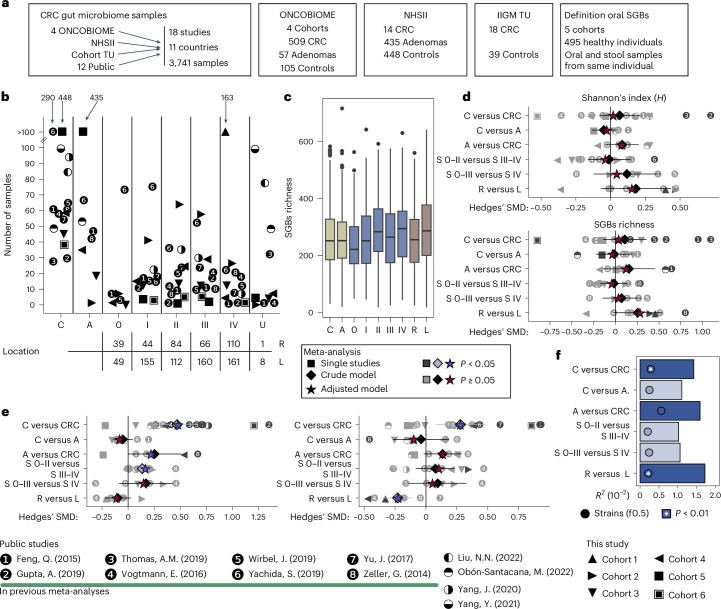
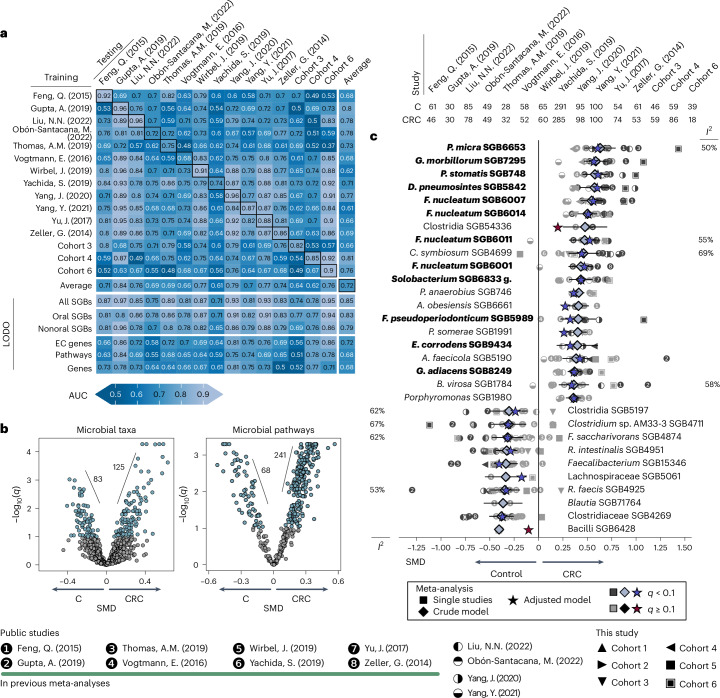
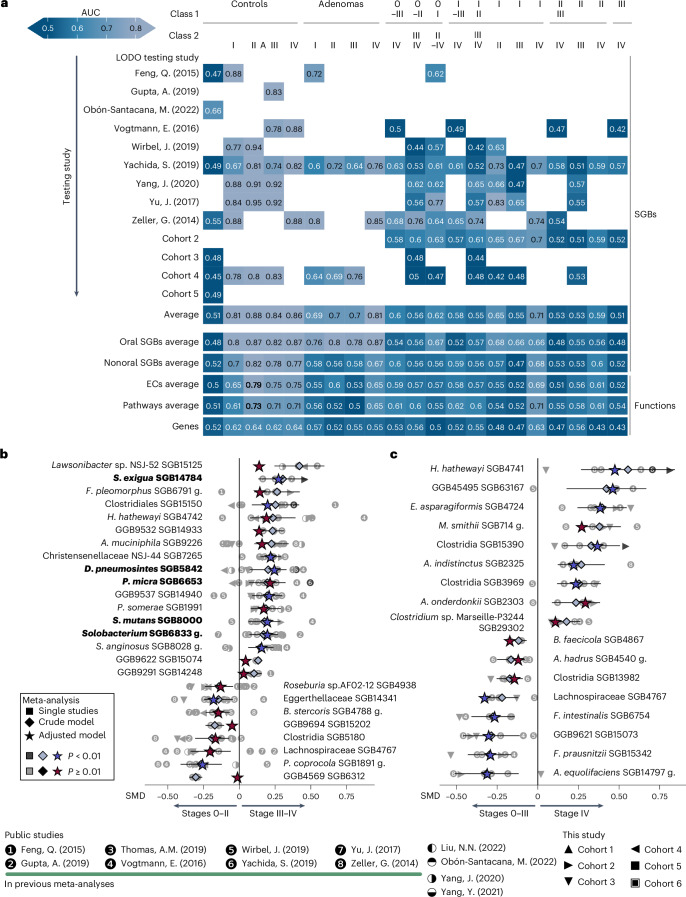
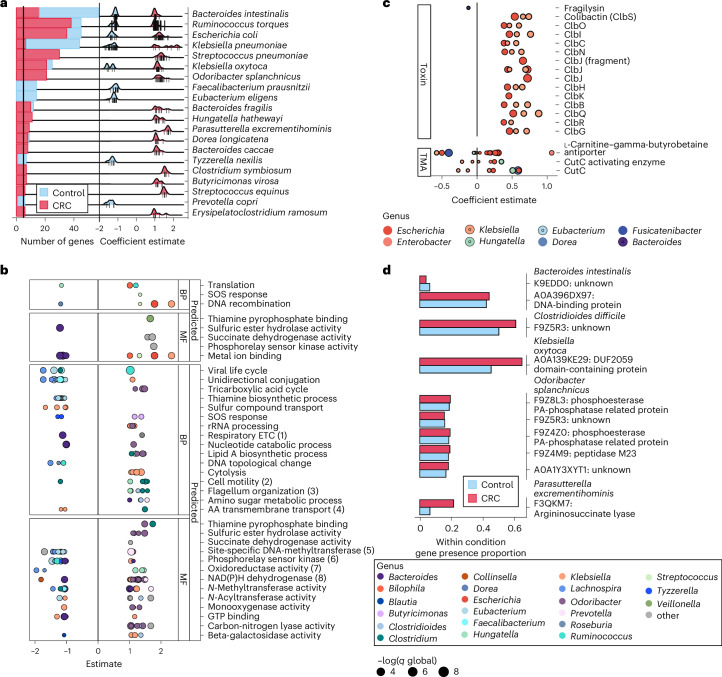
Associations between the gut microbiome and colorectal cancer (CRC) have been uncovered, but larger and more diverse studies are needed to assess their potential clinical use. We expanded upon 12 metagenomic datasets of patients with CRC (n = 930), adenomas (n = 210) and healthy control individuals (n = 976; total n = 2,116) with 6 new cohorts (n = 1,625) providing granular information on cancer stage and the anatomic location of tumors. We improved CRC prediction accuracy based solely on gut metagenomics (average area under the curve = 0.85) and highlighted the contribution of 19 newly profiled species and distinct Fusobacterium nucleatum clades. Specific gut species distinguish left-sided versus right-sided CRC (area under the curve = 0.66) with an enrichment of oral-typical microbes. We identified strain-specific CRC signatures with the commensal Ruminococcus bicirculans and Faecalibacterium prausnitzii showing subclades associated with late-stage CRC. Our analysis confirms that the microbiome can be a clinical target for CRC screening and characterizes it as a biomarker for CRC progression.


Conflict of interest statement

Competing interests: N.S. is a founder and shareholder of PreBiomics Srl and is on the scientific advisory board of ZOE Ltd and received consultancy fees from them. C.H. is a member of the Seres Therapeutics and Empress Therapeutics scientific advisory boards. L.Z. is a founder of Biotech. Cie everImmune involved in the cancer/microbiome space, the president of everImmune scientific advisory board (SAB) and received honoraria from everImmune. L.Z. received research contract fundings from Daiichi Sankyo and Biomérieux. The other authors declare no competing interests.

Figures

Fig. 1
Fig. 1. Overall and oral taxa-specific gut microbial diversity were significantly different according to CRC status, stage and primary tumor location.
a, Overview of the cohorts (n = 18) and sample sizes (n = 3,741) according to case-control, cancer stage and primary tumor location, along with the cohorts used to define oral-typical species. b, Number of samples available from each CRC stage and the two primary tumor locations. Symbols indicate the cohort. c, Sample microbiome richness at each stage and primary tumor location. Box plots represent the within-category microbial richness distribution summarized by the first and third quartiles as hinges of the box, the median and whiskers extending to the largest or smallest value not exceeding 1.5× the interquartile range from the two ends of the box, with data beyond these values plotted individually as outliers. d, Meta-analyzed SMDs of the associations between alpha-diversity (Shannon diversity (upper) and SGB richness (lower)) and all paired comparisons. The 95% CIs for each meta-analysis model are indicated by a horizontal line. P values were computed via two-tailed t-test. Significant associations (P < 0.05) are indicated by a light blue diamond. SMD values corrected for age, sex and BMI (Methods) are indicated by a star (blue when P < 0.05). No correction for multiple hypothesis testing was performed. e, Meta-analysis of the association between the cumulative relative abundance of oral species (oral-to-gut score) and all paired comparisons (left) and between the number of oral species (oral-to-gut richness) and all paired comparisons (right). Symbols and axes are similar to d. P values were computed via two-tailed t-test. No correction for multiple hypothesis testing was performed. SMD values corrected for age, sex and BMI are indicated by a star. f, PERMANOVA (stratified by dataset) derived R2 according to CRC stage and primary tumor location, computed via adonis2 (Methods) on Bray–Curtis distances. Comparisons with P < 0.01 are highlighted in dark blue. Circles indicate the R2 explained by strain-level microbial features, and comparisons with P < 0.01 are marked with an asterisk. The text f0.5 denotes the feature set defined in the Methods section ‘Strain-level feature identification’. A, adenoma; C, control; L, left-sided; R, right-sided; 0, stage 0; I, stage I; II, stage II; III, stage III; IV, stage IV; U, stage not available.
Fig. 2
Fig. 2. Stool microbiome composition is predictive for CRC.
a, Cross-prediction matrix of the ML classifier trained and tested to predict CRC versus control samples. Dataset-wise CV AUCs are reported along the diagonal. Off-diagonal cells report performances of a classifier trained on the cohort on the row and tested on the cohort on the column. Bottom six rows report different LODO validations obtained by training a classifier on all the cohorts but one and testing on the left-out cohort (column), on the complete taxonomic profiles (All SGBs), the subset of oral SGBs (Oral SGBs), the subset of all SGBs except the oral SGBs (Nonoral SGBs), gene families clustered according to the EC numbers (EC genes) and MetaCyc pathways (Pathways), respectively, and a filtered set of gene families (Genes) (Methods). b, Significance levels of meta-analysis on microbial taxa and pathways between controls and CRC. The x axis shows the SMD and the y axis shows −log10(q). Positive values of Hedges’ g SMD indicate a positive association with CRC (higher abundance in CRC than controls), while negative values indicate a positive association with controls (higher abundance in controls than CRC). Associations with q < 0.1 are reported in blue. I2 values for heterogeneity in meta-analysis are reported if ≥50% c, Twenty strongest SGBs associated with CRC and ten with controls. Each line on the y axis reports the set of single-dataset and Hedges’ model SMD (values on the x axis, with the same directions as in b, represented by symbols and diamonds, respectively. Significant single-dataset comparisons (q < 0.1) are colored dark gray. Only significant Hedges’ g significant values (q < 0.1) are reported. SMD values corrected for age, sex and BMI (Methods) are indicated by a star (colored blue when q < 0.1). Oral SGBs are highlighted in bold. g, group.
Fig. 3
Fig. 3. CRC stage prediction and microbiome signatures for early and late stages of CRC.
a, LODO AUC predictions based on taxonomic microbiome composition (upper) and microbial functional potential (lower). Paired comparisons are indicated in the header (Class 1 versus Class 2). Each cell contains the AUC from a random forest validated in LODO, tested on the study reported in the row and trained on the remaining studies. The last five rows of the matrix report the average LODO AUC values predicted using oral microbes, all SGBs except the oral ones, EC profiles, pathways profiles and a subset of the gene families (Methods). b,c, Significant species (Hedges’ model effect size P < 0.01, none presented q < 0.1) found in association either with earlier or later stages in meta-analysis considering the following comparisons (all presented I2 < 50%). b, Stages 0–II versus stages III–IV. c, Stages 0–III versus stage IV. The shape of each point indicates the dataset-specific effect size for each species, and the blue diamonds indicate Hedges’ model effect size on SMD. P values were computed via two-tailed t-test. SMD values were corrected for age, sex and BMI and indicated by a star (blue if P < 0.01). Oral SGBs are highlighted in bold. g, group.
Fig. 4
Fig. 4. Stage-specific microbial signatures overlap with oral and cardiometabolic risk signatures and microbiome differences in right- and left-sided tumors.
a, Linear mixed model coefficients (in the heatmap cells) showing the associations between each microbial species and each stage when compared with controls. Positive values (from orange to brown) indicate increased stage SGB abundances compared with in controls, while negative coefficients (blue) indicate decreased abundances. Significant associations (q < 0.1) are indicated by a star. Associations also found significant in either right- or left-sided CRC for each stage (q < 0.1) are indicated by a right- or left-pointing triangle, respectively. Oral SGBs are highlighted in bold. Box plots represent the distribution of three SGBs with significant changes in the abundances in CRC stages. b, Jaccard similarities between the signatures of sequential CRC stages. c, Overlap for CRC stages signatures with oral SGBs and the species associated with cardiometabolic risk in the PREDICT 1 (P1) study, with T2D, IBD, CD and inflammatory diseases (Intest./Syst. infl.). The number of stage-associated SGBs is reported on top of each column. The number of SGBs in each signature is reported at the end of each row. d, LODO AUC for right-sided versus left-sided CRC classification, considering all SGBs, oral SGBs only, nonoral SGBs, EC numbers, MetaCyc pathways or a subset of all the gene families (Methods). e, SGBs significantly associated (q < 0.1) either with right- or left-sided CRC. Meta-analysis Hedges’ g is indicated by a diamond, while the SMD values corrected for age, sex and BMI are indicated by a star (blue if q < 0.1). Oral SGBs are in shown bold. f, SMD values of a meta-analysis of right- versus left-sided tumor-related microbiome composition (y axis) versus the coefficients of a meta-analysis of stages 0–II versus stages III–IV (x axis, left), and 0–III versus stage IV (x axis, right) for taxonomic profiles. Common signature SGBs are in shown orange (q < 0.1 and P < 0.01, respectively); SGBs significant in the cancer stages meta-analysis are shown in green (P < 0.01); SGBs significant in the meta-analysis for tumor location are shown in blue (q < 0.1); and SGBs not significant in both analyses are shown in gray. Asin-sqrt rel. ab., arcsine square root transformed relative abundance; C, Candidatus; g, group; Intest., ; N.T., not tested in the corresponding analysis.
Fig. 5
Fig. 5. Strain-specific differential gene carriage in the CRC gut ecosystems.
a, Top 20 species by the number of significantly differentially carried genes among their strains in CRC (FDR global q < 0.05 and absolute GLM coefficient estimate >1), likely representing species diversity. For the top 20 species, we quantified the number of genes they were differentially carrying along with the dispersion of such genes in CRC and healthy subjects as quantified by Anpan. Tick marks indicate individual genes. b, GO terms identified as having the highest ratio of significantly called UniRef90s (genes) in CRC to total genes defined in the term. GO terms are drawn from biological processes (BP) and molecular functions (MF) and are split across known gene families (annotated directly to GO by HUMAnN and predicted from FUGAsseM, https://huttenhower.sph.harvard.edu/fugassem/) using samples with paired metagenomic and metatranscriptomic data to assess the likely function of undescribed gene families. (1) Respiratory electron transport chain; (2) bacterial-type flagellum-dependent cell motility; (3) bacterial-type flagellum organization; (4) amino acid transmembrane transport; (5) site-specific DNA-methyltransferase (adenine-specific) activity; (6) phosphorelay sensor kinase activity; (7) oxidoreductase activity, acting on other nitrogenous compounds as donors; and (8) NAD(P)H dehydrogenase (quinone) activity. c, Carriage of genes previously known to associate broadly with CRC; colibactin, fragilysin and cutC genes, by specific clades’ strains in the CRC ecosystem as quantified by Anpan’s gene model. Although these genes did not show significance when assessed in species, they did at the global level (for example, when considering total carriage of the function in CRC metagenomes). d, The significant genes involved in the carbon–nitrogen GO term (b) were expanded and broken down by species carrying the genes. For each species-gene pair, we quantified the prevalence of the gene’s carriage in healthy controls and CRC cases. Many of the genes predicted to be in this category were annotated by FUGAsseM and as such are predictions of the potential function but are otherwise genes of unknown function. AA, amino acid; ETC, electron transport chain; rRNA, ribosomal RNA; TMA, trimethylamine.
Fig. 6
Fig. 6. Within-species subclades associations with CRC, tumor staging and primary location.
a, Several species exhibited within-species subclade associations with CRC, late CRC, metastatic CRC and the primary tumor location (right or transverse colon versus left colon or rectum). Only two of the associations were identified in species that were themselves differentially abundant with CRC in the meta-analysis, emphasizing the different pressures on colonization and growth versus phylogeny and evolution. Species are shown if the GLM improvement with phylogeny was greater than an ELPD of 4. Points are colored by the Hedges’ g value of the species-level meta-analysis in the given comparison, and the number of tips in the analysis is presented in the barplot, colored by CRC or control, early or late stages of CRC or right- or left-sided. Error bars represent 95% CI. b, Within-species subclade clustering obtained via Anpan analysis with CRC as the outcome of interest. Here, we highlighted two examples of Lachnospira eligens and E. rectale (full model results from Anpan in Supplementary Table 10) exhibiting phylogenetically distinct subclades associated with CRC or healthy individuals. For each cladogram, the inner ring is colored by CRC or control, tips are colored by stage and the outer ring is the mean posterior phylogenetic effect as calculated by Anpan’s phylogenetic generalized linear mixed model (PGLMM) model with covariates of age, sex and study. c,d, Within-CRC comparisons had more significant hits than global analysis (CRC or control). Here, we present some of the top hits from the model with Collinsella aerofaciens SGB14546, Clostridium fessum SGB4705 and F. prausnitzii 15318 (c) for the metastatic comparisons, and R. bicirculans SGB4262 (d) in late stages. Similar to b, the inner ring is the CRC stage, while tips are metastatic status and early or late, respectively, and the outer ring is the mean posterior phylogenetic effect (full model results from Anpan are given in Supplementary Table 10). e, Significant gene carriage differences by taxon associations in R. bicirculans (Anpan, q < 0.05 and abs(estimate) > 1). Genes differentially carried by R. bicirculans included those in carbohydrate metabolism, DNA mobility, and response to oxidative environments; all genes were found to be more present in late-stage CRC (III–IV) than in early-stage CRC (0–III).
Extended Data Fig. 1
Extended Data Fig. 1. Alpha and beta-diversity analysis on taxonomic and functional profiles in CRC stages and primary tumor location.
a) Richness of microbial enzymes and pathways in controls, adenomas, the different CRC stages and primary tumor locations. The abbreviations used in this plot follow the ones in Main Fig. 1. In particular, C: control, A: adenoma; 0: CRC Stage 0; I: CRC Stage I; II: CRC Stage II; III: CRC Stage III; IV: CRC Stage IV; R: right-sided CRC; L: left-sided CRC. b) t-SNE based on Bray-Curtis dissimilarity for taxonomic and functional profiles. The samples are colored according to CRC staging in the first row (light-green for controls, light-blue for adenomas, orange for early-CRC and brown for late-CRC), while they are colored according to primary tumor location in the second row (red for right-sided CRC and blue for left-sided CRC). The cohort derivation (either from ONCOBIOME, NHSII or public studies) is indicated as the shape of each point (triangle for ONCOBIOME, square for NHSII and a circle for public cohorts).
Extended Data Fig. 2
Extended Data Fig. 2. Oral SGBs abundance in CRC and evaluation of the definition criteria for the oral-to-gut score.
A) CRC sample relative abundance (%) of highly prevalent oral species (at least 10% in CRC). Each column corresponds to a sample and each row corresponds to an SGB. The upper threshold in the heatmap color scale corresponds to the 99th percentile of oral species relative abundance in CRC samples. Relative abundance values higher than this threshold are represented with the same color. B) Exclusive and common prevalence of SGBs in the oral cavity and in the stool samples of the cohorts used for the definition of the oral SGB list and (C) trend in the number of SGBs in the list at different thresholds of exclusive oral prevalence and exclusive stool prevalence. D) Distribution of the cumulative relative abundances of species categorized as oral or non-oral. E) Meta-analysis effect sizes (Hedges’ g) of the oral-to-gut score computed based on different thresholds of the ‘Exclusive oral prevalence’.
Extended Data Fig. 3
Extended Data Fig. 3. Phylogenetic trees of Fusobacterium nucleatum SGBs and CRC-associated species.
A) The left-most phylogenetic tree shows the relationships between F. nucleatum SGBs and previously characterized F. nucleatum subspecies. Each leaf represents either an isolated genome (circle) or a metagenome-assembled genome (MAG, reported as a triangle), as available in the Jun23 release of the MetaPhlAn 4 database. The color of the leaf corresponds to the assigned SGB. Phylogenies were reconstructed using PhyloPhlAn 3. The correspondence between F. nucleatum SGBs and F. nucleatum subspecies is the following: subspecies hwasookii corresponds to SGB5997, subspecies polymorphum to SGB6001, subspecies animalis to SGB6007 (previously Fna C2, in 26), subspecies nucleatum to SGB6011 (Fusobacterium nucleatum sensu stricto), subspecies vincentii to both SGB6013 (previously Fna C1, in 26) and SGB6014, Fusobacterium simiae to SGB6018 and subspecies polymorphum to SGB101482. The right-most tree reports in addition the body site of origin from which the genomes were reconstructed. B) Phylogenetic reconstruction via PhyloPhlAn 3 of isolate and MAGs either derived from oral, stool, or unknown body site for Fusobacterium nucleatum SGB6007 (F. nucleatum subspecies animalis), Veillonella atypica SGB6936, Veillonella rogosae SGB6956, Veillonella dispar SGB6952, Streptococcus mutans SGB8000, and Streptococcus parasanguinis SGB8071. SGBs with ELPD > 8 from the PGLMM with body-site of origin as target variable are marked with an asterisk.
Extended Data Fig. 4
Extended Data Fig. 4. Correlation of the machine learning average ranks and the meta-analysis effect sizes of species in the comparisons of the study.
Correlation of the effect sizes estimated via meta-analysis (Hedges’ g SMD values, on the x-axis) with the average ranked feature importance derived from the machine learning (LODO, on the y-axis). Significant SGBs detected via the meta-analysis for the comparisons tested in the manuscript (controls vs CRC, early stages CRC vs late stages CRC, non-metastatic vs stage IV CRC and right-sided vs left-sided CRC) are in black (q < 0.1) and red (P < 0.01). The comparison controls vs CRC showed the highest Spearman’s correlation coefficient (0.41), with right-CRC vs left-CRC Spearman’s correlation coefficient of 0.21. This confirms the stronger biomarkers obtained by these comparisons, while the comparisons on stages presented non-significant correlation coefficients (Spearman’s correlation coefficient of 0.06 and 0.05 for early-stages vs late-stages and non-metastatic vs metastatic CRC, respectively).
Extended Data Fig. 5
Extended Data Fig. 5. Differential abundance analysis between tongue dorsum and dental plaque of CRC associated oral species in the gut and validation of the CRC biomarkers in patients with in situ or resected primary tumors.
A) Differential abundant oral SGBs in the signature of CRC between the oral plaque and tongue dorsum in the Human Microbiome Project (HMP) study. We selected 86 participants of the HMP study with matched microbiome samples for the two oral cavity sites. Differential abundance analysis was performed via Wilcoxon signed-rank test and adjusted p-values (q) were computed via Benjamini-Hochberg (BH) correction. q < 0.001 is indicated with ‘***’. log2 fold-change (FC) between average relative abundances (RA) in the two sites is reported in the heatmap. Positive values of the RA log2 FC indicate increased relative abundance in the plaque, while negative in the tongue dorsum subsite. B-D) Validation of the machine learning and CRC gut microbiome signature between patients with in situ or resected primary tumor in the AtezoTRIBE study.
Extended Data Fig. 6
Extended Data Fig. 6. Microbial pathways strongest associated either with CRC or controls.
Differentially abundant microbial pathways (meta-analysis model q < 0.1) between controls and CRC. Associations with CRC present Hedges’ g SMD > 0, and associations with controls present Hedges’ g SMD < 0. Significant single-dataset comparison (q < 0.1) is reported in dark gray, while non-significant single-dataset associations (q ≥ 0.1) is in lighter gray.
Extended Data Fig. 7
Extended Data Fig. 7. Associations of sulfur-related and histidine related pathways with CRC, tumor stages and primary tumor location.
A) Meta-analysis of sulfur-related pathways for controls vs CRC. Hedges’ g meta-analysis SMD and 95% confidence intervals are reported in the first plot. Significance level is indicated via a color gradient. P-values have been adjusted via Benjamini-Hochberg procedure for controlling FDR. Single cohort effect size levels are reported in the heatmap, ranging from dark blue for SMD = −1.5 to dark red for SMD = 1.5. Mean difference in abundance with species contribution for each pathway is reported in the stacked barplot on the right. B-C) Overview of histidine-related microbiome pathways and their associations with CRC, staging and primary tumor location. B) Meta-analysis of histidine-related pathways for controls vs CRC, early CRC (Stages 0-II) vs late CRC (Stages III-IV), non-metastatic CRC (Stages 0-III) vs metastatic CRC (Stage IV), and right-sided CRC and left-sided CRC. Hedges’ g meta-analysis SMD and 95% confidence intervals are reported in the first plot. Significance level is indicated via a color gradient. P-values have been adjusted via Benjamini-Hochberg procedure for controlling FDR. Single cohort effect size levels are reported in the heatmap, ranging from dark blue for SMD = −1.5 to dark red for SMD = 1.5. Mean difference in abundance with species contribution for each pathway is reported in the stacked barplot on the right. C) Visual representation of the biochemical mechanisms that lead to L-glutamate production from L-histidine, with the production as a side product of ammonium.
Extended Data Fig. 8
Extended Data Fig. 8. Microbial pathways that are differentially abundant in meta-analysis between early- vs late CRC and non-metastatic vs metastatic CRC.
A) Differentially abundant microbial pathways (meta-analysis model P < 0.01) between early (stages 0-II) and late (stages III-IV) CRC. Associations with CRC Stage III-IV present Hedges’ g SMD > 0, and associations with CRC Stages 0-II present Hedges’ SMD < 0. Significant single-dataset comparison (P < 0.01) is reported in dark gray, while non-significant single-dataset associations (P ≥ 0.01) is in lighter gray. B) Differentially abundant microbial pathways (meta-analysis model q < 0.1) between non-metastatic (stages 0-III) and metastatic (stage IV) CRC. Associations with stage IV present SMD > 0, and associations with CRC Stages 0-III present SMD < 0. Significant single-dataset comparison (q < 0.1) is marked in dark gray, while non-significant single-dataset associations (q ≥ 0.1) are in lighter gray.
Extended Data Fig. 9
Extended Data Fig. 9. SGBs strongest associated either with CRC or controls present different relative abundance changes along CRC stages.
Each line-plot represents the trends of an SGB in adenoma and the different stages of CRC in relation to controls’ abundances. Each point in the line is the coefficient from the linear mixed model (MaAsLin2) run to determine the association for each SGB and the different stages. Non-significant coefficients (q ≥ 0.1) are reported with a violet circle, while significant coefficients (either positive or negative, q < 0.1) are reported as a brown diamond. The x-axis of each line plot indicate the control, adenoma or stage: C for control, A for adenoma; 0 for CRC Stage 0; I for CRC Stage I; II for CRC Stage II; III for CRC Stage III; IV for CRC Stage IV.
Extended Data Fig. 10
Extended Data Fig. 10. Microbial pathways that are differentially abundant between right-sided and left-sided CRC.
Differentially abundant microbial pathways (meta-analysis model P < 0.01) between right-sided and left-sided CRC. Pathways associated with right-sided CRC present SMD < 0, and pathways associated with left-sided CRC present SMD > 0. Significant single-dataset comparisons (P < 0.01) are marked in dark gray, while non-significant single-dataset associations (P ≥ 0.01) are in lighter gray.

References

    1. Sung, H. et al. Global cancer statistics 2020: GLOBOCAN estimates of incidence and mortality worldwide for 36 cancers in 185 countries. CA Cancer J. Clin.71, 209–249 (2021). - PubMed
    1. Siegel, R. L., Wagle, N. S., Cercek, A., Smith, R. A. & Jemal, A. Colorectal cancer statistics, 2023. CA Cancer J. Clin.73, 233–254 (2023). - PubMed
    1. Keum, N. & Giovannucci, E. Global burden of colorectal cancer: emerging trends, risk factors and prevention strategies. Nat. Rev. Gastroenterol. Hepatol.16, 713–732 (2019). - PubMed
    1. Miller, K. D. et al. Cancer treatment and survivorship statistics, 2022. CA Cancer J. Clin.72, 409–436 (2022). - PubMed
    1. Huels, D. J. & Sansom, O. J. Stem vs non-stem cell origin of colorectal cancer. Br. J. Cancer113, 1–5 (2015). - PMC - PubMed

MeSH terms

Substances

LinkOut - more resources