. 2025 Jun;29(11):e70621.
doi: 10.1111/jcmm.70621.

Evaluating the Potential of COL8A1 as a Therapeutic Target for Chemoresistance, Disease Progression, and a Prognostic Marker in Gastric Cancer

Affiliations

Evaluating the Potential of COL8A1 as a Therapeutic Target for Chemoresistance, Disease Progression, and a Prognostic Marker in Gastric Cancer

Chao Xu et al. J Cell Mol Med. 2025 Jun.

Abstract

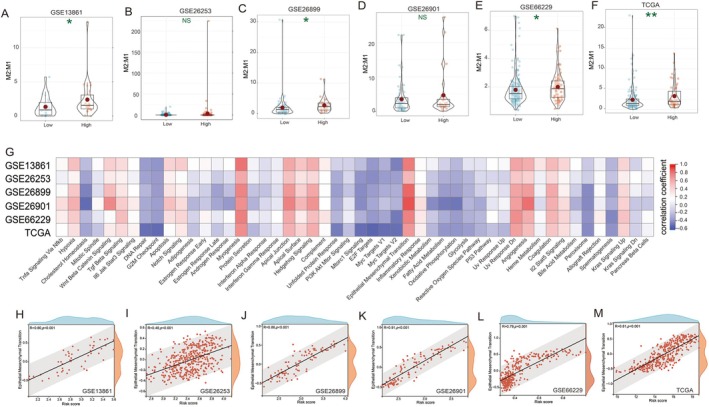
This study aimed to identify key genes associated with post-chemotherapy recurrence in gastric cancer patients. Gene expression data from multiple cohorts were analysed to determine differentially expressed genes between recurrent and non-recurrent cases. A prognostic risk model incorporating COL8A1, HSPB7 and SLIT2 was developed and validated across six independent cohorts. The risk score demonstrated significant associations with disease-free and overall survival, tumour grade and molecular subtypes. Notably, the risk score showed potential as a predictor of immunotherapy response, outperforming established markers such as microsatellite instability score and Epstein-Barr virus status. Analysis of the tumour immune microenvironment revealed a correlation between risk score and M2 macrophage infiltration. A nomogram integrating the risk score with clinical factors demonstrated high accuracy in predicting patient survival. Further investigation of COL8A1 revealed its significant role in gastric cancer cell proliferation, metastasis, and chemoresistance. In vitro and in vivo experiments showed that COL8A1 knockdown inhibited cancer cell growth, invasion, and metastasis while enhancing chemosensitivity. These findings provide valuable insights into the molecular mechanisms of gastric cancer recurrence and offer potential biomarkers for prognosis and treatment response prediction. The study highlights the importance of integrating genomic data with clinical information to improve patient stratification and personalised treatment strategies in gastric cancer management.

Keywords: COL8A1; chemotherapy; gastric cancer; immunotherapy; recurrence.


Conflict of interest statement

Animal Studies: Experimentation on zebrafish larvae younger than 5 days old does not require ethics committee approval. Our study adhered to ARRIVE guidelines for reporting animal research.

The authors declare no conflicts of interest.

Figures

FIGURE 1
FIGURE 1
Identification of key genes for recurrence after chemotherapy in GC. (A–C) Volcano plots and heatmaps display DEGs in GC patients post‐chemotherapy recurrence versus non‐recurrence in datasets (A) GSE13861, (B) GSE26899 and (C) GSE26901; (D, E) Venn diagrams show the intersection of (D) up‐regulated and (E) down‐regulated genes across three datasets; (F–H) Univariate Cox analysis of the 26 intersecting genes for prognosis in (F) GSE13861, (G) GSE26899 and (H) GSE26901 GC patient datasets; (I) Venn diagram displays the intersection of 17 genes with prognostic value across three datasets; (J) Distribution of 17 genes on chromosomes; (K) Protein–protein interaction analysis network of the 17 genes; (L) Expression correlation analysis of the 17 genes; (M) Mutation status of the 17 genes in GC tissues.
FIGURE 2
FIGURE 2
Prognostic model construction based on recurrence key genes for GC patients. (A, B) LASSO Cox regression to construct a prognostic model for GC patients; (C) Risk score, survival status and expression levels of the three genes across six GC datasets; The impact of risk score on patients' (D) DFS and (E) OS in six GC datasets. The grouping of risk score‐low and risk score‐high is established based on the optimal threshold. Statistical analysis was performed using the log‐rank test to assess differences in survival outcomes.
FIGURE 3
FIGURE 3
Correlation analysis of risk score with clinical characteristics of GC. (A) Difference analysis of risk scores across different grades in six GC datasets; (B) Different expression analysis of risk scores among subtypes in the TCGA dataset; (C) Different expression analysis of risk scores among subtypes in the GSE66229 dataset; (D) Differential expression analysis of TMB between high‐risk and low‐risk score subgroups; (E) Gene mutation analysis in high‐risk and low‐risk score subgroups; (F) Impact of differentially mutated genes on the prognosis of patients with GC in high‐risk and low‐risk score subgroups; Correlation analysis of mutated genes with (G) CD274, (H) CTLA4, and (I) PDCD1 expression. *p < 0.05; **p < 0.01; ***p < 0.001.
FIGURE 4
FIGURE 4
Prediction of immunotherapy response in GC by risk score. (A) Correlation between risk score and immunotherapy response in the KIM cohort; (B) Difference analysis of risk scores between PR/CR group and PD/SD group; (C) Proportions of patients with different responses to immunotherapy among two risk score subtypes; (D) Difference in risk score between EBV‐negative and ‐positive statuses; (E) Difference in risk score between low MSI score and high MSI score groups; (F) Different expression analysis of risk score among different subtypes in the KIM cohort; (G) Predictive value of risk score, MSI status, and EBV status in patients receiving immunotherapy in different cohorts; (H) Difference analysis of risk score between PR/CR group and PD group in the Hugo cohort; (I) Proportions of patients with different immunotherapy responses among two risk score subtypes in the Hugo cohort; (J) Impact of risk score on the prognosis of gastric cancer patients in the Hugo cohort; (K) Predictive value of risk score in the Hugo cohort. The grouping of Risk score‐Low and Risk score‐High is established based on the optimal threshold. Statistical analysis was performed using the log‐rank test to assess differences in survival outcomes.*p < 0.05; ***p < 0.001.
FIGURE 5
FIGURE 5
Relationship between risk score and GC immune microenvironment. (A) Ratio of M2/M1 in datasets GSE13861, (B) GSE26253, (C) GSE26899, (D) GSE26901, (E) GSE66229, (F) TCGA dataset; (G) Association between risk score and signalling pathways in six datasets; (H) Correlation between risk score and EMT in datasets GSE13861, (I) GSE26253, (J) GSE26899, (K) GSE26901, (L) GSE66229, (M) TCGA dataset. NS, p > 0.05; *p < 0.05; **p < 0.01.
FIGURE 6
FIGURE 6
High COL8A1 expression is an unfavourable prognostic factor for GC patients. (A) ROC analysis of COL8A1 in predicting recurrence after chemotherapy for diagnosed GC; (B) Differential expression of COL8A1 in cancer versus adjacent non‐cancerous tissues in datasets GSE66229, (C) GSE13861, (D) GSE26899, (E) TCGA; (F) Differential expression of COL8A1 in different grades in datasets GSE66229, (G) GSE13861, (H) GSE26899, (I) GSE26901, (J) GSE26253, (K) TCGA; (L) OS survival analysis of COL8A1 in six datasets; (M) DFS survival analysis of COL8A1 in six datasets; (N) Proportion of patients with different responses to immunotherapy against COL8A1; (O) Differential expression analysis of COL8A1 between PR/CR group and PD group in Hugo cohort; (P) Survival analysis of COL8A1 in Hugo cohort. The grouping of COL8A1‐Low and COL8A1‐High is established based on the optimal threshold. Statistical analysis was performed using the log‐rank test to assess differences in survival outcomes. NS, p > 0.05; *p < 0.05; **, p < 0.01; ***p < 0.001.
FIGURE 7
FIGURE 7
COL8A1 promotes proliferation, metastatic potential and drug resistance of GC cells. (A) RT‐PCR detection of COL8A1 expression after knockdown in (A) SNU‐1 and (B) AGS cells; CCK8 assay for changes in proliferation ability after COL8A1 knockdown in (C) SNU‐1 and (D) AGS cells; Effect of COL8A1 knockdown on migration and invasion abilities of SNU‐1 cells (E) migration and (F) invasion; Effect of COL8A1 knockdown on migration and invasion abilities of AGS cells (G) migration and (H) invasion; Effect of COL8A1 knockdown on in vivo proliferation and metastasis capabilities of AGS cells in zebrafish (I) proliferation and (J) metastasis; (K) Immunohistochemical detection of COL8A1 expression in GC tissues. IC50 assay for changes in drug IC50 of 5‐FU after COL8A1 knockdown in (L) SNU‐1 and (M) AGS cells. NS, p > 0.05; **, p < 0.01; ***, p < 0.001.

Similar articles

References

    1. Sun Y., Chen Y., Zhuang W., et al., “Gastric Cancer Peritoneal Metastasis Related Signature Predicts Prognosis and Sensitivity to Immunotherapy in Gastric Cancer,” Journal of Cellular and Molecular Medicine 27 (2023): 3578–3590. - PMC - PubMed
    1. Sun Y., Chen Y., Cai Y., et al., “Discovery of CDK Signature and CDK5 as Potential Biomarkers for Predicting Prognosis and Immunotherapeutic Response in Gastric Cancer Peritoneal Metastases,” American Journal of Cancer Research 13 (2023): 4087–4100. - PMC - PubMed
    1. Wang Q., Weng S., Sun Y., et al., “High DAPK1 Expression Promotes Tumor Metastasis of Gastric Cancer,” Biology 11 (2022). - PMC - PubMed
    1. Alsina M., Arrazubi V., Diez M., and Tabernero J., “Current Developments in Gastric Cancer: From Molecular Profiling to Treatment Strategy,” Nature Reviews. Gastroenterology & Hepatology 20 (2023): 155–170. - PubMed
    1. Jiang Y., Zhou K., Sun Z., et al., “Non‐Invasive Tumor Microenvironment Evaluation and Treatment Response Prediction in Gastric Cancer Using Deep Learning Radiomics,” Cell Reports Medicine 4 (2023): 101146. - PMC - PubMed

MeSH terms

Substances