. 2025 Jun 3;22(1):23.
doi: 10.1186/s12014-025-09542-8.

Plasma exosome proteomics reveals upregulation of CILP-1 in concave side of paraspinal muscle in adolescent idiopathic scoliosis

Affiliations

Plasma exosome proteomics reveals upregulation of CILP-1 in concave side of paraspinal muscle in adolescent idiopathic scoliosis

Qi Wang et al. Clin Proteomics. .

Abstract

Background: There is insufficient attention to the pathogenesis of abnormal radiological changes and molecular mechanism in the paraspinal muscles in AIS patients.

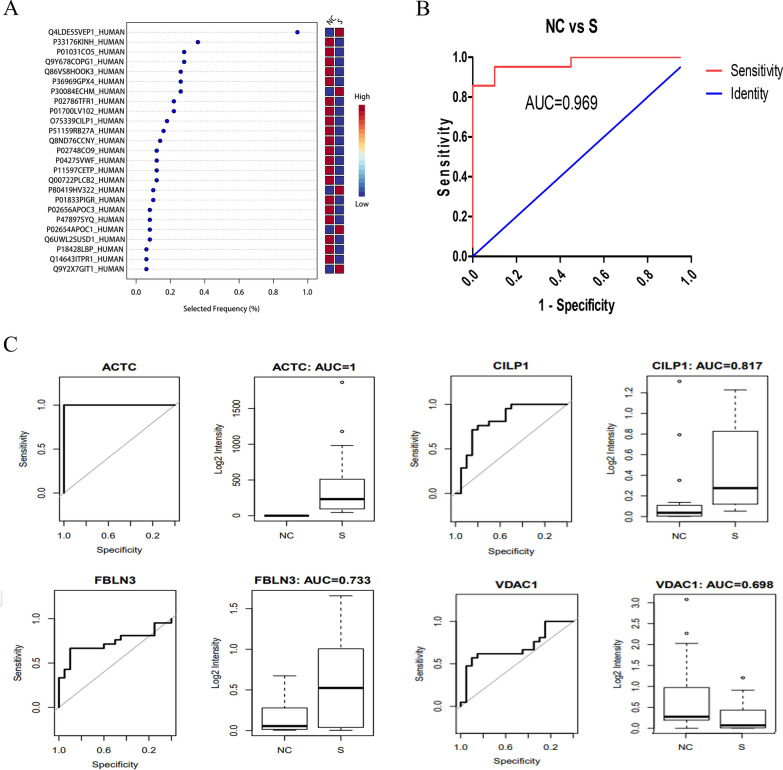
Methods: Proteomics of plasma exosomes were applied for identification of differentially expressed proteins (DEPs) in AIS patients through liquid chromatography mass spectrometry (LC-MS/MS). Bioinformatic analysis were performed to explore biomarkers. The muscle density (HU value) of the concave and convex sides of paravertebral muscles in AIS patients was compared. HE staining were applied for investigation of pathological changes of paravertebral muscles. Cartilage intermediate layer protein-1 (CILP-1), TGF-β1/Smad pathway and the downstream proteins were compared between the concave and convex side of paraspinal muscle. C2C12 cells were incubated with TGF-β1 or Smad3 phosphorylation inhibitor (SIS3) to further clarify the correlation between CILP-1 and TGF-β1/Smad pathway.

Results: A total of 2437 proteins were identified, among which DEPs were enriched in immune response and extracellular matrix-receptor interaction, while CILP-1 was screened out. HU value of concave multifidus muscle (MF) in apical vertebrae area was significantly lower when compared with both convex MF and control group. Muscle fibrosis, increased CILP-1, TGF-β1 phosphorylation of Smad2/3 and downstream proteins could be observed in the concave side of paraspinal muscle. TGF-β1 stimulation resulted in upregulation of CILP-1 and ECM related proteins, which could be partially inhibited by SIS3.

Discussion: We confirmed the asymmetric expressions of CILP-1 and TGF-β1/Smad signaling pathways in the paravertebral muscles of AIS patients. In C2C12 cells, TGF-β1 induced up-regulation of CILP-1 expression via Smad3 phosphorylation.

Keywords: Adolescent idiopathic scoliosis; CILP-1; Exosome; Paraspinal muscle; TGF-β1.


Conflict of interest statement

Declarations. Competing interests: The authors declare no competing interests.

Figures

Fig. 1
Fig. 1
Identification of isolated exosome. A Transmission electron microscopy image of plasma exosome of individuals, green arrows show"cup holder", round or oval exosomes between 50 and 150 nm in diameter. B NTA of plasma exosome reveals the average main peak of the particle size of exosomes was about 100 nm. C Protein concentration of exosome had no significant difference among control group, AIS follow-up group and AIS surgery group. D Representative immunoblots indicating that the exosome isolated from plasma present enrichment of the EV markers CD9, CD63, and TSG101. E Coomassie brilliant blue-stained gel obtained after SDS-PAGE gel showing the total proteins of exosomal proteins from plasma. P plasma, E exosome, S supernantant after ultracentrifugation
Fig. 2
Fig. 2
Differential proteomic analysis of plasma exosome from AIS and control group. A Volcano plot of differentially expressed proteins (ratio of the level of one exosome protein in AIS patient to its average level in control group). Upregulated and downregulated proteins with p < 0.05 are labeled as red and blue points respectively. B Heatmap of the proteins differentially expressed in the plasma exosome between AIS group and control group. C, D GO and KEGG analysis (DAVID bioinformatics database) of the proteins differentially present in plasma exosome of AIS group versus control group
Fig. 3
Fig. 3
Differential proteomic analysis of plasma exosome from AIS follow-up group and control group. A Volcano plot of differentially expressed proteins (ratio of the level of one exosome protein in AIS patient to its average level in control group). Upregulated and downregulated proteins with p < 0.05 are labeled as red and blue points respectively. B Heatmap of the proteins differentially expressed in the plasma exosome between AIS follow-up group and control group. C, D GO and KEGG analysis (DAVID bioinformatics database) of the proteins differentially present in plasma exosome of AIS follow-up group versus control group
Fig. 4
Fig. 4
Multiple model analysis of differentially expressed proteins between AIS group and control group and ROC analysis. A The 25 differentially expressed proteins obtained by random forest and support vector machine. Selected frequency represents the frequency (threshold) selected by the model, and the higher the frequency, the better discrimination between the two groups. B ROC curve analysis of the efficiency of 25 differentially expressed proteins in diagnosing AIS. C ROC curve of representative proteins between AIS group and control group
Fig. 5
Fig. 5
Heat map of 25 differentially expressed proteins screened by machine learning between AIS group and control group. A The expression of 25 differentially expressed proteins in the AIS follow-up group. B Heat map of the 25 differentially expressed proteins in control group, AIS follow-up group and AIS surgery group. C, D ROC cure analysis of ACTC and CILP-1 between AIS (follow-up) group and control group. Up and down regulated proteins were represented by red and blue, respectively
Fig. 6
Fig. 6
ELISA verification for ACTC, CILP-1, FBLN3 and VDAC1. AD The expression of ACTC, CILP-1, FBLN3 and VDAC1 between AIS group and normal control (NC) group. ****p ≤ 0.0001. E ROC analysis of ACTC, CILP-1, FBLN3 and VDAC1 for predicting AIS
Fig. 7
Fig. 7
Measurement of HU value of paraspinal muscles in AIS patients. A Full spine frontal X-ray and measurement of HU values of the bilateral multifidus (MF) and erector spinae (ES) in upper vertebra (T5 segment), apical vertebra (T9 segment), the lower apical vertebra (T10 segment). B Comparison of HU values of the concave and convex multifidus (MF) and erector spinae (ES) muscle of patients with Lenke 1 and Lenke 5 AIS patients. **p < 0.01, compared with convex side
Fig. 8
Fig. 8
Pathological changes and upregulation of CILP-1 and TGF-β1/Smad pathway in the concave side of paraspinal muscle in AIS patients. A Hematoxylin and eosin (HE) staining of the multifidus muscle region in AIS patients. Mild muscle fibrosis could be observed in the convex side of apical multifidus muscle (40× and 100× magnification). Large number of inflammatory cells (1000× magnification) and fatty infiltration (40× and 100× magnification) could be observed in the concave multifidus muscle of AIS patient, and more severe fibrosis changes than the convex side could be observed (100× magnification). B Immunoblot analysis of CILP-1 and TGF-β1 in the concave side indicated significant up-regulation than the convex side in multifidus muscle of AIS patients. ***p < 0.001, compared with convex side. C Phosphorylation of Smad2 and Smad3 in the concave side indicated significant up-regulation than the convex side in multifidus muscle of AIS patients. ***p < 0.001, compared with convex side. D Immunoblot analysis of Vimentin, Tenascin C, Fibronectin, Collagen1 A1, α-SMA in the concave side indicated significant up-regulation than the convex side in multifidus muscle of AIS patients. ***p < 0.001, compared with convex side
Fig. 9
Fig. 9
TGF-β1 promotes the expression of CILP-1 protein and downstream proteins in C2 C12 cells and SIS3 can partially inhibit the promoting effect of TGF-β1. A Western blot of CILP-1 expression in TGF-β1 stimulation group was significantly up-regulated when compared with normal control group, while CILP-1 decreased in TGF-β1+SIS3 stimulation group when compared with TGF-β1 stimulation (GAPDH as internal reference). ***p < 0.001, compared with normal control group. ###p < 0.001, compared with TGF-β1 stimulation group. B Phosphorylation of Smad 3 in TGF-β1 stimulation group was significantly up-regulated when compared with normal control group, while CILP-1 decreased in TGF-β1+SIS3 stimulation group when compared with TGF-β1 stimulation (GAPDH as internal reference). ***p < 0.001, compared with normal control group. ###p < 0.001, compared with TGF-β1 stimulation group. C Immunoblot analysis of Vimentin, Tenascin C, Fibronectin, Collagen1 A1, α-SMA in TGF-β1 stimulation group significantly increased compared with normal control group, while decreased in TGF-β1+SIS3 stimulation group when compared with TGF-β1 stimulation (GAPDH as internal reference). ***p < 0.001, compared with normal control group. ###p < 0.001, compared with TGF-β1 stimulation group
Fig. 10
Fig. 10
Asymmetric expression of TGF-β1/Smad/CILP-1 signaling during the pathogenesis of AIS

Similar articles

References

    1. Negrini S, Donzelli S, Aulisa AG, Czaprowski D, Schreiber S, de Mauroy JC, et al. 2016 SOSORT guidelines: orthopaedic and rehabilitation treatment of idiopathic scoliosis during growth. Scoliosis Spinal Disord. 2018;13:3. - PMC - PubMed
    1. Addai D, Zarkos J, Bowey AJ. Current concepts in the diagnosis and management of adolescent idiopathic scoliosis. Childs Nerv Syst. 2020;36(6):1111–9. - PMC - PubMed
    1. Latalski M, Danielewicz-Bromberek A, Fatyga M, Latalska M, Krober M, Zwolak P. Current insights into the aetiology of adolescent idiopathic scoliosis. Arch Orthop Trauma Surg. 2017;137(10):1327–33. - PMC - PubMed
    1. Garcia-Gimenez JL, Rubio-Belmar PA, Peiro-Chova L, Hervas D, Gonzalez-Rodriguez D, Ibanez-Cabellos JS, et al. Circulating miRNAs as diagnostic biomarkers for adolescent idiopathic scoliosis. Sci Rep. 2018;8(1):2646. - PMC - PubMed
    1. Sun ZJ, Jia HM, Qiu GX, Zhou C, Guo S, Zhang JG, et al. Identification of candidate diagnostic biomarkers for adolescent idiopathic scoliosis using UPLC/QTOF-MS analysis: a first report of lipid metabolism profiles. Sci Rep. 2016;6:22274. - PMC - PubMed

LinkOut - more resources