. 2025 Jun 3;23(1):262.
doi: 10.1186/s12964-025-02262-4.

Adipocyte/Tumor cell crosstalk via IGF-1/TXNIP axis promotes malignancy and endocrine resistance in breast cancer

Affiliations

Adipocyte/Tumor cell crosstalk via IGF-1/TXNIP axis promotes malignancy and endocrine resistance in breast cancer

Amanda Caruso et al. Cell Commun Signal. .

Abstract

Background: Despite significant improvements in the outcome of Estrogen Receptor (ER) α-positive breast cancer (BC) following the use of endocrine therapies, resistance remains a major challenge. Clinical studies proved that obesity, in addition to promote BC progression, is associated with a reduced efficacy to these treatments, but mechanisms remain unclear.

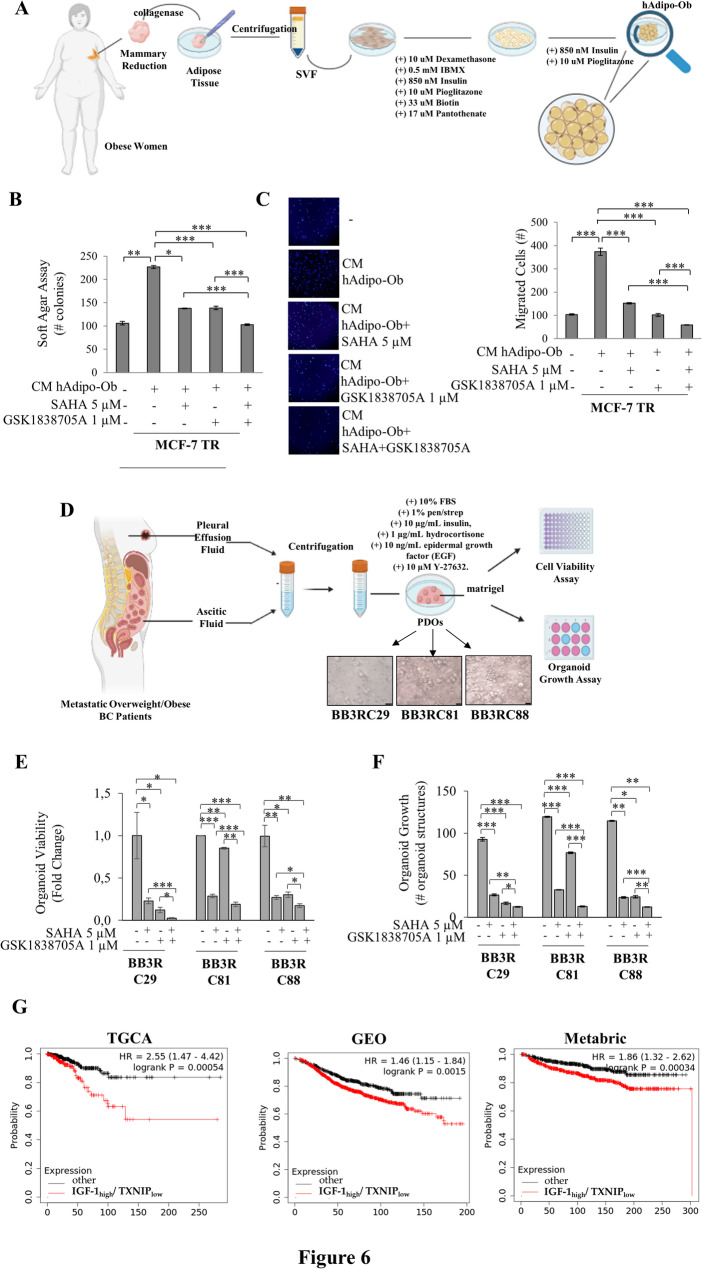
Methods: We used co-culture systems followed by validation through an ‘ex vivo’ model of human mammary obese (Ob) adipocytes and obese endocrine-resistant metastatic Patient-Derived Organoids (PDOs). Transcriptomics with MixOmics-MINT and MetaCore Functional Tools along with lentiviral and pharmacological approaches provide insights into mechanisms. Clinical relevance was investigated using public datasets, transcriptome-based (n = 375), and immunohistochemistry-based (n = 65) evaluations.

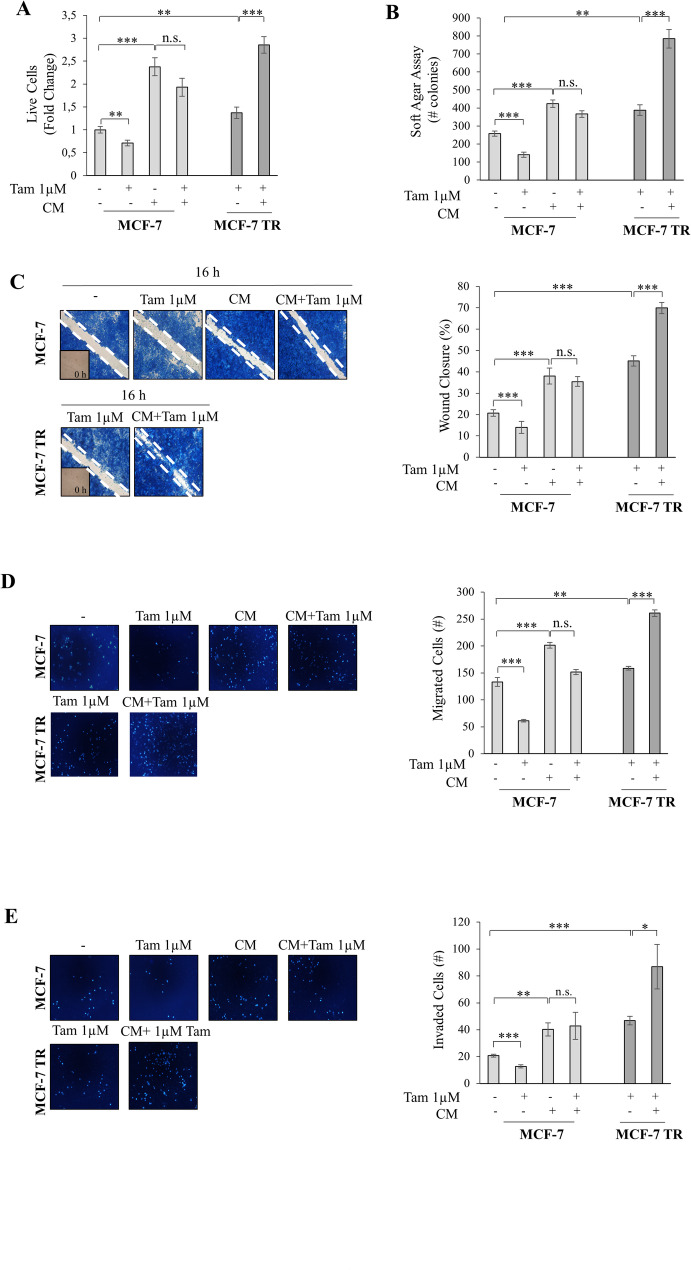
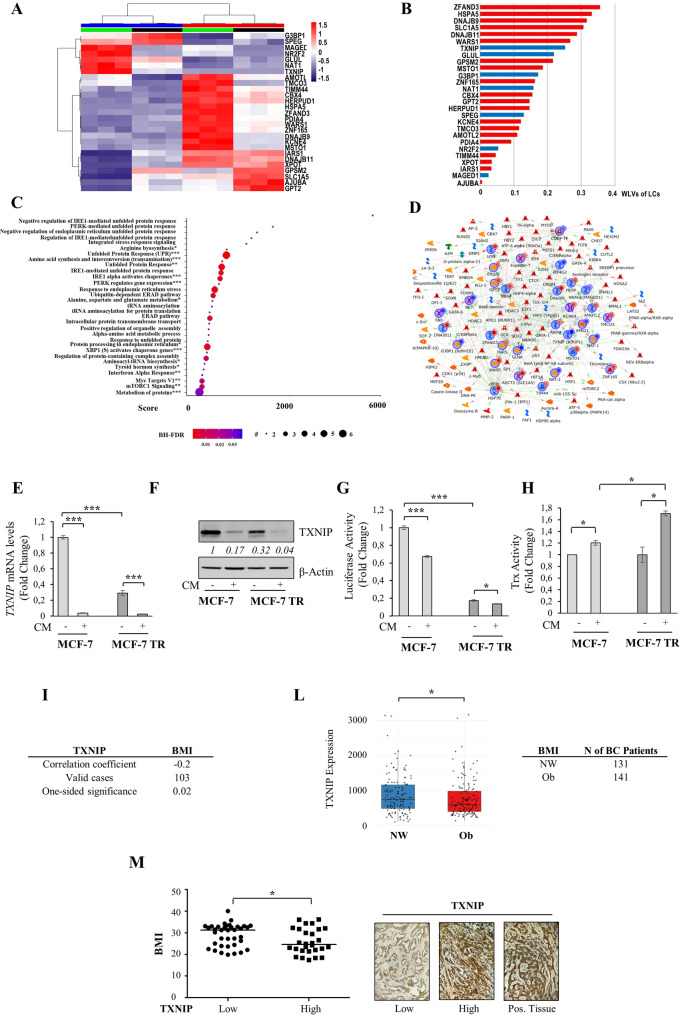
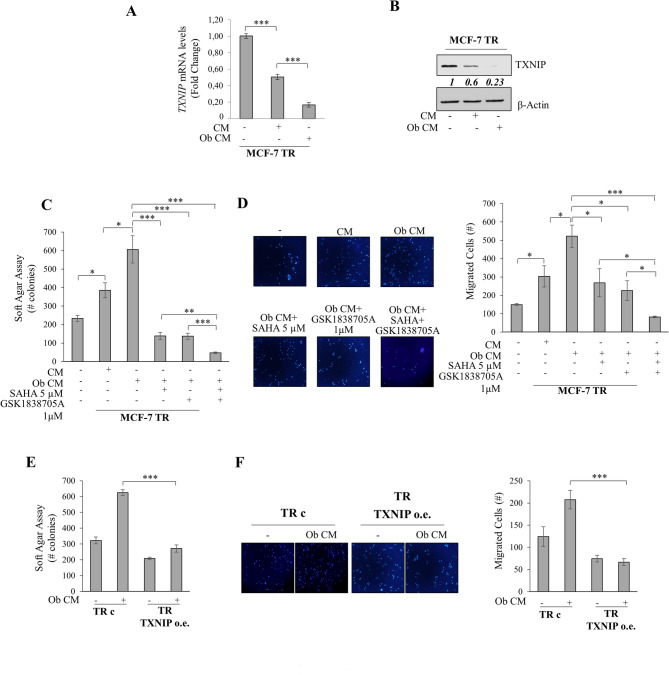
Results: In a model of co-culture, we demonstrated that conditioned media (CM) released by 3T3-L1A adipocytes reduced the sensitivity of parental MCF-7 BC cells to the inhibitory effects of Tamoxifen (Tam) on growth, motility and invasion and significantly increased the proliferative, motile and invasive phenotype of Tam-resistant (TR) BC cells. Transcriptomics identified TXNIP (Thioredoxin-interacting protein), a known tumor suppressor gene, as a network central hub, that was significantly down-regulated in CM-treated MCF-7 and TR cells. Accordingly, TXNIP expression was negatively correlated with Body Mass Index (BMI) in BC patients. Lentiviral TXNIP overexpression and pharmacological induction of TXNIP (i.e. SAHA) or the blockade of insulin-like growth factor-I (IGF-1) signaling, an obesity hallmark able to affect TXNIP expression, reversed CM-mediated effects. TXNIP down-regulation, proliferation and motility in TR cells were exacerbated by CM derived from Ob 3T3-L1A, and combination of an IGF-1 inhibitor and SAHA abrogated Ob-CM activities. Results were also validated in aromatase inhibitor-resistant BC cells. The effectiveness of IGF-1/TXNIP axis inhibition was confirmed using an ‘ex vivo’ model of human mammary obese adipocytes and PDO models. Finally, retrospective analyses demonstrated that an IGF-1high/TXNIPlow signature was correlated with poorer survival in endocrine-treated BC patients.

Conclusions: In conclusion, our study sheds new light on adipocyte/BC cell crosstalk, underscoring the potential of targeting IGF-1/TXNIP axis to block this harmful connection, especially in the context of obesity.

Supplementary Information: The online version contains supplementary material available at 10.1186/s12964-025-02262-4.

Keywords: Adipocytes; Breast Cancer; Endocrine resistance; IGF-1; Obesity; TXNIP; Tumor microenvironment.


Conflict of interest statement

Declarations. Ethics approval and consent to participate: This study was performed in accordance with the Declaration of Helsinki. All clinical specimens and information involved in this study provided informed consent before collection and were approved by The Ethics Committee as specified in Methods’ section. Consent for publication: N/A. Competing interests: The authors declare no competing interests.

Figures

Fig. 1
Fig. 1
Effects of 3T3-L1A conditioned medium (CM) on growth, motility, and invasion of MCF-7 and MCF-7 TR BC cells. (A) Trypan blue cell count assay in MCF-7 and MCF-7 TR BC cells treated (+) or not (-) with Tam and/or 3T3-L1A-derived CM for 48 h. (B) Soft agar growth assays in cells treated as indicated. After 14 days of growth, colonies ≥ 50 μm were counted. (C) Wound healing assay in MCF-7 and MCF-7 TR cells treated as indicated for 16 h. Inset, time 0. Left panel, representative pictures. Right panel, the histograms represent the relative percentage of wound closure calculated by image analysis using Scion Image software. Transmigration (D) and invasion (E) assays in MCF-7 and MCF-7 TR cells treated as indicated for 5 h. The migrated/invaded cells were DAPI-stained, counted, and images were captured at 10X magnification. Representative images of cell transwell migration and invasion are shown. Mean ± S.E.M. n.s., non significant; *, P < 0.05; **, P < 0.005; ***, P < 0.0005
Fig. 2
Fig. 2
Effects of 3T3-L1A CM on TXNIP expression and activity in MCF-7 and MCF-7 TR cells. (A) Correlation heatmap of 27 selected genes of integrative MixOmics model. Tree-clustering was obtained according Ward’s method. 3T3-L1A CM and Control media (C) were shown in column annotation as red and blue, respectively. Similarly, the MCF-7 and MCF-7 TR cells were reported as green and black, respectively. (B) Horizontal bar plot visualizing the mean weight of each selected gene in the classification of a given condition in PLS-DA integrated model. The red and blue loadings represent the contribution of 3T3-L1A CM and C, respectively, as final outcome of interest. WLVs of LCs: weight of each loading vectors of latent components. (C) Enrichment analysis on terms from Biological Process Gene Ontology, KEGG, Reactome, and MSigDB annotating the 27 genes presenting similar modulation trends in both MCF-7 and MCF-7 TR cells treated with 3T3-L1A CM. The size and colour of each dot indicate number of genes per term and the BH-FDR value, respectively. The reference databases are: GO Biological Process (no star), Kegg (*), MSigDB (**), and Reactome (***). Score: combined score of EnrichR. (D) Shortest Path Network (SPN) built by processing the 27 genes with similar deregulation trends in 3T3-L1A CM-treated MCF-7 and 3T3-L1A CM-treated MCF-7 TR cells. Edge colours and arrowheads indicate the type and the direction of protein interconnections (green arrow = positive effect; red arrow = negative effect; and grey arrow = unspecified interaction). (E) Real-time RT‐PCR for TXNIP mRNA levels in MCF-7 and MCF-7 TR cells treated (+) or not (-) for 48 h with 3T3-L1A CM. (F) Immunoblotting showing TXNIP protein expression in cells treated as indicated for 48 h. β-Actin was used as a control for equal loading and transfer. Numbers below the blots represent the mean of the band optical density expressed as fold over CM-untreated MCF-7 cells. (G) TXNIP promoter activity in cells treated as indicated for 24 h. (H) TRX activity in cells treated as indicated for 48 h. Mean ± S.E.M. *, P < 0.05; ***, P < 0.0005. (I) Spearman rank correlation between TXNIP and BMI in 103 BC patients with known BMI. (L) One-sided Mann-Whitney U test after back-transformation of log2 values for evaluating TXNIP expression in Normal Weight (NW, n = 131) and Obese (Ob, n = 141) patients. (M) Immunohistochemical detection of TXNIP expression in normal weight, overweight and obese patient-derived breast cancer tissues (n = 65). Left Panel, statistically significant difference between TXNIP expression and BMI values was evaluated using the Mann-Whitney U test (*, P = 0.0382). Right Panel, representative IHC images showing low and high cytoplasmic TXNIP expression in breast cancer epithelial tissues. Pos. Tissue, IHC staining in tonsil, used as positive control tissue. Magnification: 20X. Scale bar: 50 μm
Fig. 3
Fig. 3
Pharmacological and genetic re-expression of TXNIP counteract 3T3-L1A CM effects on MCF-7 and MCF-7 TR BC cells. (A) Immunoblotting showing TXNIP protein expression in MCF-7 and MCF-7 TR cells treated (+) or not (-) with 3T3-L1A CM with/without the histone deacetylase inhibitor (HDAC) SAHA or the histone methyltransferase EZH2 inhibitor DZNeP for 48 h at 0.1, 1, 5, or 10 µM concentration. GAPDH was used as a control for equal loading and transfer. Soft agar growth (B) and Transmigration (C) assays in cells treated (+) or not (-) with 3T3-L1A CM ± SAHA (5 µM) or DZNeP (10 µM). (D) Immunoblotting showing TXNIP protein expression in cells stably overexpressing Myc-tagged human TXNIP protein (o.e.) or empty vector (c) using TXNIP (upper panel) and c-Myc (lower panel) antibodies. GAPDH was used as a control for equal loading and transfer. Soft agar growth (E) and Transmigration (F) assays in c and TXNIP o.e. cells treated (+) or not (-) with 3T3-L1A CM. Representative images of cell transwell migration are shown. Mean ± S.E.M. *, P < 0.05; **, P < 0.005; ***, P < 0.0005
Fig. 4
Fig. 4
IGF-1 signaling inhibitors affect 3T3-L1A CM-mediated effects in MCF-7 and MCF-7 TR BC cells. (A) Immunoblotting showing TXNIP protein expression in MCF-7 and MCF-7 TR cells treated (+) or not (-) with 3T3-L1A CM in the presence or not of the IGF-1R inhibitor GSK1838705A (1 µM) and the mTOR inhibitor Everolimus (1 nM) for 48 h. IGF-1 (50 ng/mL) was used as a positive control. GAPDH was used as a control for equal loading and transfer. Numbers below the blots represent the mean of the band optical density expressed as fold over CM-untreated cells. Soft agar growth (B) and Transmigration (C) assays in cells treated as indicated. Representative images of cell transwell migration are shown. Mean ± S.E.M. *, P < 0.05; **, P < 0.005; ***, P < 0.0005
Fig. 5
Fig. 5
Targeting IGF-1/TXNIP axis in obesity-induced Tam resistance. (A) Real-time RT‐PCR for TXNIP mRNA levels in MCF-7 TR cells treated (+) or not (-) with 3T3-L1A CM (CM) and obese 3T3-L1A CM (Ob CM), generated by supplementation with 1mM of a 1:2:1 palmitate (C16:0), oleate (C18:1), and linoleate (C18:2) mixture for 24 h. (B) Immunoblotting showing TXNIP protein expression in cells treated as indicated for 48 h. β-Actin was used as a control for equal loading and transfer. Numbers below the blots represent the mean of the band optical density expressed as fold over CM-untreated MCF-7 TR cells. Soft agar growth (C) and Transmigration (D) assays in MCF-7 TR cells treated with 3T3-L1A CM and Ob CM ± SAHA (5 µM) and/or GSK1838705A (1 µM). For combination treatments, the same concentrations used for single-agent exposures were applied. Soft agar growth (E) and Transmigration (F) assays in vector (c) and TXNIP overexpressing MCF-7 TR cells (o.e.) treated with Ob CM. Representative images of cell transwell migration are shown. Mean ± S.E.M. *, P < 0.05; **, P < 0.005; ***, P < 0.0005
Fig. 6
Fig. 6
IGF-1/TXNIP axis in patients with BC. (A) A flow scheme showing the isolation of primary mammary adipocytes from obese women (h Adipo-Ob). Soft agar growth (B) and Transmigration (C) assays in MCF-7 TR cells treated with CM isolated from h Adipo-Ob ± SAHA (5 µM) and/or GSK1838705A (1 µM). Representative images of cell transwell migration are shown. (D) A flow scheme showing the isolation of Patient-derived Organoids (PDOs) from overweight/obese metastatic endocrine resistant BC patients. Representative images of PDOs are shown. Scale bar: 20 μm (E) Relative luminescence of PDOs treated (+) or not (-) with SAHA (5 µM) and/or GSK1838705A (1 µM). The combination regimens were administered at the same doses as the individual treatments. Spheroids were cultured for 9 days before their luminescence was measured. (F) Number of organoids treated as indicated. Organoids were counted after 12 days. Mean ± S.E.M. *, P < 0.05; **, P < 0.005; ***, P < 0.0005. (G) Kaplan-Meier survival analysis relating IGF-1/TXNIP levels and recurrence-free survival (RFS) in TGCA, GEO, and Metabric datasets, including ERα-positive BC patients treated with endocrine therapy

References

    1. Dai H, Alsalhe TA, Chalghaf N, Riccò M, Bragazzi NL, Wu J. The global burden of disease attributable to high body mass index in 195 countries and territories, 1990–2017: an analysis of the global burden of disease study. PLoS Med. 2020;17:e1003198. 10.1371/journal.pmed.1003198. - PMC - PubMed
    1. Pati S, Irfan W, Jameel A, Ahmed S, Shahid RK. Obesity and cancer: A current overview of epidemiology, pathogenesis, outcomes, and management. Cancers (Basel). 2023;15. 10.3390/cancers15020552. - PMC - PubMed
    1. García-Estévez L, Cortés J, Pérez S, Calvo I, Gallegos I, Moreno-Bueno G. Obesity and breast cancer: A Paradoxical and controversial relationship influenced by menopausal status. Front Oncol. 2021;11. 10.3389/fonc.2021.705911. - PMC - PubMed
    1. Alarcón Rojas CA, Alvarez-Bañuelos MT, Morales-Romero J, Suárez-Díaz H, Hernández-Fonseca JC, Contreras-Alarcón G. Breast cancer: metastasis, molecular subtypes, and overweight and obesity in Veracruz, Mexico. Clin Breast Cancer. 2019;19:e166–71. 10.1016/j.clbc.2018.08.003. - PubMed
    1. Lohmann AE, Soldera SV, Pimentel I, Ribnikar D, Ennis M, Amir E, et al. Association of obesity with breast Cancer outcome in relation to Cancer subtypes: A Meta-Analysis. J Natl Cancer Inst. 2021;113:1465–75. 10.1093/jnci/djab023. - PMC - PubMed

LinkOut - more resources